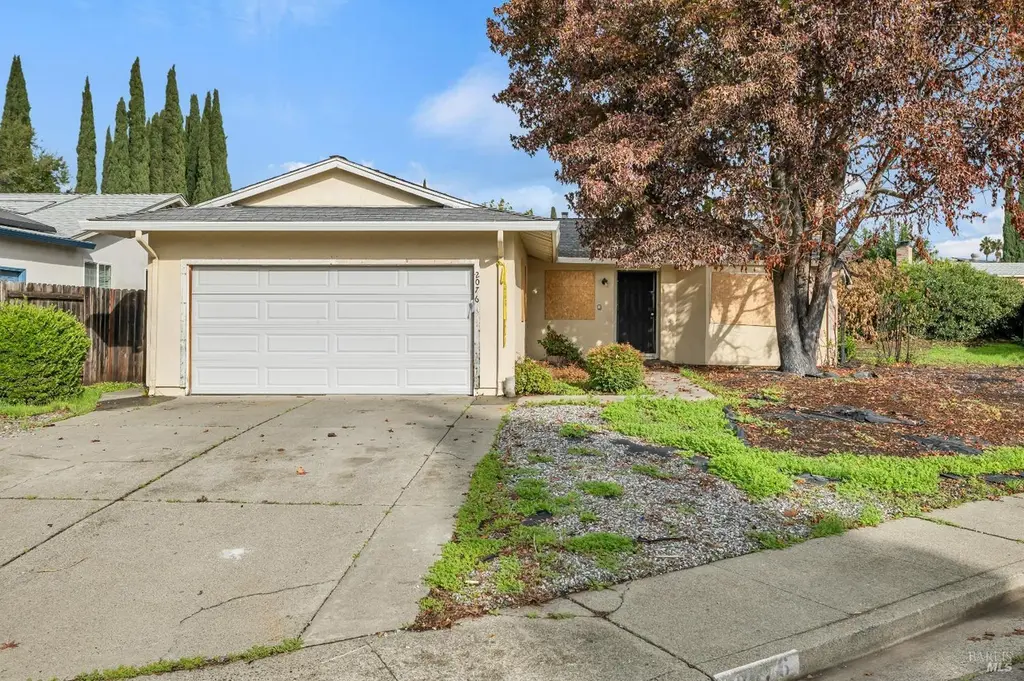
2076 Harte Ct · Fairfield, CA
Flood risk 1/10 · Minimal
- FEMA flood zone
- X (unshaded)
- Chance of flooding over 30 yrs
- 0.0%
- Est. flood insurance / yr
- $507 – $1,088
Fire risk 6/10 · Moderate
- Est. fire insurance / yr
- $659 – $1,223
Heat risk 6/10 · Moderate
- Hot days now (above 97°F)
- 7 days/yr
- Hot days in 30 yrs
- 14 days/yr
Wind risk 1/10 · Minimal
- Chance of severe wind over 30 yrs
- —
Air-quality risk 10/10 · Severe
- Unhealthy air days now
- 21 days/yr
- Unhealthy air days in 30 yrs
- 22 days/yr
Risk factors via First Street. Map © Google.
Why this score? — see what drove the D+ grade
The composite is a weighted blend of 9 inputs, each scored 0–100. Each bar is that input's sub-score; the figure is the points it added to the 100-point composite (weight × sub-score).
- ARV discount +15.0/15.0
- Cash flow +14.9/30.0
- DSCR +4.6/10.0
- Schools +3.5/10.0
- 1% rule +3.4/10.0
- Livability +3.4/5.0
- Rent growth +2.5/5.0
- Condition / age +2.5/5.0
- Appreciation +0.0/10.0
$290,000
🖨 Deal sheet (PDF) 📄 Offer letter ✓ Due diligence
Listing remarks
Exceptional Investment Opportunity in Fairfield Discover the potential in this 3-bedroom, 2-bath home offering 1,204 square feet of living space. Situated in a well-established neighborhood, the property has sustained fire damage and is ideal for investors, contractors, or buyers seeking a full renovation project. The home features a functional floor plan with generously sized rooms an excellent foundation for a custom redesign. Its convenient location provides easy access to shopping, dining, schools, and major commuter routes, adding to its long-term appeal. With vision and craftsmanship, this property can be transformed into a beautiful and modern residence. A prime opportunity for thos
Key facts
- 6,534 sq ft lot
- 2 garage spots
- Built 1976
Property features AI
Finance
- Other: Directions provided to property
- HOA & community: No association
Exterior
- Parking: Attached 2-car garage; Total of 2 parking spaces
- Utilities: Public water; Public sewer
- Home design: Attached single-family residence; One-story; Built in 1976; Property listed as fixer condition
- Construction: Year built: 1976
- Exterior features: Low-maintenance lot; No private pool or spa; Does not allow horses
Interior
- Kitchen: No specific appliances listed
- Bedrooms: 3 bedrooms (all on main level)
- Bathrooms: 2 full bathrooms
- Heating & cooling: Central heating; Central cooling
- Interior features: Brick fireplace (one)
- Laundry & utility: Laundry inside with hookups only
Neighborhood map
What this means for you Summary
Snapshot
- This is a 3-bed/2.0-bath single-family listed at $290k.
Deal economics
- At list price, monthly cash flow is $86 ($1k/yr) — positive.
- The deal already cash-flows at list — no discount required.
- To meet the 1% rule (rent ≥ 1% of price), the offer needs to be $243k (16.3% below list).
- Recommended offer: $243k (16.3% below list) — sets the bar for 1% rule.
- Cap rate 6.6% vs local median 3.0% in Fairfield — top-decile yield for the area; either an underpriced asset or a hidden risk that comps aren't pricing in. Stress-test before assuming the spread holds.
Location & tenants
- Location reads 67/100 on livability (#314 in CA) — a middle-class / working-renter tenant base. Strengths: employment A+, housing A+, health & safety A+; Watch: schools C-, crime D-, commute F.
- Fairfield-Suisun Unified (urban): math 23% / reading 53% proficiency, ranked #238 of 517 in CA (top 46%) — families likely to look elsewhere, expect single-tenant / working-renter base with shorter leases.
- Market conditions: Rents flat; 266 active listings in the ZIP; 28 comparable units currently listed for rent nearby; rentals lingering (median 45d on market — plan ~5-8 weeks vacancy on turnover, expect pricing pressure); 50% of comp listings sitting > 30 days — soft ceiling on asking rent; solid renter incomes; 1,472 units permitted in Solano County in 2024 (131 in 5+ unit buildings).
- This rent runs 33% of the median local income ($87k/yr) — at the standard rent-burdened threshold; future hikes will face affordability resistance.
Forward outlook
- Local home prices are declining (-3.0%/yr); year-one equity from $2k of loan paydown is wiped out by about $9k of value loss. Plan a longer hold.
- Solano County population projected at +15% by 2050 — modest demand growth; plan on rents tracking national, not racing it.
Negotiation context
- Only 5 days on market — expect competitive offers; lowballing is unlikely to land.
- 2 sale attempts; this cycle's ask is 9903% above the opening price — seller raised mid-cycle; expect resistance to lowballs.
Risks & watch-outs
- Climate carrying-cost: major wildfire risk; extreme-heat days projected 7→14/yr by 2055 (HVAC capex compounding) — expect insurance premiums to compound above CPI over the hold.
Questions for the listing agent
- Built in 1976 — when were the roof, HVAC, electrical panel, plumbing, and water heater last replaced?
- Is there a deadline driving the sale (1031 exchange, divorce, estate, relocation)? That informs how much negotiation room exists.
- Crime grade is D in this area — have there been break-ins, vandalism, or insurance claims at this property in the last 3 years? What carrier currently insures it and at what premium?
- The area grade is low — what's the realistic commute time and amenity access for the typical tenant pool here? Any planned neighborhood developments (good or bad) we should know about?
- What's the average days-on-market for RENTAL listings here right now (not sales)? A rising rental-DOM trend means longer vacancies and softer asking-rent achievability than the comps imply.
- What's the recent tenant-quality profile in this submarket — average credit score on applications, eviction rate, late-payment / NSF rate, and stable-employment percentage? A property-management company in the area should have these aggregated.
- How much new for-sale + rental construction is in the pipeline within 1–3 miles? Heavy new supply typically softens prices + rents 12–24 months out; constrained supply supports both.
Investment metrics
- 1% rule
- 0.84% ✗
- Cap rate
- 6.65%
- Cash-on-cash
- 1.26%
- DSCR
- 1.06
- GRM
- 10.0
CMA / ARV
- ARV (median comp)
- $532,031
- List price
- $290,000
- Delta
- -45.49%
- Verdict
- UNDERPRICED
- Comps
- 20 within 1.0 mi
Show comp detail 12 sales within ~0.75 mi
| Address | Dist | Beds/Ba | Sqft | Sold | Price | $/sf | Match |
|---|---|---|---|---|---|---|---|
| 2076 Harte Ct | 0.00mi | 3/2.0 | 1,204 (0%) | 1mo | $292,000 | $243 | 99 |
| 1463 Quail Dr | 0.22mi | 3/2.0 | 1,208 (+0%) | 1mo | $455,000 | $377 | 88 |
| 2148 Tilden Pl | 0.12mi | 3/2.0 | 1,208 (+0%) | 15mo | $525,000 | $435 | 82 |
| 2041 Davis Dr | 0.09mi | 3/2.0 | 1,204 (0%) | 18mo | $470,000 | $390 | 81 |
| 1213 Sprig Ct | 0.40mi | 3/2.0 | 1,128 (-6%) | 3mo | $510,000 | $452 | 68 |
| 1229 Willet Ct | 0.35mi | 3/2.0 | 1,128 (-6%) | 13mo | $480,000 | $426 | 62 |
| 2000 Cormorant Dr | 0.54mi | 3/2.0 | 1,248 (+4%) | 14mo | $525,000 | $421 | 57 |
| 1926 Blossom Ct | 0.73mi | 3/2.0 | 1,096 (-9%) | 0mo | $505,000 | $461 | 51 |
| 1125 Gannet Ct | 0.59mi | 3/2.0 | 1,310 (+9%) | 13mo | $495,000 | $378 | 47 |
| 1239 Mallard Ct | 0.37mi | 4/2.0 (+1) | 1,380 (+15%) | 9mo | $489,250 | $355 | 46 |
| 1168 Sanderling Dr | 0.47mi | 4/2.0 (+1) | 1,380 (+15%) | 6mo | $520,000 | $377 | 44 |
| 1042 Tanager Ln | 0.73mi | 4/2.0 (+1) | 1,376 (+14%) | 23mo | $555,000 | $403 | 18 |
Match score weights: distance 35% · size 25% · config 20% · recency 20%. Top-matched comps best support the ARV.
Projected returns pro-forma
-3.0% appreciation · 0.15% rent growth · sell at horizon
- IRR
- -17.3%
- Equity multiple
- 0.40×
- Total profit
- $-48,380
- Equity at exit
- $43,240
- IRR
- -15.2%
- Equity multiple
- 0.24×
- Total profit
- $-61,618
- Equity at exit
- $25,074
Cash invested: $81,200 (down + closing). Projections, not guarantees.
Landlord ↔ Tenant lean methodology
- Overall (STATE)
- 18 Strongly Tenant-Friendly
- State California
- 18 Strongly Tenant-Friendly · D+13
- County
- — inherits STATE
- City
- — inherits STATE
ZIP-level market 94533
- Rents YoY
- 0.1%
- Active inventory
- 266
- Price-to-rent
- 10.0×
Monthly cashflow live
- Estimated rent
- $2,426 high interval (Pro) →
- Mortgage (P&I)
- −$1,521
- Tax from tax record
- −$189 /mo · $2,274/yr
- Insurance
- −$121
- HOA
- −$0
- Vacancy / Maint / Mgmt
- −$509
- Net cashflow
- $86
Break-even live
Sensitivity live
| Price | -10% $250 | -5% $168 | +0% $86 | +5% $3 | +10% $-79 |
|---|---|---|---|---|---|
| Rent | -10% $-106 | -5% $-10 | +0% $86 | +5% $181 | +10% $277 |
| Rate | -1.0pp $232 | -0.5pp $159 | base $86 | +0.5pp $10 | +1.0pp $-66 |
UW: 25.0% down · 7.5% · 30yr · 1.5% tax · 5.0% vac · 8.0% maint · 8.0% mgmt
Financing live
Cash to close
- Down payment
- $72,500
- Closing costs
- $8,700
- Reserves months
- —
- Total cash needed
- —
Loan-product check · same deal, 3 products live
Conventional
25% down · 7.5% · 30yr
- Down + closing
- —
- Monthly P&I
- —
- Monthly cashflow
- —
- DSCR
- —
- Eligible?
- —
Personal DTI + credit; lowest rate.
DSCR
20% down · 8.5% · 30yr
- Down + closing
- —
- Monthly P&I
- —
- Monthly cashflow
- —
- DSCR
- —
- Eligible?
- —
No personal income docs; deal must DSCR.
Hard money
10% down · 12.0% · 12mo
- Down + closing
- —
- Monthly P&I
- —
- Monthly cashflow
- —
- DSCR
- —
- Eligible?
- —
Short-term bridge; refi at stabilization.
Rent comps 28 comps
| Address | Beds | Baths | Sqft | Rent | $/sqft | DOM | Units | Dist |
|---|---|---|---|---|---|---|---|---|
| 2000 Clay Bank Rd Fairfield, CA | 1.0–2.0 | 1.0–2.0 | 834 | $2,719 | $3.26 | 3d | 10 | 0.34mi |
| 89 Villa Cir Fairfield, CA | 2.0 | 1.5 | 968 | $1,900 | $1.96 | 24d | 1 | 0.53mi |
| 1925 Grande Cir Unit 5 Fairfield, CA | 2.0 | 1.0 | 800 | $1,595 | $1.99 | 24d | 1 | 0.54mi |
| 1990 Grande Cir Fairfield, CA | 2.0 | 1.0–1.5 | 895 | $2,135 | $2.39 | 4d | 15 | 0.57mi |
| 1930 Grande Cir #77 Fairfield, CA | 2.0 | 2.0 | 1095 | $1,750 | $1.60 | 44d | 1 | 0.57mi |
| 1970 Grande Cir #19 Fairfield, CA | 2.0 | 1.5 | 1095 | $2,200 | $2.01 | 24d | 1 | 0.59mi |
| 1960 Grande Cir #42 Fairfield, CA | 3.0 | 1.5 | 1176 | $2,500 | $2.13 | 44d | 1 | 0.62mi |
| 1979 Grande Cir Fairfield, CA | 2.0 | 1.0 | 850 | $2,049 | $2.41 | 44d | 1 | 0.64mi |
| 1930 Manor Pl Unit 1 Fairfield, CA | 2.0 | 1.5 | 1100 | $2,150 | $1.95 | 22d | 1 | 0.69mi |
| 1400 Humphrey Dr Suisun City, CA | 2.0–3.0 | 1.5 | 1075 | $2,425 | $2.26 | 4d | 4 | 0.70mi |
| 1955 Grande Cir Unit U Fairfield, CA | 2.0 | 1.5 | 964 | $1,800 | $1.87 | 14d | 1 | 0.70mi |
| 1955 Grande Cir Unit U Fairfield, CA | 2.0 | 1.5 | 964 | $1,800 | $1.87 | 44d | 1 | 0.70mi |
| 1037 Mockingbird Ln Fairfield, CA | 3.0 | 2.0 | 1476 | $2,695 | $1.83 | 44d | 1 | 0.82mi |
| 2751 Peppertree Dr Fairfield, CA | 2.0 | 1.0–2.0 | 726 | $2,175 | $2.99 | 14d | 7 | 0.99mi |
| 1349 Blossom Ave Fairfield, CA | 1.0–3.0 | 1.0–3.0 | 1017 | $3,340 | $3.28 | 2d | 11 | 0.99mi |
| 849 Finch Way Fairfield, CA | 3.0 | 2.0 | 1300 | $2,895 | $2.23 | 44d | 1 | 1.00mi |
| 849 Finch Way Fairfield, CA | 3.0 | 2.0 | 1300 | $2,895 | $2.23 | 45d | 1 | 1.00mi |
| 766 E Tabor Ave Unit 12 Fairfield, CA | 2.0 | 1.0 | 950 | $1,750 | $1.84 | 44d | 1 | 1.15mi |
| 145 Del Rey Ct Fairfield, CA | 3.0 | 1.5 | 1164 | $2,500 | $2.15 | 14d | 1 | 1.16mi |
| 1890 Dover Ave Fairfield, CA | 1.0–2.0 | 1.0–2.0 | 835 | $1,995 | $2.39 | 14d | 2 | 1.27mi |
| 708 E Tabor Ave Unit 76612 Fairfield, CA | 2.0 | 1.0 | 950 | $1,750 | $1.84 | 44d | 1 | 1.28mi |
| 53 El Basset Ct Fairfield, CA | 2.0 | 1.5 | 997 | $2,100 | $2.11 | 14d | 1 | 1.29mi |
| 50 El Basset Ct #50 Fairfield, CA | 2.0 | 1.0 | 850 | $2,450 | $2.88 | 44d | 1 | 1.32mi |
| 2275 Dover Ave Fairfield, CA | 4.0 | 2.0 | 1468 | $3,100 | $2.11 | 44d | 1 | 1.34mi |
| 713 E Travis Blvd Fairfield, CA | 1.0–2.0 | 1.0–1.5 | 827 | $2,277 | $2.75 | 44d | 1 | 1.42mi |
| 2217 Santa Fe Ct Fairfield, CA | 3.0 | 2.0 | 1398 | $2,700 | $1.93 | 44d | 1 | 1.45mi |
| 1104 Waxwing Dr Suisun City, CA | 3.0 | 2.0 | 1279 | $3,079 | $2.41 | 44d | 1 | 1.46mi |
| 2800 Dover Ave Unit G6 Fairfield, CA | 2.0 | 1.0 | 950 | $2,095 | $2.21 | 24d | 1 | 1.49mi |
Listing history 12 events
-
2026-04-10soldstatus $285,000
-
2025-08-16historical $2,669
-
2025-08-13price $2,669
-
2025-08-07price $2,699
-
2025-08-03price $2,739
-
2025-07-24price $2,689
-
2025-07-17price $2,769
-
2025-07-10price $2,849
-
2025-07-01$2,899
-
2025-06-16historical $2,899
-
2025-06-08$2,899
-
2013-01-28soldstatus $164,500
ⓘ Source: listings_history table (triggers on properties + properties_extension) + one-shot
backfill from property_details.listing_events for pre-trigger history.
Tax reassessment forecast CA · Resets to sale price
- Current annual tax
- $2,274 · $189/mo
- Projected year-2 tax
- $2,274 · $189/mo
- Expected delta
- $0/yr ($0/mo · 0.0%)
ⓘ Screening estimate from a state-policy table — verify with the county assessor before closing.
Climate risk First Street
- Flood 1/10 Low FEMA zone X (unshaded) · 0% chance over 30 yrs
- Wildfire 6/10 Major
- Heat 6/10 Major 7 d/yr ≥97°F today · 14 d/yr by 30 yrs out
- Wind 1/10 Low
- Air quality 10/10 Extreme 21 unhealthy d/yr today · 22 by 30 yrs out
Nearby sold comps map
Loading sold comps map…
Walkable amenities ~0.75 mi
Loading nearby amenities…
Taxation est. · year 1
- Rental income
- $29,113
- − Mortgage interest
- −$16,245
- − Property taxes
- −$2,274
- − Insurance
- −$1,450
- − Repairs & maintenance
- −$2,329
- − Management
- −$2,329
- − Depreciation
- −$8,436
- Taxable loss
- −$3,950
- Est. tax savings @ 24.0%
- +$948
- After-tax cash flow
- $1,974/yr
For passive investors: Depreciation is non-cash, so a rental often shows a tax loss while cash-flowing — sheltering income. Rental losses are passive: they offset passive income freely, and up to $25,000/yr can offset ordinary (W-2) income if you actively participate and your MAGI is under $100k (phasing out to $0 by $150k); unused losses carry forward. On sale, claimed depreciation is recaptured at up to 25%, and gains may owe capital-gains tax (a 1031 exchange can defer both). Figures are a year-1 estimate at your 24.0% rate — not tax advice; consult a CPA.
Schools (NCES district)
- District
- Fairfield-Suisun Unified
- NCES district ID
- 0613360
- Math proficiency
- 23% ▼ -10.00%
- Reading proficiency
- 53% ▲ 8.00%
- Median HH income
- $69,654
- Composite
- 34.59/100
- National rank
- #5157
- State rank
- #238 of 517 in CA
Livability — Fairfield
- Score
- 67/100
- State rank
- #314
- US rank
- #10551
Category grades
Schools grade is shown separately in the Schools card above.
Census & demographics
- Census place
- Fairfield, CA
- County
- Solano County · 433,239 people
- City population
- 120,008
- Metro
- Vallejo, CA
- Population (ZIP)
- 78,805
- Household income
- $87,384
- Rent vs Own
- Severe rent burden
- 3474.0
Population outlook (Solano County) Hauer SSP2
- Today (2025)
- 478,685 people
- By 2030
- 497,974 · +4.0%
- By 2040
- 528,515 · +10.4%
- By 2050
- 549,115 · +14.7%
- By 2075
- 587,229 · +22.7%
- By 2100
- 571,378 · +19.4%
Race, ethnicity, and origin ACS 2023
- Neighborhood character
- Highly diverse neighborhood (Simpson 0.75)
- Race & ethnicity
- Hispanic / Latino 39% White 23% Black 16% Two or more races 16% Asian 14% Pacific Islander 1%
- Hispanic origin (detail)
- Mexican 34%
- Common ancestry
- Italian 5% Lithuanian 1% Slovak 1%
- Foreign-born
- 26% · Canada, Vietnam, China
- Languages at home
- 59% English-only · Spanish 28% Tagalog/Filipino 6% Other Indo-European 2%
Political lean MEDSL · Solano
- 2024 margin
- Strong D (+23.0) · D 60.0% · R 37.1% · Other 2.9%
- 2008→2024 swing
- -5.6pp toward R · 2008: 28.6pp · 2024: 23.0pp
- All cycles
- 2024: D+23.0 2020: D+30.3 2016: D+30.5 2012: D+28.1 2008: D+28.6
Not yet ingested
- Civics
- —
Market trends
- HPI YoY
- ▼ -258.88%
- Current HPI
- 285.4365
- Rent YoY
- ▲ 0.15%
- Metro
- Vallejo, CA
- State GDP YoY
- ▲ 3.21%
- F500 in state
- 116
Industry mix (Fortune 500 HQ in CA)
| Industry | F500 HQs | Revenue |
|---|---|---|
| Technology | 27 | $1,492B |
|
||
| Financial Services | 3 | $174B |
|
||
| Retail | 3 | $44B |
|
||
| Insurance | 3 | $26B |
|
||
| Media / Entertainment | 2 | $115B |
|
||
| Pharmaceuticals / Biotech | 2 | $62B |
|
||
Price history
+77.5% since first listed13 events — show timeline
- 2026-05-28 Sold (Public Records) $292,000 Public Records
- 2026-04-10 Sold (Public Records) $285,000 Public Records
- 2025-08-16 Rental Removed $2,669 Tricon
- 2025-08-13 Price Changed $2,669 Tricon
- 2025-08-07 Price Changed $2,699 Tricon
- 2025-08-03 Price Changed $2,739 Tricon
- 2025-07-24 Price Changed $2,689 Tricon
- 2025-07-17 Price Changed $2,769 Tricon
- 2025-07-10 Price Changed $2,849 Tricon
- 2025-07-01 Listed for Rent $2,899 Tricon
- 2025-06-16 Rental Removed $2,899 Tricon
- 2025-06-08 Listed for Rent $2,899 Tricon
- 2013-01-28 Sold (Public Records) $164,500 Public Records
Property tax history
+6.3%/yrLatest (2025): $2,274 · -0.0% YoY. Source: county tax records.
Cash-flow waterfall
monthlySold comps — $/sqft
last 12 mo · ≤1 miLoading sold comps…