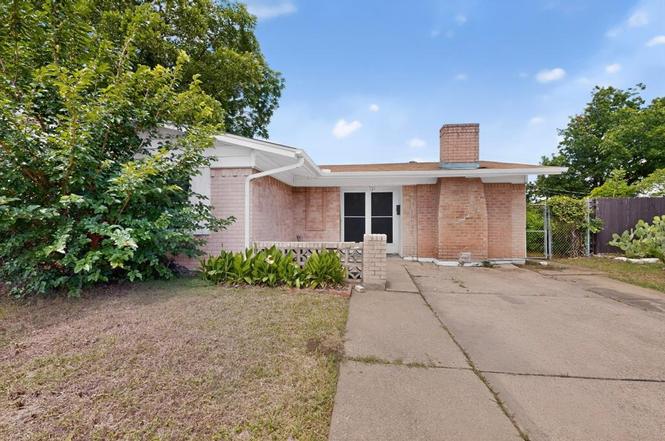
1802 Fairfax Ln · Carrollton, TX
Flood risk 1/10 · Minimal
- FEMA flood zone
- X (unshaded)
- Chance of flooding over 30 yrs
- 0.0%
- Est. flood insurance / yr
- $507 – $1,088
Fire risk 1/10 · Minimal
- Est. fire insurance / yr
- $1,222 – $2,270
Heat risk 7/10 · Major
- Hot days now (above 109°F)
- 7 days/yr
- Hot days in 30 yrs
- 23 days/yr
Wind risk 6/10 · Moderate
- Chance of severe wind over 30 yrs
- 27.0%
Air-quality risk 3/10 · Minor
- Unhealthy air days now
- 3 days/yr
- Unhealthy air days in 30 yrs
- 4 days/yr
Risk factors via First Street. Map © Google.
Why this score? — see what drove the D+ grade
The composite is a weighted blend of 9 inputs, each scored 0–100. Each bar is that input's sub-score; the figure is the points it added to the 100-point composite (weight × sub-score).
- ARV discount +15.0/15.0
- Cash flow +13.2/30.0
- 1% rule +5.5/10.0
- DSCR +4.0/10.0
- Livability +4.0/5.0
- Schools +3.0/10.0
- Condition / age +2.5/5.0
- Rent growth +1.3/5.0
- Appreciation +0.0/10.0
$179,900
🖨 Deal sheet (PDF) 📄 Offer letter ✓ Due diligence
Listing remarks
* * * Multiple Offers Received. Please send your highest and best offer by Monday June 15, 2026 10am!!!Investor Special! Nice neighborhood! Diamond in the rough! 4 bedrooms, 2 full bathrooms, ceiling fans, fireplace, nice yard and much more! * * *
Key facts
- 7,492 sq ft lot
- Garage
- Built 1962
Property features AI
Finance
- Other: Standard listing conditions; Possession at closing/funding
- Financial info: Listing terms: Cash; No second mortgage indicated
- HOA & community: No association (no HOA)
Exterior
- Parking: Driveway; Has garage (garage spaces not specified)
- Security: No specific security features provided
- Utilities: City water; City sewer; No municipal utility district
- Home design: Single-family residence; One story; Residential property
- Construction: Brick construction; Composition/shingle roof; Slab foundation; Built in 1962
- Exterior features: Interior lot; Less than 0.5-acre lot
Interior
- Kitchen: Electric oven
- Bedrooms: 4 bedrooms (all on the main level)
- Flooring: No flooring details provided
- Bathrooms: 2 full bathrooms
- Heating & cooling: Central heating; Central air conditioning; Wood-burning fireplace (1)
- Interior features: Cable TV available; One living area; One dining area; 5 total rooms
- Laundry & utility: No specific laundry details provided
Neighborhood map
What this means for you Summary
Snapshot
- This is a 2-bed/2.0-bath single-family listed at $180k.
Deal economics
- At list price, monthly cash flow is $-4 ($-48/yr) — negative.
- To cash-flow at today's rent, offer at most $179k (0.4% below list).
- Meets the 1% rule at list price ($2k rent vs $180k).
- Recommended offer: $179k (0.4% below list) — sets the bar for cash-flow.
- Cap rate 6.3% vs local median 3.1% in Carrollton — top-decile yield for the area; either an underpriced asset or a hidden risk that comps aren't pricing in. Stress-test before assuming the spread holds.
Location & tenants
- Location reads 79/100 on livability (#54 in TX, #2,159 nationally) — a middle-class / working-renter tenant base. Strengths: employment A+, housing A+, health & safety A; Watch: commute F.
- Carrollton-Farmers Branch ISD (suburban): math 31% / reading 36% proficiency, ranked #518 of 826 in TX (top 63%) — families likely to look elsewhere, expect single-tenant / working-renter base with shorter leases.
- Zoned schools: Central El (math 28% / reading 27%, grade F, #2,768 of 4,322 statewide, top 65%, 468 students, 93% FRL); Perry Middle (math 36% / reading 36%, grade F, #805 of 1,662 statewide, top 50%, 831 students, 79% FRL); Turner H S (math 26% / reading 30%, grade F, #1,170 of 1,632 statewide, top 72%, 2,107 students, 70% FRL) — zoned schools average 81% FRL vs 58% district-wide (23 pts higher); higher-poverty schools than district average — tighter screening recommended.
- Market conditions: Rents falling (-4.7%/yr); 192 active listings in the ZIP; 25 comparable units currently listed for rent nearby; rentals at typical pace (median 27d on market — plan ~3-4 weeks tenant-placement turnaround); 40% of comp listings sitting > 30 days — soft ceiling on asking rent; solid renter incomes; 12,577 units permitted in Dallas County in 2024 (6,829 in 5+ unit buildings).
Forward outlook
- Local home prices are declining (-3.0%/yr); year-one equity from $1k of loan paydown is wiped out by about $5k of value loss. Plan a longer hold.
- Dallas County population projected at +35% by 2050 — long-run rental-demand tailwind backs the buy-and-hold thesis.
Negotiation context
- Only 6 days on market — expect competitive offers; lowballing is unlikely to land.
Risks & watch-outs
- Watch-outs: property tax is 3.2% of price.
- Climate carrying-cost: major wind risk, 27% chance of damaging wind over 30y; extreme-heat days projected 7→23/yr by 2055 (HVAC capex compounding) — expect insurance premiums to compound above CPI over the hold.
Questions for the listing agent
- What do current leases actually rent for vs. the listed asking? Can we see a recent rent roll and the last 12 months of T-12 income?
- Built in 1962 — when were the roof, HVAC, electrical panel, plumbing, and water heater last replaced?
- Property tax is high relative to price — has the assessment been appealed recently, and will the sale trigger a re-assessment?
- Is there a deadline driving the sale (1031 exchange, divorce, estate, relocation)? That informs how much negotiation room exists.
- The area grade is low — what's the realistic commute time and amenity access for the typical tenant pool here? Any planned neighborhood developments (good or bad) we should know about?
- What's the average days-on-market for RENTAL listings here right now (not sales)? A rising rental-DOM trend means longer vacancies and softer asking-rent achievability than the comps imply.
- What's the recent tenant-quality profile in this submarket — average credit score on applications, eviction rate, late-payment / NSF rate, and stable-employment percentage? A property-management company in the area should have these aggregated.
- How much new for-sale + rental construction is in the pipeline within 1–3 miles? Heavy new supply typically softens prices + rents 12–24 months out; constrained supply supports both.
Investment metrics
- 1% rule
- 1.05% ✓
- Cap rate
- 6.27%
- Cash-on-cash
- -0.09%
- DSCR
- 1.00
- GRM
- 7.9
CMA / ARV
- ARV (on-the-fly)
- $322,028
- Comps found
- 12
Show comp detail 12 sales within ~0.75 mi
| Address | Dist | Beds/Ba | Sqft | Sold | Price | $/sf | Match |
|---|---|---|---|---|---|---|---|
| 1822 School Rd | 0.18mi | 3/2.0 (+1) | 1,382 (-7%) | 14mo | $300,000 | $217 | 64 |
| 1837 Chevy Chase Dr | 0.27mi | 3/1.5 (+1) | 1,612 (+9%) | 8mo | $280,000 | $174 | 59 |
| 1832 Moonbeam Ln | 0.30mi | 3/2.0 (+1) | 1,316 (-11%) | 8mo | $275,000 | $209 | 55 |
| 1813 Glengarry Dr | 0.69mi | 3/2.5 (+1) | 1,404 (-5%) | 1mo | $379,900 | $271 | 51 |
| 2517 Collingwood Dr | 0.39mi | 3/2.0 (+1) | 1,600 (+8%) | 16mo | $330,000 | $206 | 50 |
| 1807 Brake Dr | 0.43mi | 3/2.0 (+1) | 1,380 (-7%) | 19mo | $339,900 | $246 | 48 |
| 1712 Ross Ave | 0.57mi | 3/2.0 (+1) | 1,620 (+9%) | 10mo | $375,000 | $231 | 45 |
| 2717 Moonriver Ln | 0.73mi | 3/2.0 (+1) | 1,561 (+5%) | 9mo | $297,000 | $190 | 45 |
| 2536 Rugby Ln | 0.52mi | 3/1.0 (+1) | 1,303 (-12%) | 7mo | $230,000 | $177 | 41 |
| 1508 Ross Ave | 0.57mi | 3/2.0 (+1) | 1,685 (+14%) | 8mo | $365,000 | $217 | 39 |
| 1800 Highland Dr | 0.74mi | 3/2.0 (+1) | 1,672 (+13%) | 2mo | $275,000 | $164 | 38 |
| 2510 Wasina Dr | 0.68mi | 3/2.0 (+1) | 1,374 (-7%) | 17mo | $330,000 | $240 | 37 |
Match score weights: distance 35% · size 25% · config 20% · recency 20%. Top-matched comps best support the ARV.
Projected returns pro-forma
-3.0% appreciation · 0.0% rent growth · sell at horizon
- IRR
- -20.5%
- Equity multiple
- 0.31×
- Total profit
- $-34,755
- Equity at exit
- $26,824
- IRR
- -24.8%
- Equity multiple
- -0.02×
- Total profit
- $-51,232
- Equity at exit
- $15,554
Cash invested: $50,372 (down + closing). Projections, not guarantees.
Landlord ↔ Tenant lean methodology
- Overall (STATE)
- 87 Strongly Landlord-Friendly
- State Texas
- 87 Strongly Landlord-Friendly · R+5
- County
- — inherits STATE
- City
- — inherits STATE
ZIP-level market 75006
- Rents YoY
- -4.7%
- Active inventory
- 192
- Price-to-rent
- 7.9×
Monthly cashflow live
- Estimated rent
- $1,889 high interval (Pro) →
- Mortgage (P&I)
- −$943
- Tax from tax record
- −$478 /mo · $5,731/yr
- Insurance
- −$75
- HOA
- −$0
- Vacancy / Maint / Mgmt
- −$397
- Net cashflow
- $-4
Break-even live
Sensitivity live
| Price | -10% $98 | -5% $47 | +0% $-4 | +5% $-55 | +10% $-106 |
|---|---|---|---|---|---|
| Rent | -10% $-153 | -5% $-79 | +0% $-4 | +5% $71 | +10% $145 |
| Rate | -1.0pp $87 | -0.5pp $42 | base $-4 | +0.5pp $-51 | +1.0pp $-98 |
UW: 25.0% down · 7.5% · 30yr · 1.5% tax · 5.0% vac · 8.0% maint · 8.0% mgmt
Financing live
Cash to close
- Down payment
- $44,975
- Closing costs
- $5,397
- Reserves months
- —
- Total cash needed
- —
Loan-product check · same deal, 3 products live
Conventional
25% down · 7.5% · 30yr
- Down + closing
- —
- Monthly P&I
- —
- Monthly cashflow
- —
- DSCR
- —
- Eligible?
- —
Personal DTI + credit; lowest rate.
DSCR
20% down · 8.5% · 30yr
- Down + closing
- —
- Monthly P&I
- —
- Monthly cashflow
- —
- DSCR
- —
- Eligible?
- —
No personal income docs; deal must DSCR.
Hard money
10% down · 12.0% · 12mo
- Down + closing
- —
- Monthly P&I
- —
- Monthly cashflow
- —
- DSCR
- —
- Eligible?
- —
Short-term bridge; refi at stabilization.
Rent comps 25 comps
| Address | Beds | Baths | Sqft | Rent | $/sqft | DOM | Units | Dist |
|---|---|---|---|---|---|---|---|---|
| 2559 Valwood Pkwy Dallas, TX | 3.0 | 1.0 | 938 | $1,750 | $1.87 | 45d | 1 | 0.33mi |
| 1809 Cox St Carrollton, TX | 1.0–3.0 | 1.0–2.0 | 800 | $1,429 | $1.79 | 1d | 12 | 0.43mi |
| 1910 S Josey Ln Carrollton, TX | 1.0–2.0 | 1.0–2.0 | 856 | $1,498 | $1.75 | 0d | 13 | 0.46mi |
| 13929 Montvale Dr Dallas, TX | 3.0 | 1.0 | 941 | $2,200 | $2.34 | 45d | 1 | 0.57mi |
| 1520 Parkside Dr Carrollton, TX | 3.0 | 2.0 | 1348 | $2,350 | $1.74 | 45d | 1 | 0.57mi |
| 2617 Fieldale Dr Dallas, TX | 3.0 | 1.0 | 1000 | $2,025 | $2.02 | 45d | 1 | 0.63mi |
| 1415 S Broadway St Carrollton, TX | 2.0 | 1.0–2.0 | 789 | $2,355 | $2.98 | 1d | 27 | 0.72mi |
| 2726 Starcrest Ln Dallas, TX | 3.0 | 2.0 | 1313 | $2,350 | $1.79 | 9d | 1 | 0.75mi |
| 1111 S Main St Carrollton, TX | 1.0–2.0 | 1.0–2.0 | 885 | $2,235 | $2.53 | 0d | 22 | 0.79mi |
| 1011 S Main St Carrollton, TX | 2.0 | 1.0–2.0 | 808 | $2,387 | $2.95 | 0d | 35 | 0.85mi |
| 2106 Austin Dr Carrollton, TX | 3.0 | 2.0 | 1193 | $1,900 | $1.59 | 45d | 1 | 0.86mi |
| 13638 Pyramid Dr Dallas, TX | 3.0 | 2.0 | 1764 | $2,195 | $1.24 | 45d | 1 | 1.10mi |
| 1815 Spring Ave Carrollton, TX | 3.0 | 1.0 | 1125 | $1,800 | $1.60 | 45d | 1 | 1.16mi |
| 1919 Walnut Plz Carrollton, TX | 1.0–2.0 | 1.0–1.5 | 846 | $1,475 | $1.74 | 4d | 35 | 1.20mi |
| 2928 Mark Twain Dr Dallas, TX | 3.0 | 2.0 | 1355 | $2,315 | $1.71 | 0d | 1 | 1.20mi |
| 2213 Nolan Dr Carrollton, TX | 3.0 | 2.0 | 1433 | $2,060 | $1.44 | 26d | 1 | 1.20mi |
| 13230 Nestle Dr Dallas, TX | 3.0 | 1.0 | 1313 | $2,250 | $1.71 | 45d | 1 | 1.24mi |
| 2514 Valley View Ln Farmers Branch, TX | 2.0 | 2.0 | 1053 | $1,375 | $1.31 | 45d | 1 | 1.28mi |
| 1814 Gravley Dr Carrollton, TX | 3.0 | 2.0 | 1461 | $2,000 | $1.37 | 26d | 1 | 1.31mi |
| 1515 Metrocrest Dr Carrollton, TX | 1.0–2.0 | 1.0–2.0 | 798 | $1,459 | $1.83 | 3d | 1 | 1.33mi |
| 2500 Pepperwood St Dallas, TX | 1.0–2.0 | 1.0–2.0 | 934 | $1,987 | $2.13 | 0d | 41 | 1.39mi |
| 2309 Fyke Rd Carrollton, TX | 3.0 | 2.0 | 1217 | $2,450 | $2.01 | 45d | 1 | 1.40mi |
| 1705 Metrocrest Dr Carrollton, TX | 2.0 | 2.0 | 953 | $1,774 | $1.86 | 3d | 1 | 1.41mi |
| 3023 Topaz Ln Dallas, TX | 3.0 | 2.0 | 1304 | $2,199 | $1.69 | 9d | 1 | 1.41mi |
| 14025 Janwood Ln Dallas, TX | 3.0 | 2.0 | 1513 | $2,400 | $1.59 | 26d | 1 | 1.46mi |
Listing history 7 events
-
2026-06-17status $179,900 Pending 6 DOM
-
2026-06-16days on market $179,900 Active Contingent 6 DOM
-
2026-06-16status $179,900 Active Contingent 5 DOM
-
2026-06-15days on market $179,900 Active 5 DOM
-
2026-06-13days on market $179,900 Active 3 DOM
-
2026-06-13remarks 251-char remark
-
2026-06-13$179,900 Active 2 DOM
ⓘ Source: listings_history table (triggers on properties + properties_extension) + one-shot
backfill from property_details.listing_events for pre-trigger history.
Tax reassessment forecast TX · Resets to sale price
- Current annual tax
- $5,731 · $478/mo
- Projected year-2 tax
- $5,731 · $478/mo
- Expected delta
- $0/yr ($0/mo · -0.0%)
ⓘ Screening estimate from a state-policy table — verify with the county assessor before closing.
Climate risk First Street
- Flood 1/10 Low FEMA zone X (unshaded) · 0% chance over 30 yrs
- Wildfire 1/10 Low
- Heat 7/10 Severe 7 d/yr ≥109°F today · 23 d/yr by 30 yrs out
- Wind 6/10 Major 27% chance of damaging wind over 30 yrs
- Air quality 3/10 Moderate 3 unhealthy d/yr today · 4 by 30 yrs out
Nearby sold comps map
Loading sold comps map…
Walkable amenities ~0.75 mi
Loading nearby amenities…
Taxation est. · year 1
- Rental income
- $22,663
- − Mortgage interest
- −$10,077
- − Property taxes
- −$5,731
- − Insurance
- −$900
- − Repairs & maintenance
- −$1,813
- − Management
- −$1,813
- − Depreciation
- −$5,233
- Taxable loss
- −$2,904
- Est. tax savings @ 24.0%
- +$697
- After-tax cash flow
- $649/yr
For passive investors: Depreciation is non-cash, so a rental often shows a tax loss while cash-flowing — sheltering income. Rental losses are passive: they offset passive income freely, and up to $25,000/yr can offset ordinary (W-2) income if you actively participate and your MAGI is under $100k (phasing out to $0 by $150k); unused losses carry forward. On sale, claimed depreciation is recaptured at up to 25%, and gains may owe capital-gains tax (a 1031 exchange can defer both). Figures are a year-1 estimate at your 24.0% rate — not tax advice; consult a CPA.
Schools (NCES district)
- District
- Carrollton-Farmers Branch ISD
- NCES district ID
- 4813050
- Math proficiency
- 31% ▼ -18.00%
- Reading proficiency
- 36% ▼ -7.00%
- Median HH income
- $60,131
- Composite
- 30.06/100
- National rank
- #6350
- State rank
- #518 of 826 in TX
Livability — Carrollton
- Score
- 79/100
- State rank
- #54
- US rank
- #2159
Category grades
Schools grade is shown separately in the Schools card above.
Census & demographics
- Census place
- Carrollton, TX
- County
- Dallas County · 2,612,404 people
- City population
- 135,779
- Metro
- Dallas-Fort Worth-Arlington, TX
- Population (ZIP)
- 47,807
- Household income
- $84,815
- Rent vs Own
- Severe rent burden
- 1978.0
Population outlook (Dallas County) Hauer SSP2
- Today (2025)
- 2,979,839 people
- By 2030
- 3,191,823 · +7.1%
- By 2040
- 3,619,611 · +21.5%
- By 2050
- 4,026,915 · +35.1%
- By 2075
- 4,957,073 · +66.4%
- By 2100
- 5,508,725 · +84.9%
Race, ethnicity, and origin ACS 2023
- Neighborhood character
- Diverse neighborhood (Simpson 0.66)
- Race & ethnicity
- Hispanic / Latino 47% White 32% Two or more races 17% Black 9% Asian 8%
- Hispanic origin (detail)
- Mexican 34%
- Common ancestry
- Slovak 2% Lithuanian 2% Italian 1%
- Foreign-born
- 30% · Canada, Vietnam, South Korea
- Languages at home
- 51% English-only · Spanish 38% Vietnamese 3% Korean 2%
Political lean MEDSL · Dallas
- 2024 margin
- Strong D (+22.2) · D 60.2% · R 38.0% · Other 1.8%
- 2008→2024 swing
- +6.9pp toward D · 2008: 15.3pp · 2024: 22.2pp
- All cycles
- 2024: D+22.2 2020: D+31.6 2016: D+26.2 2012: D+15.4 2008: D+15.3
Not yet ingested
- Civics
- —
Market trends
- HPI YoY
- ▼ -177.99%
- Current HPI
- 287.9888
- Rent YoY
- ▼ -4.71%
- Metro
- Dallas-Fort Worth-Arlington, TX
- State GDP YoY
- ▲ 3.95%
- F500 in state
- 110
Industry mix (Fortune 500 HQ in TX)
| Industry | F500 HQs | Revenue |
|---|---|---|
| Energy | 16 | $1,198B |
|
||
| Technology | 5 | $198B |
|
||
| Engineering / Construction | 4 | $72B |
|
||
| Energy Services | 3 | $60B |
|
||
| Utilities | 3 | $41B |
|
||
| Healthcare | 2 | $330B |
|
||
Price history
2 events — show timeline
- 2026-06-10 Listed $179,900 NTREIS
- 2003-03-14 Sold (Public Records) — Public Records
Property tax history
+4.3%/yrLatest (2025): $5,731 · -1.7% YoY. Source: county tax records.
Cash-flow waterfall
monthlySold comps — $/sqft
last 12 mo · ≤1 miLoading sold comps…