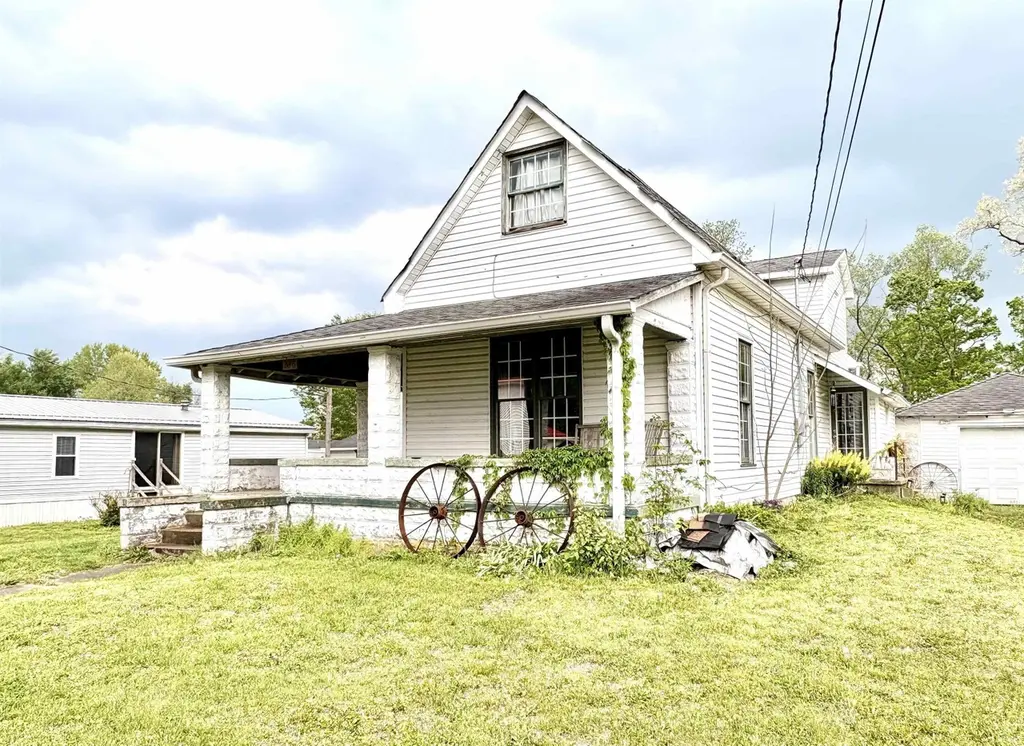
246 S 3rd St · Gosport, IN
Flood risk 1/10 · Minimal
- FEMA flood zone
- X (unshaded)
- Chance of flooding over 30 yrs
- 0.0%
- Est. flood insurance / yr
- $473 – $860
Fire risk 3/10 · Minor
- Est. fire insurance / yr
- $717 – $1,331
Heat risk 4/10 · Minor
- Hot days now (above 102°F)
- 7 days/yr
- Hot days in 30 yrs
- 18 days/yr
Wind risk 2/10 · Minimal
- Chance of severe wind over 30 yrs
- 1.0%
Air-quality risk 2/10 · Minimal
- Unhealthy air days now
- 1 days/yr
- Unhealthy air days in 30 yrs
- 2 days/yr
Risk factors via First Street. Map © Google.
Why this score? — see what drove the C grade
The composite is a weighted blend of 9 inputs, each scored 0–100. Each bar is that input's sub-score; the figure is the points it added to the 100-point composite (weight × sub-score).
- ARV discount +15.0/15.0
- Cash flow +14.9/30.0
- Appreciation +10.0/10.0
- DSCR +4.5/10.0
- Livability +3.6/5.0
- Schools +3.3/10.0
- 1% rule +3.2/10.0
- Rent growth +2.5/5.0
- Condition / age +2.5/5.0
$130,000
🖨 Deal sheet 📄 Offer letter ✓ Due diligence
Listing remarks MLS
Charming bungalow with lots of old-world features on a quiet tree-lined street. Expansive covered front porch. Two large bedrooms, main-level master. Original hardwoods throughout most of main floor. Two car detached garage and a beautiful yard with mature trees.
Key facts
- 0.6-acre lot
- Water heater
- Real wood floors
Tags
Property features AI
Exterior
- Parking: Detached garage with 1 garage space
- Utilities: Public water; Public sewer
- Home design: Single-family residence; Site-built home; Single-story
- Construction: Vinyl siding; Block foundation
- Exterior features: Lot dimensions approximately 70 x 310; Approximately 0.6 acre lot
Interior
- Bathrooms: 1 full bathroom (main level)
- Heating & cooling: Electric heating; Central air conditioning
- Interior features: Crawl space basement; Total of 4 rooms
- Laundry & utility: Laundry on the main level
Neighborhood map
What this means for you Summary
Snapshot
- This is a 2-bed/1.0-bath single-family listed at $130k.
Deal economics
- At list price, monthly cash flow is $37 ($447/yr) — positive.
- The deal already cash-flows at list — no discount required.
- To meet the 1% rule (rent ≥ 1% of price), the offer needs to be $107k (18.0% below list).
- Recommended offer: $107k (18.0% below list) — sets the bar for 1% rule.
Location & tenants
- Location reads 71/100 on livability (#133 in IN) — a middle-class / working-renter tenant base. Strengths: crime A+, cost of living A+, housing A+; Watch: employment D, amenities F, commute F.
- Spencer-Owen Community Schools (rural): math 38% / reading 40% proficiency, ranked #155 of 301 in IN (top 52%) — families likely to look elsewhere, expect single-tenant / working-renter base with shorter leases.
- Zoned schools: Gosport Elementary School (math 37% / reading 32%, grade F, #597 of 994 statewide, top 63%, 144 students, 76% FRL); Owen Valley Middle School (math 22% / reading 36%, grade F, #222 of 330 statewide, top 67%, 344 students, 55% FRL); Owen Valley Community High School (math 42% / reading 62%, grade D+, #106 of 369 statewide, top 31%, 671 students, 51% FRL) — zoned schools average 61% FRL vs 44% district-wide (17 pts higher); higher-poverty schools than district average — tighter screening recommended.
- Market conditions: 30 active listings in the ZIP; 120 units permitted in Owen County in 2024 (0 in 5+ unit buildings).
Forward outlook
- In year one you build about $14k of equity ($899 loan paydown + $13k appreciation (10.0% local appreciation)).
- Owen County population projected at -30% by 2050 — secular population decline; favor cash flow + early exit over multi-decade hold.
- At projected returns (10.0% appreciation + 3.0% rent growth), your $36k cash investment doubles in ~3 years — after that, you're playing with house money.
- By year 3, paydown + projected appreciation supports a ~$35k cash-out refi (75% LTV) — recoverable capital for the next deal without selling this one.
Negotiation context
- It's been on market 30 days — a 2% lower offer ($128k) is reasonable based on typical stale-listing flexibility.
- 8 sale attempts since 22y ago with the ask held roughly flat each time — persistent listings suggest the price (not the market) is what's stuck; bring a comps-based counter.
- Current owner paid $72k; list at $130k implies a 81% gain — meaningful room to come down on a strong offer.
Risks & watch-outs
- Watch-outs: built in 1900 — expect roof / HVAC / electrical / plumbing capex.
Questions for the listing agent
- Built in 1900 — when were the roof, HVAC, electrical panel, plumbing, and water heater last replaced?
- Is there a deadline driving the sale (1031 exchange, divorce, estate, relocation)? That informs how much negotiation room exists.
- Schools are D-rated, which usually means shorter tenancies and higher turnover. Who's the typical renter profile here, and what's been the actual vacancy rate?
- What's the average days-on-market for RENTAL listings here right now (not sales)? A rising rental-DOM trend means longer vacancies and softer asking-rent achievability than the comps imply.
- What's the recent tenant-quality profile in this submarket — average credit score on applications, eviction rate, late-payment / NSF rate, and stable-employment percentage? A property-management company in the area should have these aggregated.
- How much new for-sale + rental construction is in the pipeline within 1–3 miles? Heavy new supply typically softens prices + rents 12–24 months out; constrained supply supports both.
Investment metrics
- 1% rule
- 0.82% ✗
- Cap rate
- 6.64%
- Cash-on-cash
- 1.23%
- DSCR
- 1.05
- GRM
- 10.2
CMA / ARV
- ARV (median comp)
- $184,277
- List price
- $130,000
- Delta
- -29.45%
- Verdict
- UNDERPRICED
- Comps
- 18 within 1.0 mi
Show comp detail 1 sale within ~0.75 mi
| Address | Dist | Beds/Ba | Sqft | Sold | Price | $/sf | Match |
|---|---|---|---|---|---|---|---|
| 357 W North St | 0.44mi | 3/2.0 (+1) | 1,771 (+1%) | 10mo | $219,000 | $124 | 61 |
Match score weights: distance 35% · size 25% · config 20% · recency 20%. Top-matched comps best support the ARV.
Projected returns pro-forma
10.0% appreciation · 3.0% rent growth · sell at horizon
- IRR
- 25.1%
- Equity multiple
- 3.01×
- Total profit
- $73,132
- Equity at exit
- $117,114
- IRR
- 22.2%
- Equity multiple
- 6.86×
- Total profit
- $213,415
- Equity at exit
- $252,561
Cash invested: $36,400 (down + closing). Projections, not guarantees.
Landlord ↔ Tenant lean methodology
- Overall (STATE)
- 90 Strongly Landlord-Friendly
- State Indiana
- 90 Strongly Landlord-Friendly · R+11
- County
- — inherits STATE
- City
- — inherits STATE
ZIP-level market 47433
- Home prices YoY
- 9.4%
- Active inventory
- 30
- Price-to-rent
- 10.2×
Monthly cashflow live
- Estimated rent
- $1,066 medium interval (Pro) →
- Mortgage (P&I)
- −$682
- Tax from tax record
- −$69 /mo · $833/yr
- Insurance
- −$54
- HOA
- −$0
- Vacancy / Maint / Mgmt
- −$224
- Net cashflow
- $37
Break-even live
UW: 25.0% down · 7.5% · 30yr · 1.5% tax · 5.0% vac · 8.0% maint · 8.0% mgmt
Financing live
Cash to close
- Down payment
- $32,500
- Closing costs
- $3,900
- Reserves months
- —
- Total cash needed
- —
Loan-product check · same deal, 3 products live
Conventional
25% down · 7.5% · 30yr
- Down + closing
- —
- Monthly P&I
- —
- Monthly cashflow
- —
- DSCR
- —
- Eligible?
- —
Personal DTI + credit; lowest rate.
DSCR
20% down · 8.5% · 30yr
- Down + closing
- —
- Monthly P&I
- —
- Monthly cashflow
- —
- DSCR
- —
- Eligible?
- —
No personal income docs; deal must DSCR.
Hard money
10% down · 12.0% · 12mo
- Down + closing
- —
- Monthly P&I
- —
- Monthly cashflow
- —
- DSCR
- —
- Eligible?
- —
Short-term bridge; refi at stabilization.
Listing history 13 events
-
2026-04-28$130,000 Active 616-char remark
-
2020-10-09soldstatus $45,000
Show marketing remark (263 chars)
Charming bungalow with lots of old-world features on a quiet tree-lined street. Expansive covered front porch. Two large bedrooms, main-level master. Original hardwoods throughout most of main floor. Two car detached garage and a beautiful yard with mature trees.
-
2020-08-31$45,000
Show marketing remark (263 chars)
Charming bungalow with lots of old-world features on a quiet tree-lined street. Expansive covered front porch. Two large bedrooms, main-level master. Original hardwoods throughout most of main floor. Two car detached garage and a beautiful yard with mature trees.
-
2018-11-04$56,000
-
2018-07-13$69,900
-
2012-10-31historical
-
2012-04-09$84,900
-
2011-12-31historical
-
2011-06-28$87,500
-
2010-04-19historical
-
2009-04-07$89,900
-
2004-09-25historical
-
2004-03-25$94,500
ⓘ Source: listings_history table (triggers on properties + properties_extension) + one-shot
backfill from property_details.listing_events for pre-trigger history.
Tax reassessment forecast IN · Partial reset (capped growth)
- Current annual tax
- $833 · $69/mo
- Projected year-2 tax
- $969 · $81/mo
- Expected delta
- +$136/yr (+$11/mo · 16.3%)
ⓘ Screening estimate from a state-policy table — verify with the county assessor before closing.
Climate risk First Street
- Flood 1/10 Low FEMA zone X (unshaded) · 0% chance over 30 yrs
- Wildfire 3/10 Moderate
- Heat 4/10 Moderate 7 d/yr ≥102°F today · 18 d/yr by 30 yrs out
- Wind 2/10 Low 100% chance of damaging wind over 30 yrs
- Air quality 2/10 Low 1 unhealthy d/yr today · 2 by 30 yrs out
Nearby sold comps map
Loading sold comps map…
Walkable amenities ~0.75 mi
Loading nearby amenities…
Taxation est. · year 1
- Rental income
- $12,798
- − Mortgage interest
- −$7,282
- − Property taxes
- −$833
- − Insurance
- −$650
- − Repairs & maintenance
- −$1,024
- − Management
- −$1,024
- − Depreciation
- −$3,782
- Taxable loss
- −$1,796
- Est. tax savings @ 24.0%
- +$431
- After-tax cash flow
- $878/yr
For passive investors: Depreciation is non-cash, so a rental often shows a tax loss while cash-flowing — sheltering income. Rental losses are passive: they offset passive income freely, and up to $25,000/yr can offset ordinary (W-2) income if you actively participate and your MAGI is under $100k (phasing out to $0 by $150k); unused losses carry forward. On sale, claimed depreciation is recaptured at up to 25%, and gains may owe capital-gains tax (a 1031 exchange can defer both). Figures are a year-1 estimate at your 24.0% rate — not tax advice; consult a CPA.
Schools (NCES district)
- District
- Spencer-Owen Community Schools
- NCES district ID
- 1810950
- Math proficiency
- 38% ▼ -6.00%
- Reading proficiency
- 40% ▼ -6.00%
- Median HH income
- $45,258
- Composite
- 33.21/100
- National rank
- #5529
- State rank
- #155 of 301 in IN
Livability — Gosport
- Score
- 71/100
- State rank
- #133
- US rank
- #6926
Category grades
Schools grade is shown separately in the Schools card above.
Census & demographics
- Census place
- Gosport, IN
- Population (ZIP)
- 3,722
Population outlook (Owen County) Hauer SSP2
- Today (2025)
- 19,045 people
- By 2030
- 17,930 · -5.9%
- By 2040
- 15,507 · -18.6%
- By 2050
- 13,253 · -30.4%
- By 2075
- 9,364 · -50.8%
- By 2100
- 6,686 · -64.9%
Race, ethnicity, and origin ACS 2023
- Neighborhood character
- Predominantly White (98%)
- Race & ethnicity
- White 98% Two or more races 2%
- Common ancestry
- Italian 12% Iranian 2% Slovak 2%
- Foreign-born
- 0%
Political lean MEDSL · Owen
- 2024 margin
- Solid R (+50.7) · D 23.8% · R 74.5% · Other 1.6%
- 2008→2024 swing
- -40.3pp toward R · 2008: -10.3pp · 2024: -50.7pp
- All cycles
- 2024: R+50.7 2020: R+49.1 2016: R+49.4 2012: R+27.6 2008: R+10.3
Not yet ingested
- Civics
- —
Market trends
- HPI YoY
- ▲ 24.01%
- Current HPI
- 278.3717
- Rent YoY
- —
- Metro
- —
- State GDP YoY
- ▲ 2.90%
- F500 in state
- 18
Industry mix (Fortune 500 HQ in IN)
| Industry | F500 HQs | Revenue |
|---|---|---|
| Industrial Machinery | 2 | $37B |
|
||
| Healthcare | 1 | $177B |
|
||
| Pharmaceuticals | 1 | $45B |
|
||
| Metals / Steel | 1 | $18B |
|
||
| Agriculture | 1 | $17B |
|
||
| Packaging | 1 | $12B |
|
||
Price history
-23.8% since first listed15 events — show timeline
- 2026-06-17 Sold (MLS) $72,000 IRMLS
- 2026-05-28 Pending — IRMLS
- 2026-04-28 Listed $130,000 IRMLS
- 2020-10-09 Sold (MLS) $45,000 MIBOR as Distributed by MLS Grid
- 2020-08-31 Listed $45,000 MIBOR as Distributed by MLS Grid
- 2018-11-04 Listed $56,000 IRMLS
- 2018-07-13 Listed $69,900 IRMLS
- 2012-10-31 Listing Removed — MIBOR as Distributed by MLS Grid
- 2012-04-09 Listed $84,900 MIBOR as Distributed by MLS Grid
- 2011-12-31 Listing Removed — MIBOR as Distributed by MLS Grid
- 2011-06-28 Listed $87,500 MIBOR as Distributed by MLS Grid
- 2010-04-19 Listing Removed — MIBOR as Distributed by MLS Grid
- 2009-04-07 Listed $89,900 MIBOR as Distributed by MLS Grid
- 2004-09-25 Listing Removed — MIBOR as Distributed by MLS Grid
- 2004-03-25 Listed $94,500 MIBOR as Distributed by MLS Grid
Property tax history
-4.9%/yrLatest (2024): $833 · +20.7% YoY. Source: county tax records.
Cash-flow waterfall
monthlySold comps — $/sqft
last 12 mo · ≤1 miLoading sold comps…