 🏷️ Likely Rental
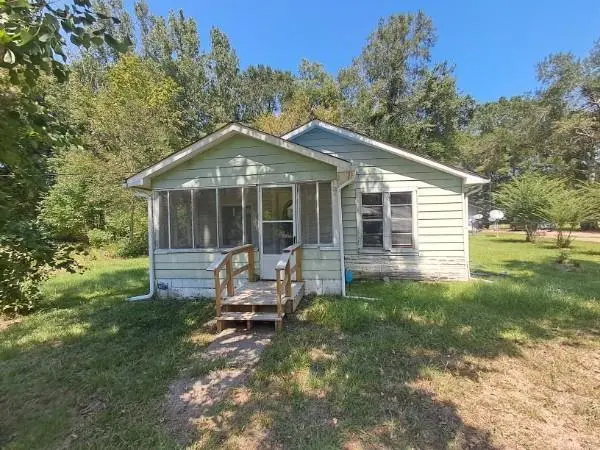
407 Williams Dr · Waynesboro, MS
Flood risk 1/10 · Minimal
- FEMA flood zone
- X (unshaded)
- Chance of flooding over 30 yrs
- 0.0%
- Est. flood insurance / yr
- $507 – $1,088
Fire risk 4/10 · Minor
- Est. fire insurance / yr
- $1,241 – $2,305
Heat risk 7/10 · Major
- Hot days now (above 108°F)
- 7 days/yr
- Hot days in 30 yrs
- 20 days/yr
Wind risk 8/10 · Major
- Chance of severe wind over 30 yrs
- 98.0%
Air-quality risk 1/10 · Minimal
- Unhealthy air days now
- 0 days/yr
- Unhealthy air days in 30 yrs
- 0 days/yr
Risk factors via First Street. Map © Google.
Why this score? — see what drove the D grade
The composite is a weighted blend of 9 inputs, each scored 0–100. Each bar is that input's sub-score; the figure is the points it added to the 100-point composite (weight × sub-score).
- Cash flow +15.0/30.0
- ARV discount +7.5/15.0
- 1% rule +5.0/10.0
- DSCR +5.0/10.0
- Livability +3.2/5.0
- Rent growth +2.5/5.0
- Condition / age +2.5/5.0
- Schools +2.2/10.0
- Appreciation +0.0/10.0
$7,900
🖨 Deal sheet (PDF) 📄 Offer letter ✓ Due diligence
Listing remarks MLS
The property is being sold As-Is, Where-Is. Seller may have limited knowledge of the property condition. Buyer to verify all information and conduct their own inspections and due diligence, including utilities, zoning, and property condition.
Key facts
- 0.3 acre lot
- Built 1976
- Listed 272 days
Neighborhood map
What this means for you Summary
Snapshot
- This is a 3-bed/1.0-bath single-family listed at $8k.
Deal economics
- At list price, monthly cash flow is $645 ($8k/yr) — positive.
- The deal already cash-flows at list — no discount required.
- Meets the 1% rule at list price ($914 rent vs $8k).
- Recommended offer: $7k (12.0% below list) — sets the bar for market timing.
Location & tenants
- Location reads 64/100 on livability (#140 in MS) — a middle-class / working-renter tenant base. Strengths: cost of living A+, health & safety A+, housing B; Watch: crime F, amenities F, commute F.
- Wayne County School District (town): math 24% / reading 29% proficiency, ranked #79 of 130 in MS (top 61%) — low school quality limits family demand, transient renter base, plan for 1-2y turnover; 76% free/reduced lunch — lower-income household profile, screen leases tightly.
- Zoned schools: Wayne Central Elementary School (math 18% / reading 25%, grade F, #239 of 375 statewide, top 64%, 443 students, 100% FRL); Waynesboro Riverview Ele School (math 15% / reading 24%, grade F, #246 of 375 statewide, top 67%, 442 students, 100% FRL); Wayne County High School (math 26% / reading 22%, grade F, #111 of 197 statewide, top 57%, 840 students, 100% FRL) — zoned schools average 100% FRL vs 76% district-wide (24 pts higher); higher-poverty schools than district average — tighter screening recommended.
- Market conditions: 45 active listings in the ZIP; 7 units permitted in Wayne County in 2024 (0 in 5+ unit buildings).
Forward outlook
- Local home prices are declining (-3.0%/yr); year-one equity from $55 of loan paydown is wiped out by about $237 of value loss. Plan a longer hold.
- Wayne County population projected at -18% by 2050 — secular population decline; favor cash flow + early exit over multi-decade hold.
- At projected returns (-3.0% appreciation + 3.0% rent growth), your $2k cash investment doubles in ~1 year — after that, you're playing with house money.
Negotiation context
- It's been on market 273 days — a 12% lower offer ($7k) is reasonable based on typical stale-listing flexibility.
- 2 sale attempts; this cycle's ask has dropped $22k (74%) from the opening price — seller is motivated, your offer sets the floor, not the list.
Risks & watch-outs
- Watch-outs: property tax is 5.0% of price.
- Climate carrying-cost: severe wind risk, 98% chance of damaging wind over 30y; extreme-heat days projected 7→20/yr by 2055 (HVAC capex compounding) — expect insurance premiums to compound above CPI over the hold.
Questions for the listing agent
- It's been on market 273 days. Have you received any prior offers? Is the seller open to a 12% concession, seller financing, or rate buy-down credit?
- Built in 1976 — when were the roof, HVAC, electrical panel, plumbing, and water heater last replaced?
- Property tax is high relative to price — has the assessment been appealed recently, and will the sale trigger a re-assessment?
- Why hasn't it sold? Are there any deal-killer items the seller is aware of (foundation, flood, title, zoning, code violations)?
- Is there a deadline driving the sale (1031 exchange, divorce, estate, relocation)? That informs how much negotiation room exists.
- Schools are F-rated, which usually means shorter tenancies and higher turnover. Who's the typical renter profile here, and what's been the actual vacancy rate?
- Crime grade is F in this area — have there been break-ins, vandalism, or insurance claims at this property in the last 3 years? What carrier currently insures it and at what premium?
- The area grade is low — what's the realistic commute time and amenity access for the typical tenant pool here? Any planned neighborhood developments (good or bad) we should know about?
- What's the average days-on-market for RENTAL listings here right now (not sales)? A rising rental-DOM trend means longer vacancies and softer asking-rent achievability than the comps imply.
- What's the recent tenant-quality profile in this submarket — average credit score on applications, eviction rate, late-payment / NSF rate, and stable-employment percentage? A property-management company in the area should have these aggregated.
- How much new for-sale + rental construction is in the pipeline within 1–3 miles? Heavy new supply typically softens prices + rents 12–24 months out; constrained supply supports both.
Investment metrics
- 1% rule
- 11.57% ✓
- Cap rate
- 104.21%
- Cash-on-cash
- 349.72%
- DSCR
- 16.56
- GRM
- 0.7
CMA / ARV
- ARV (median comp)
- $85,592
- List price
- $7,900
- Delta
- -90.77%
- Verdict
- UNDERPRICED
- Comps
- 2 within 2.0 mi
Projected returns pro-forma
-3.0% appreciation · 3.0% rent growth · sell at horizon
- IRR
- —
- Equity multiple
- 19.00×
- Total profit
- $39,806
- Equity at exit
- $1,178
- IRR
- —
- Equity multiple
- 40.62×
- Total profit
- $87,644
- Equity at exit
- $683
Cash invested: $2,212 (down + closing). Projections, not guarantees.
Landlord ↔ Tenant lean methodology
- Overall (STATE)
- 90 Strongly Landlord-Friendly
- State Mississippi
- 90 Strongly Landlord-Friendly · R+11
- County
- — inherits STATE
- City
- — inherits STATE
ZIP-level market 39367
- Home prices YoY
- -30.7%
- Active inventory
- 45
- Price-to-rent
- 0.7×
Monthly cashflow live
- Estimated rent
- $914 medium interval (Pro) →
- Mortgage (P&I)
- −$41
- Tax from tax record
- −$33 /mo · $393/yr
- Insurance
- −$3
- HOA
- −$0
- Lot rent
- −$0
- Vacancy / Maint / Mgmt
- −$192
- Net cashflow
- $645
Break-even live
Sensitivity live
| Price | -10% $673 | -5% $670 | +0% $645 | +5% $642 | +10% $640 |
|---|---|---|---|---|---|
| Rent | -10% $572 | -5% $609 | +0% $645 | +5% $681 | +10% $717 |
| Rate | -1.0pp $649 | -0.5pp $647 | base $645 | +0.5pp $643 | +1.0pp $641 |
UW: 25.0% down · 7.5% · 30yr · 1.5% tax · 5.0% vac · 8.0% maint · 8.0% mgmt
Financing live
Cash to close
- Down payment
- $1,975
- Closing costs
- $237
- Reserves months
- —
- Total cash needed
- —
Loan-product check · same deal, 3 products live
Conventional
25% down · 7.5% · 30yr
- Down + closing
- —
- Monthly P&I
- —
- Monthly cashflow
- —
- DSCR
- —
- Eligible?
- —
Personal DTI + credit; lowest rate.
DSCR
20% down · 8.5% · 30yr
- Down + closing
- —
- Monthly P&I
- —
- Monthly cashflow
- —
- DSCR
- —
- Eligible?
- —
No personal income docs; deal must DSCR.
Hard money
10% down · 12.0% · 12mo
- Down + closing
- —
- Monthly P&I
- —
- Monthly cashflow
- —
- DSCR
- —
- Eligible?
- —
Short-term bridge; refi at stabilization.
Listing history 25 events
-
2026-06-15days on market $7,900 Active 273 DOM
-
2026-06-13days on market $7,900 Active 271 DOM
-
2026-06-12pricedays on market $7,900 Active 270 DOM
-
2026-06-09days on market $8,900 Active 267 DOM
-
2026-06-08days on market $8,900 Active 266 DOM
-
2026-06-07days on market $8,900 Active 265 DOM
-
2026-06-07days on market $8,900 Active 264 DOM
-
2026-06-04days on market $8,900 Active 261 DOM
-
2026-06-02days on market $8,900 Active 260 DOM
-
2026-06-01days on market $8,900 Active 259 DOM
-
2026-05-31days on market $8,900 Active 258 DOM
-
2026-04-27price $8,900 242-char remark
Show marketing remark (242 chars)
The property is being sold As-Is, Where-Is. Seller may have limited knowledge of the property condition. Buyer to verify all information and conduct their own inspections and due diligence, including utilities, zoning, and property condition.
-
2026-03-13price $9,900 242-char remark
Show marketing remark (242 chars)
The property is being sold As-Is, Where-Is. Seller may have limited knowledge of the property condition. Buyer to verify all information and conduct their own inspections and due diligence, including utilities, zoning, and property condition.
-
2026-02-02price $12,900 242-char remark
Show marketing remark (242 chars)
The property is being sold As-Is, Where-Is. Seller may have limited knowledge of the property condition. Buyer to verify all information and conduct their own inspections and due diligence, including utilities, zoning, and property condition.
-
2025-12-17price $15,900 242-char remark
Show marketing remark (242 chars)
The property is being sold As-Is, Where-Is. Seller may have limited knowledge of the property condition. Buyer to verify all information and conduct their own inspections and due diligence, including utilities, zoning, and property condition.
-
2025-11-08price $19,900 242-char remark
Show marketing remark (242 chars)
The property is being sold As-Is, Where-Is. Seller may have limited knowledge of the property condition. Buyer to verify all information and conduct their own inspections and due diligence, including utilities, zoning, and property condition.
-
2025-10-10price $24,900 242-char remark
Show marketing remark (242 chars)
The property is being sold As-Is, Where-Is. Seller may have limited knowledge of the property condition. Buyer to verify all information and conduct their own inspections and due diligence, including utilities, zoning, and property condition.
-
2025-09-16$29,900 Active 242-char remark
Show marketing remark (242 chars)
The property is being sold As-Is, Where-Is. Seller may have limited knowledge of the property condition. Buyer to verify all information and conduct their own inspections and due diligence, including utilities, zoning, and property condition.
-
2025-08-20historical
-
2025-08-14price $34,300
-
2025-07-14price $36,100
-
2025-06-13price $37,900
-
2025-05-14price $39,800
-
2025-04-11$41,870 Active
-
1994-11-29soldstatus
ⓘ Source: listings_history table (triggers on properties + properties_extension) + one-shot
backfill from property_details.listing_events for pre-trigger history.
Tax reassessment forecast MS · Resets to sale price
- Current annual tax
- $393 · $33/mo
- Projected year-2 tax
- $393 · $33/mo
- Expected delta
- $0/yr ($0/mo · 0.0%)
ⓘ Screening estimate from a state-policy table — verify with the county assessor before closing.
Climate risk First Street
- Flood 1/10 Low FEMA zone X (unshaded) · 0% chance over 30 yrs
- Wildfire 4/10 Moderate
- Heat 7/10 Severe 7 d/yr ≥108°F today · 20 d/yr by 30 yrs out
- Wind 8/10 Severe 98% chance of damaging wind over 30 yrs
- Air quality 1/10 Low 0 unhealthy d/yr today · 0 by 30 yrs out
Nearby sold comps map
Loading sold comps map…
Walkable amenities ~0.75 mi
Loading nearby amenities…
Taxation est. · year 1
- Rental income
- $10,969
- − Mortgage interest
- −$443
- − Property taxes
- −$393
- − Insurance
- −$40
- − Repairs & maintenance
- −$878
- − Management
- −$878
- − Depreciation
- −$230
- Taxable income
- $8,109
- Est. tax owed @ 24.0%
- −$1,946
- After-tax cash flow
- $5,790/yr
For passive investors: Depreciation is non-cash, so a rental often shows a tax loss while cash-flowing — sheltering income. Rental losses are passive: they offset passive income freely, and up to $25,000/yr can offset ordinary (W-2) income if you actively participate and your MAGI is under $100k (phasing out to $0 by $150k); unused losses carry forward. On sale, claimed depreciation is recaptured at up to 25%, and gains may owe capital-gains tax (a 1031 exchange can defer both). Figures are a year-1 estimate at your 24.0% rate — not tax advice; consult a CPA.
Schools (NCES district)
- District
- Wayne County School District
- NCES district ID
- 2804530
- Math proficiency
- 24% ▼ -8.00%
- Reading proficiency
- 29% ▼ -1.00%
- Median HH income
- $32,885
- Composite
- 21.65/100
- National rank
- #8283
- State rank
- #79 of 130 in MS
Livability — Waynesboro
- Score
- 64/100
- State rank
- #140
- US rank
- #14735
Category grades
Schools grade is shown separately in the Schools card above.
Census & demographics
- Census place
- Waynesboro, MS
- Population (ZIP)
- 13,401
Population outlook (Wayne County) Hauer SSP2
- Today (2025)
- 19,737 people
- By 2030
- 19,116 · -3.1%
- By 2040
- 17,754 · -10.0%
- By 2050
- 16,267 · -17.6%
- By 2075
- 12,858 · -34.9%
- By 2100
- 10,121 · -48.7%
Race, ethnicity, and origin ACS 2023
- Neighborhood character
- Diverse neighborhood (Simpson 0.57)
- Race & ethnicity
- White 52% Black 40% Hispanic / Latino 6% Two or more races 5%
- Hispanic origin (detail)
- Mexican 2%
- Common ancestry
- Slovak 2% Scotch-Irish 1% Serbian 1%
- Foreign-born
- 5% · Canada
- Languages at home
- 92% English-only · Spanish 8%
Political lean MEDSL · Wayne
- 2024 margin
- Solid R (+32.7) · D 33.2% · R 65.9%
- 2008→2024 swing
- -11.0pp toward R · 2008: -21.8pp · 2024: -32.7pp
- All cycles
- 2024: R+32.7 2020: R+26.6 2016: R+25.8 2012: R+19.1 2008: R+21.8
Not yet ingested
- Civics
- —
Market trends
- HPI YoY
- ▼ -61.56%
- Current HPI
- 139.1889
- Rent YoY
- —
- Metro
- —
- State GDP YoY
- —
- F500 in state
- 0
Price history
-78.7% since first listed14 events — show timeline
- 2026-04-27 Price Changed $8,900 LBOR
- 2026-03-13 Price Changed $9,900 LBOR
- 2026-02-02 Price Changed $12,900 LBOR
- 2025-12-17 Price Changed $15,900 LBOR
- 2025-11-08 Price Changed $19,900 LBOR
- 2025-10-10 Price Changed $24,900 LBOR
- 2025-09-16 Listed $29,900 LBOR
- 2025-08-20 Listing Removed — MLSU
- 2025-08-14 Price Changed $34,300 MLSU
- 2025-07-14 Price Changed $36,100 MLSU
- 2025-06-13 Price Changed $37,900 MLSU
- 2025-05-14 Price Changed $39,800 MLSU
- 2025-04-11 Listed $41,870 MLSU
- 1994-11-29 Sold (Public Records) — Public Records
Property tax history
+8.6%/yrLatest (2025): $393 · -25.5% YoY. Source: county tax records.
Cash-flow waterfall
monthlySold comps — $/sqft
last 12 mo · ≤1 miLoading sold comps…