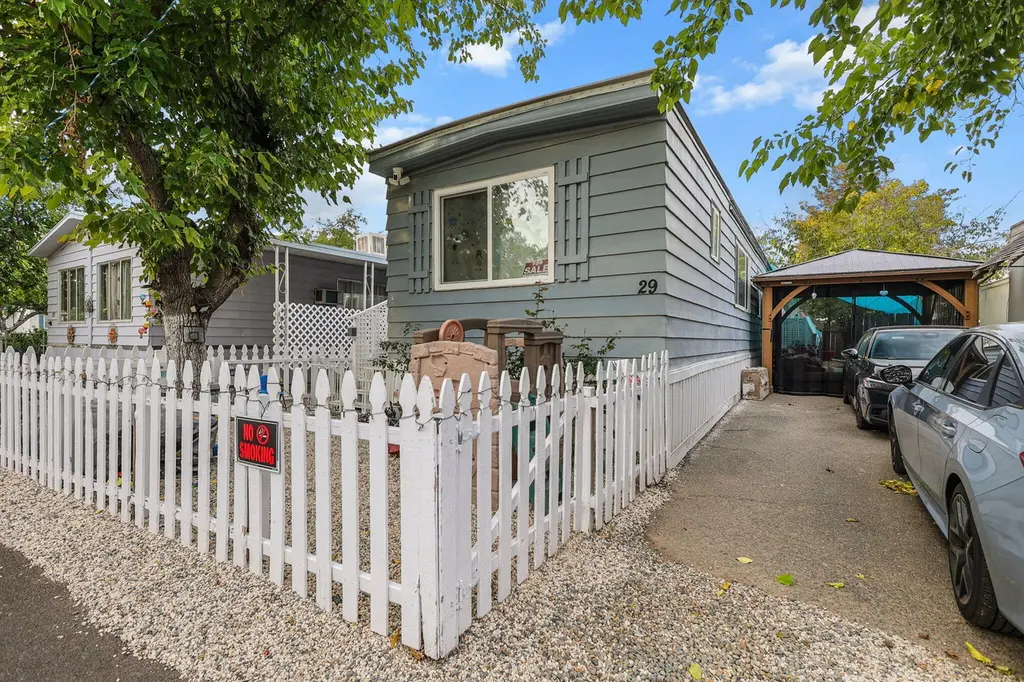
3850 Main St #29 · Cottonwood, CA
Flood risk 1/10 · Minimal
- FEMA flood zone
- X (unshaded)
- Chance of flooding over 30 yrs
- 0.0%
- Est. flood insurance / yr
- $507 – $1,088
Fire risk 9/10 · Severe
- Est. fire insurance / yr
- $659 – $1,223
Heat risk 8/10 · Major
- Hot days now (above 104°F)
- 7 days/yr
- Hot days in 30 yrs
- 16 days/yr
Wind risk 1/10 · Minimal
- Chance of severe wind over 30 yrs
- —
Air-quality risk 10/10 · Severe
- Unhealthy air days now
- 33 days/yr
- Unhealthy air days in 30 yrs
- 40 days/yr
Risk factors via First Street. Map © Google.
Why this score? — see what drove the B- grade
The composite is a weighted blend of 9 inputs, each scored 0–100. Each bar is that input's sub-score; the figure is the points it added to the 100-point composite (weight × sub-score).
- Cash flow +30.0/30.0
- 1% rule +10.0/10.0
- DSCR +10.0/10.0
- ARV discount +7.5/15.0
- Schools +3.8/10.0
- Livability +3.1/5.0
- Rent growth +2.5/5.0
- Condition / age +2.2/5.0
- Appreciation +0.0/10.0
$35,500
🖨 Deal sheet 📄 Offer letter ✓ Due diligence
Listing remarks
* Open house this Saturday 6-6-26 from 11:00am-1:00pm. * Welcome to this cute 2-bedroom, 1.5 bathroom, 600 sq ft home in the Cottonwood Oaks Mobile Home Park. Enjoy a surprisingly private setting with a fenced front and backyard, shade trees, and room for pets, kids, or container gardening. Space rent is $700/month and covers water, sewer, and trash. Minutes to I-5, shopping, and everyday essentials. Clean, cozy, and move-in ready!
Key facts
- Container gardening
- Shade trees
- Room for pets
Tags
Property features AI
Exterior
- Parking: Off-street parking
- Home design: Manufactured in park (mobile home)
- Construction: Metal siding
- Exterior features: Partial fencing; Level topography; Asphalt road access
Interior
- Flooring: Carpet; Laminate
- Heating & cooling: Evaporative cooling; Has heating
- Interior features: Carpet and laminate flooring; No fireplace
Neighborhood map
What this means for you Summary
Snapshot
- This is a 2-bed/2.0-bath manufactured listed at $36k. Condition is rated fair.
Deal economics
- At list price, monthly cash flow is $912 ($11k/yr) — positive.
- The deal already cash-flows at list — no discount required.
- Meets the 1% rule at list price ($1k rent vs $36k).
- Recommended offer: $33k (6.0% below list) — sets the bar for market timing.
- Cap rate 37.1% vs local median 3.0% in Cottonwood — top-decile yield for the area; either an underpriced asset or a hidden risk that comps aren't pricing in. Stress-test before assuming the spread holds.
Location & tenants
- Location reads 62/100 on livability (#476 in CA) — a middle-class / working-renter tenant base. Strengths: housing A+, employment B+; Watch: schools D+, crime D, amenities F.
- Cottonwood Union Elementary (town): math 42% / reading 47% proficiency, ranked #191 of 517 in CA (top 37%) — families likely to look elsewhere, expect single-tenant / working-renter base with shorter leases.
- Market conditions: 272 active listings in the ZIP; 246 units permitted in Shasta County in 2024 (0 in 5+ unit buildings).
Forward outlook
- Local home prices are declining (-3.0%/yr); year-one equity from $245 of loan paydown is wiped out by about $1k of value loss. Plan a longer hold.
- Shasta County population projected to shrink 9% by 2050 — rents likely to lag national; underwrite the cash flow, not the appreciation.
- At projected returns (-3.0% appreciation + 3.0% rent growth), your $10k cash investment doubles in ~1 year — after that, you're playing with house money.
Negotiation context
- It's been on market 74 days — a 6% lower offer ($33k) is reasonable based on typical stale-listing flexibility.
- 3 sale attempts with the ask held roughly flat each time — persistent listings suggest the price (not the market) is what's stuck; bring a comps-based counter.
Risks & watch-outs
- Climate carrying-cost: severe wildfire risk; extreme-heat days projected 7→16/yr by 2055 (HVAC capex compounding) — expect insurance premiums to compound above CPI over the hold.
Questions for the listing agent
- It's been on market 74 days. Have you received any prior offers? Is the seller open to a 6% concession, seller financing, or rate buy-down credit?
- Have any recent inspections been done? Can we get a copy of the seller's disclosures and any deferred-maintenance estimates?
- Built in 1975 — when were the roof, HVAC, electrical panel, plumbing, and water heater last replaced?
- Why hasn't it sold? Are there any deal-killer items the seller is aware of (foundation, flood, title, zoning, code violations)?
- Is there a deadline driving the sale (1031 exchange, divorce, estate, relocation)? That informs how much negotiation room exists.
- Schools are D-rated, which usually means shorter tenancies and higher turnover. Who's the typical renter profile here, and what's been the actual vacancy rate?
- Crime grade is D in this area — have there been break-ins, vandalism, or insurance claims at this property in the last 3 years? What carrier currently insures it and at what premium?
- What's the average days-on-market for RENTAL listings here right now (not sales)? A rising rental-DOM trend means longer vacancies and softer asking-rent achievability than the comps imply.
- What's the recent tenant-quality profile in this submarket — average credit score on applications, eviction rate, late-payment / NSF rate, and stable-employment percentage? A property-management company in the area should have these aggregated.
- How much new for-sale + rental construction is in the pipeline within 1–3 miles? Heavy new supply typically softens prices + rents 12–24 months out; constrained supply supports both.
Investment metrics
- 1% rule
- 4.13% ✓
- Cap rate
- 37.13%
- Cash-on-cash
- 110.13%
- DSCR
- 5.90
- GRM
- 2.0
CMA / ARV
- ARV (on-the-fly)
- $5,400
- Comps found
- 2
Show comp detail 2 sales within ~0.75 mi
| Address | Dist | Beds/Ba | Sqft | Sold | Price | $/sf | Match |
|---|---|---|---|---|---|---|---|
| 3850 Main St #22 | 0.01mi | 1/1.0 (-1) | 624 (+4%) | 7mo | $5,000 | $8 | 78 |
| 3850 Main St #17 | 0.01mi | 2/1.0 | 540 (-10%) | 8mo | $5,000 | $9 | 72 |
Match score weights: distance 35% · size 25% · config 20% · recency 20%. Top-matched comps best support the ARV.
Projected returns pro-forma
-3.0% appreciation · 3.0% rent growth · sell at horizon
- IRR
- —
- Equity multiple
- 6.27×
- Total profit
- $52,370
- Equity at exit
- $5,293
- IRR
- —
- Equity multiple
- 13.12×
- Total profit
- $120,505
- Equity at exit
- $3,069
Cash invested: $9,940 (down + closing). Projections, not guarantees.
Landlord ↔ Tenant lean methodology
- Overall (STATE)
- 18 Strongly Tenant-Friendly
- State California
- 18 Strongly Tenant-Friendly · D+13
- County
- — inherits STATE
- City
- — inherits STATE
ZIP-level market 96022
- Home prices YoY
- -12.9%
- Active inventory
- 272
- Price-to-rent
- 2.0×
Monthly cashflow live
- Estimated rent
- $1,465 medium interval (Pro) →
- Mortgage (P&I)
- −$186
- Tax est. 1.5%
- −$44 /mo · $532/yr
- Insurance
- −$15
- HOA
- −$0
- Vacancy / Maint / Mgmt
- −$308
- Net cashflow
- $912
Break-even live
UW: 25.0% down · 7.5% · 30yr · 1.5% tax · 5.0% vac · 8.0% maint · 8.0% mgmt
Financing live
Cash to close
- Down payment
- $8,875
- Closing costs
- $1,065
- Reserves months
- —
- Total cash needed
- —
Loan-product check · same deal, 3 products live
Conventional
25% down · 7.5% · 30yr
- Down + closing
- —
- Monthly P&I
- —
- Monthly cashflow
- —
- DSCR
- —
- Eligible?
- —
Personal DTI + credit; lowest rate.
DSCR
20% down · 8.5% · 30yr
- Down + closing
- —
- Monthly P&I
- —
- Monthly cashflow
- —
- DSCR
- —
- Eligible?
- —
No personal income docs; deal must DSCR.
Hard money
10% down · 12.0% · 12mo
- Down + closing
- —
- Monthly P&I
- —
- Monthly cashflow
- —
- DSCR
- —
- Eligible?
- —
Short-term bridge; refi at stabilization.
Listing history 23 events
-
2026-06-19days on market $35,500 Active 74 DOM
-
2026-06-18days on market $35,500 Active 73 DOM
-
2026-06-17days on market $35,500 Active 72 DOM
-
2026-06-16days on market $35,500 Active 71 DOM
-
2026-06-15days on market $35,500 Active 70 DOM
-
2026-06-14days on market $35,500 Active 68 DOM
-
2026-06-12days on market $35,500 Active 67 DOM
-
2026-06-10days on market $35,500 Active 65 DOM
-
2026-06-09days on market $35,500 Active 64 DOM
-
2026-06-08days on market $35,500 Active 63 DOM
-
2026-06-07days on market $35,500 Active 62 DOM
-
2026-06-03days on market $35,500 Active 58 DOM
-
2026-06-02days on market $35,500 Active 57 DOM
-
2026-06-01remarks 436-char remark
-
2026-06-01days on market $35,500 Active 56 DOM
-
2026-05-31days on market $35,500 Active 55 DOM
-
2026-05-30days on market $35,500 Active 54 DOM
-
2026-04-06$35,500 Active
-
2026-03-04price $35,500
-
2026-01-09status Active
-
2026-01-02status Pending
-
2025-12-02price $33,775
-
2025-11-05$35,500 Active
ⓘ Source: listings_history table (triggers on properties + properties_extension) + one-shot
backfill from property_details.listing_events for pre-trigger history.
Climate risk First Street
- Flood 1/10 Low FEMA zone X (unshaded) · 0% chance over 30 yrs
- Wildfire 9/10 Extreme
- Heat 8/10 Severe 7 d/yr ≥104°F today · 16 d/yr by 30 yrs out
- Wind 1/10 Low
- Air quality 10/10 Extreme 33 unhealthy d/yr today · 40 by 30 yrs out
Nearby sold comps map
Loading sold comps map…
Walkable amenities ~0.75 mi
Loading nearby amenities…
Taxation est. · year 1
- Rental income
- $17,583
- − Mortgage interest
- −$1,989
- − Property taxes
- −$532
- − Insurance
- −$178
- − Repairs & maintenance
- −$1,407
- − Management
- −$1,407
- − Depreciation
- −$1,033
- Taxable income
- $11,039
- Est. tax owed @ 24.0%
- −$2,649
- After-tax cash flow
- $8,297/yr
For passive investors: Depreciation is non-cash, so a rental often shows a tax loss while cash-flowing — sheltering income. Rental losses are passive: they offset passive income freely, and up to $25,000/yr can offset ordinary (W-2) income if you actively participate and your MAGI is under $100k (phasing out to $0 by $150k); unused losses carry forward. On sale, claimed depreciation is recaptured at up to 25%, and gains may owe capital-gains tax (a 1031 exchange can defer both). Figures are a year-1 estimate at your 24.0% rate — not tax advice; consult a CPA.
Condition & rehab AI · 13 photos
This home is in fair condition with cosmetic updates needed. It has a fenced yard and is move-in ready.
Repairs flagged
- Minor Paint — Paint appears chipped and faded in some areas
- Minor Landscaping — Some areas of the yard appear overgrown
Value-add opportunities
- Both Paint the exterior and interior walls — Fresh paint can improve the curb appeal and interior aesthetics
- Both Landscaping and yard maintenance — A well-maintained yard can enhance the home's curb appeal and attract potential buyers
Renovation cost estimate screening
| Repair item | Severity | Est. cost |
|---|---|---|
| Paint · Paint appears chipped and faded in some areas | Minor | $500–3,000 |
| Landscaping · Some areas of the yard appear overgrown | Minor | $500–3,000 |
| Total estimated repair cost · 2 items | $1,000–6,000 |
Value-add ROI direction
- Both Paint the exterior and interior walls — Fresh paint can improve the curb appeal and interior aesthetics ↑
- Both Landscaping and yard maintenance — A well-maintained yard can enhance the home's curb appeal and attract potential buyers ↑
ⓘ Cost ranges are severity-bucket heuristics (US national rule-of-thumb). Get contractor quotes + a written scope before underwriting a rehab budget.
Schools (NCES district)
- District
- Cottonwood Union Elementary
- NCES district ID
- 0609990
- Math proficiency
- 42% ▲ 1.00%
- Reading proficiency
- 47% ▲ 2.00%
- Median HH income
- $50,081
- Composite
- 38.22/100
- National rank
- #4249
- State rank
- #191 of 517 in CA
Livability — Cottonwood
- Score
- 62/100
- State rank
- #476
- US rank
- #16162
Category grades
Schools grade is shown separately in the Schools card above.
Census & demographics
- Census place
- Cottonwood, CA
- Population (ZIP)
- 16,497
Population outlook (Shasta County) Hauer SSP2
- Today (2025)
- 179,231 people
- By 2030
- 176,953 · -1.3%
- By 2040
- 169,982 · -5.2%
- By 2050
- 162,547 · -9.3%
- By 2075
- 145,649 · -18.7%
- By 2100
- 123,025 · -31.4%
Race, ethnicity, and origin ACS 2023
- Neighborhood character
- Predominantly White (77%)
- Race & ethnicity
- White 77% Hispanic / Latino 11% Two or more races 11% Asian 3% Native American 1%
- Hispanic origin (detail)
- Mexican 8%
- Common ancestry
- Lithuanian 5% Slovak 4% Portuguese 3%
- Foreign-born
- 4% · Canada, China
- Languages at home
- 92% English-only · Spanish 3% Other Indo-European 2% Other Asian/Pacific 1%
Political lean MEDSL · Shasta
- 2024 margin
- Solid R (+36.5) · D 30.5% · R 67.0% · Other 2.5%
- 2008→2024 swing
- -10.7pp toward R · 2008: -25.8pp · 2024: -36.5pp
- All cycles
- 2024: R+36.5 2020: R+33.1 2016: R+37.4 2012: R+30.3 2008: R+25.8
Not yet ingested
- Civics
- —
Market trends
- HPI YoY
- ▼ -54.22%
- Current HPI
- 364.3174
- Rent YoY
- —
- Metro
- —
- State GDP YoY
- ▲ 3.21%
- F500 in state
- 116
Industry mix (Fortune 500 HQ in CA)
| Industry | F500 HQs | Revenue |
|---|---|---|
| Technology | 27 | $1,492B |
|
||
| Financial Services | 3 | $174B |
|
||
| Retail | 3 | $44B |
|
||
| Insurance | 3 | $26B |
|
||
| Media / Entertainment | 2 | $115B |
|
||
| Pharmaceuticals / Biotech | 2 | $62B |
|
||
Price history
+0.0% since first listed6 events — show timeline
- 2026-04-06 Listed $35,500 SAOR
- 2026-03-04 Price Changed $35,500 SAOR
- 2026-01-09 Relisted — SAOR
- 2026-01-02 Pending — SAOR
- 2025-12-02 Price Changed $33,775 SAOR
- 2025-11-05 Listed $35,500 SAOR
Cash-flow waterfall
monthlySold comps — $/sqft
last 12 mo · ≤1 miLoading sold comps…