181 Long Hill Rd · Great Notch, NJ
Flood risk 1/10 · Minimal
- FEMA flood zone
- X (unshaded)
- Chance of flooding over 30 yrs
- 0.0%
- Est. flood insurance / yr
- $507 – $1,088
Fire risk 1/10 · Minimal
- Est. fire insurance / yr
- $526 – $976
Heat risk 6/10 · Moderate
- Hot days now (above 100°F)
- 7 days/yr
- Hot days in 30 yrs
- 14 days/yr
Wind risk 6/10 · Moderate
- Chance of severe wind over 30 yrs
- 27.0%
Air-quality risk 4/10 · Minor
- Unhealthy air days now
- 3 days/yr
- Unhealthy air days in 30 yrs
- 5 days/yr
Risk factors via First Street. Map © Google.
Why this score? — see what drove the F grade
The composite is a weighted blend of 9 inputs, each scored 0–100. Each bar is that input's sub-score; the figure is the points it added to the 100-point composite (weight × sub-score).
- ARV discount +7.5/15.0
- Schools +3.2/10.0
- 1% rule +2.6/10.0
- Rent growth +2.5/5.0
- Livability +2.5/5.0
- Condition / age +2.5/5.0
- Cash flow +2.1/30.0
- DSCR +0.0/10.0
- Appreciation +0.0/10.0
$325,000
🖨 Deal sheet 📄 Offer letter ✓ Due diligence
Key facts
- $878 HOA
- Community pool
- Listed 14 days
Property features AI
Finance
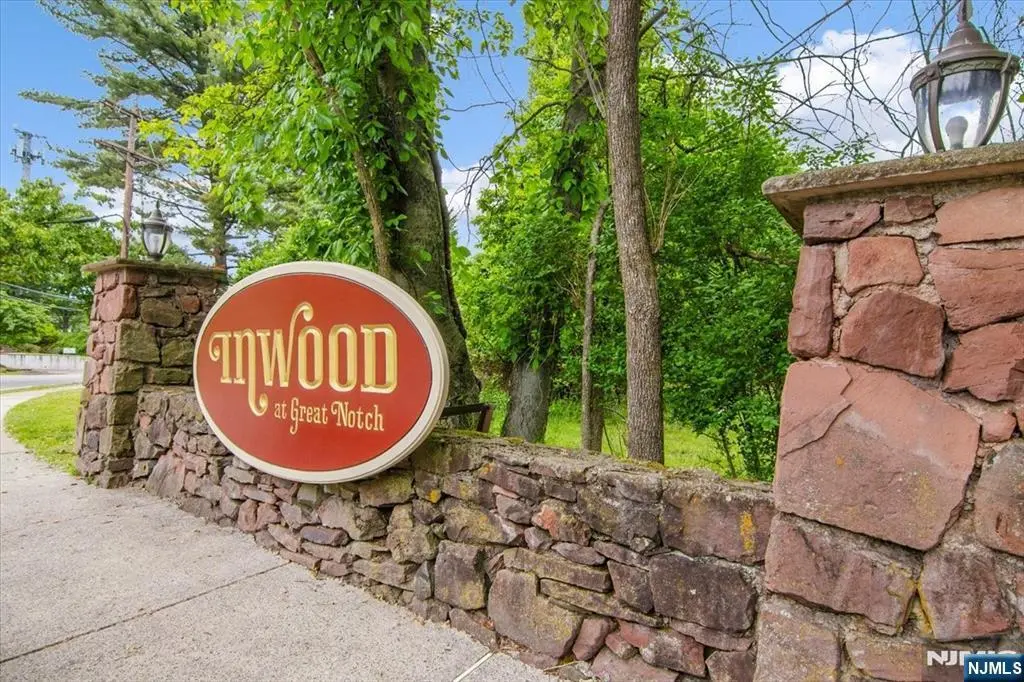
- HOA & community: Monthly association fee of $878; Community amenities include tennis courts and a pool; Building name: Inwood
Exterior
- Home design: Residential stock cooperative (co-op)
- Exterior features: Pets allowed
Interior
- Kitchen: Equipped with dishwasher, microwave, range/oven, and refrigerator
- Bedrooms: No basement
- Flooring: Hardwood
- Bathrooms: 1 full bathroom; 1 half bathroom
- Heating & cooling: Central air conditioning
- Interior features: Dishwasher; Microwave; Range / Oven; Refrigerator; Hardwood floors
Neighborhood map
What this means for you Summary
Snapshot
- This is a 1-bed/1.5-bath townhouse listed at $325k.
Deal economics
- At list price, monthly cash flow is $-1k ($-14k/yr) — negative.
- To cash-flow at today's rent, offer at most $155k (52.4% below list).
- To meet the 1% rule (rent ≥ 1% of price), the offer needs to be $246k (24.2% below list).
- Recommended offer: $155k (52.4% below list) — sets the bar for cash-flow.
Location & tenants
- Location reads: area grade F — affects rentability + tenant quality, not the cash-flow math above.
- Passaic Valley Regional High School District #1 (suburban): math 23% / reading 45% proficiency, ranked #271 of 472 in NJ (top 57%) — families likely to look elsewhere, expect single-tenant / working-renter base with shorter leases.
- Market conditions: 42 active listings in the ZIP; 19 comparable units currently listed for rent nearby; rentals leasing fast (median 1d on market — plan ~1-2 weeks tenant-placement turnaround); solid renter incomes; 860 units permitted in Passaic County in 2024 (614 in 5+ unit buildings).
Forward outlook
- Local home prices are declining (-3.0%/yr); year-one equity from $2k of loan paydown is wiped out by about $10k of value loss. Plan a longer hold.
- Passaic County population projected at +5% by 2050 — modest demand growth; plan on rents tracking national, not racing it.
Negotiation context
- Only 14 days on market — expect competitive offers; lowballing is unlikely to land.
- 11 sale attempts since 11y ago with the ask held roughly flat each time — persistent listings suggest the price (not the market) is what's stuck; bring a comps-based counter.
Risks & watch-outs
- Watch-outs: HOA is 36% of rent.
- Climate carrying-cost: major wind risk, 27% chance of damaging wind over 30y; extreme-heat days projected 7→14/yr by 2055 (HVAC capex compounding) — expect insurance premiums to compound above CPI over the hold.
Questions for the listing agent
- What do current leases actually rent for vs. the listed asking? Can we see a recent rent roll and the last 12 months of T-12 income?
- What does the HOA fee cover, when was the last increase, and are there any pending special assessments or reserve-fund shortfalls?
- Is there a deadline driving the sale (1031 exchange, divorce, estate, relocation)? That informs how much negotiation room exists.
- The area grade is low — what's the realistic commute time and amenity access for the typical tenant pool here? Any planned neighborhood developments (good or bad) we should know about?
- What's the average days-on-market for RENTAL listings here right now (not sales)? A rising rental-DOM trend means longer vacancies and softer asking-rent achievability than the comps imply.
- What's the recent tenant-quality profile in this submarket — average credit score on applications, eviction rate, late-payment / NSF rate, and stable-employment percentage? A property-management company in the area should have these aggregated.
- How much new for-sale + rental construction is in the pipeline within 1–3 miles? Heavy new supply typically softens prices + rents 12–24 months out; constrained supply supports both.
Investment metrics
- 1% rule
- 0.76% ✗
- Cap rate
- 1.94%
- Cash-on-cash
- -15.53%
- DSCR
- 0.31
- GRM
- 11.0
CMA / ARV
No comps found within radius.
Show comp detail 12 sales within ~0.75 mi
| Address | Dist | Beds/Ba | Sqft | Sold | Price | $/sf | Match |
|---|---|---|---|---|---|---|---|
| 181 Long Hill Rd Unit 8-12 | 0.14mi | 1/1.0 | — | 1mo | $335,800 | — | 78 |
| 181 Long Hill Rd Unit 2-8 | 0.17mi | 1/1.0 | — | 2mo | $330,000 | — | 76 |
| 181 Long Hill Rd Unit K-5 | 0.02mi | 2/2.5 (+1) | — | 4mo | $408,000 | — | 75 |
| 6 Cliff Rd Unit D2 | 0.51mi | 2/2.0 (+1) | — | 2mo | $665,000 | — | 56 |
| 8 Cliff Rd Unit B3 | 0.53mi | 2/2.0 (+1) | — | 1mo | $640,000 | — | 55 |
| 7 Cliff Rd Unit D3 | 0.50mi | 2/2.0 (+1) | — | 3mo | $665,000 | — | 55 |
| 8 Quartz Way | 0.58mi | 2/2.0 (+1) | — | 1mo | $780,000 | — | 53 |
| 12 Quartz Way | 0.57mi | 2/2.0 (+1) | — | 1mo | $749,900 | — | 53 |
| 22 Cedarwood Ter | 0.63mi | 2/2.5 (+1) | — | 2mo | $560,000 | — | 48 |
| 3 Slate Ct Unit D-1 | 0.72mi | 2/2.0 (+1) | — | 1mo | $681,000 | — | 47 |
| 141 Wedgewood Dr #18 | 0.73mi | 2/2.0 (+1) | — | 0mo | $540,000 | — | 46 |
| 3 Slate Ct #707 | 0.72mi | 2/2.0 (+1) | — | 2mo | $680,000 | — | 45 |
Match score weights: distance 35% · size 25% · config 20% · recency 20%. Top-matched comps best support the ARV.
Projected returns pro-forma
-3.0% appreciation · 3.0% rent growth · sell at horizon
- IRR
- -45.9%
- Equity multiple
- -0.40×
- Total profit
- $-127,100
- Equity at exit
- $48,459
- IRR
- -82.6%
- Equity multiple
- -1.25×
- Total profit
- $-204,924
- Equity at exit
- $28,100
Cash invested: $91,000 (down + closing). Projections, not guarantees.
Landlord ↔ Tenant lean methodology
- Overall (STATE)
- 21 Tenant-Leaning
- State New Jersey
- 21 Tenant-Leaning · D+6
- County
- — inherits STATE
- City
- — inherits STATE
ZIP-level market 07424
- Active inventory
- 42
- Price-to-rent
- 11.0×
Monthly cashflow live
- Estimated rent
- $2,464 high interval (Pro) →
- Mortgage (P&I)
- −$1,704
- Tax est. 1.5%
- −$406 /mo · $4,875/yr
- Insurance
- −$135
- HOA
- −$878
- Vacancy / Maint / Mgmt
- −$517
- Net cashflow
- $-1,178
Break-even live
UW: 25.0% down · 7.5% · 30yr · 1.5% tax · 5.0% vac · 8.0% maint · 8.0% mgmt
Financing live
Cash to close
- Down payment
- $81,250
- Closing costs
- $9,750
- Reserves months
- —
- Total cash needed
- —
Loan-product check · same deal, 3 products live
Conventional
25% down · 7.5% · 30yr
- Down + closing
- —
- Monthly P&I
- —
- Monthly cashflow
- —
- DSCR
- —
- Eligible?
- —
Personal DTI + credit; lowest rate.
DSCR
20% down · 8.5% · 30yr
- Down + closing
- —
- Monthly P&I
- —
- Monthly cashflow
- —
- DSCR
- —
- Eligible?
- —
No personal income docs; deal must DSCR.
Hard money
10% down · 12.0% · 12mo
- Down + closing
- —
- Monthly P&I
- —
- Monthly cashflow
- —
- DSCR
- —
- Eligible?
- —
Short-term bridge; refi at stabilization.
Rent comps 19 comps
| Address | Beds | Baths | Sqft | Rent | $/sqft | DOM | Units | Dist |
|---|---|---|---|---|---|---|---|---|
| 125 Long Hill Rd Little Falls, NJ | 1.0–2.0 | 1.0 | 725 | $2,365 | $3.26 | 1d | 3 | 0.34mi |
| 10 Lower Notch Rd Woodland Park, NJ | 2.0 | 2.0 | 1370 | $3,300 | $2.41 | 1d | 1 | 0.37mi |
| 1 Colonial Dr Unit 1B Little Falls, NJ | 1.0 | 1.0 | — | $1,900 | — | 11d | 1 | 0.44mi |
| 3 Capalbo Ave Little Falls Township, NJ | 2.0 | 1.0 | — | $2,701 | — | 1d | 1 | 0.52mi |
| 79 Lower Notch Rd #1 Little Falls, NJ | 2.0 | 1.0 | 850 | $2,300 | $2.71 | 1d | 1 | 0.53mi |
| 8 Quarry Dr Unit C1 Woodland Park, NJ | 2.0 | 2.0 | 1738 | $3,900 | $2.24 | 1d | 1 | 0.53mi |
| 200 E Main St Little Falls, NJ | 1.0 | 1.0 | — | $2,400 | — | 1d | 1 | 0.68mi |
| 2 Cedar Grove Rd Unit 4 Little Falls Township, NJ | 2.0 | 1.0 | — | $2,450 | — | 1d | 1 | 0.85mi |
| 114 E Main St Unit 1 Little Falls Township, NJ | 2.0 | 1.5 | — | $2,600 | — | 1d | 1 | 0.89mi |
| 39 Wilmore Rd Unit 2 Little Falls Township, NJ | 2.0 | 1.0 | 850 | $2,500 | $2.94 | 1d | 1 | 1.10mi |
| 44 Main St Little Falls, NJ | 1.0–2.0 | 1.0–2.0 | 863 | $2,625 | $3.04 | 1d | 4 | 1.28mi |
| 565 Grove St Unit D-8 Clifton, NJ | 1.0 | 1.0 | — | $1,725 | — | 24d | 1 | 1.32mi |
| 605 Grove St Unit D4 Clifton, NJ | 1.0 | 1.0 | — | $2,500 | — | 24d | 1 | 1.35mi |
| 213 Overmount Ave Woodland Park, NJ | 1.0–2.0 | 1.0 | 912 | $2,090 | $2.29 | 1d | 2 | 1.38mi |
| 1108 McBride Ave Unit 4 Woodland Park, NJ | 1.0 | 1.0 | — | $2,200 | — | 24d | 1 | 1.40mi |
| 968 McBride Ave Woodland Park, NJ | 2.0 | 1.0 | — | $2,200 | — | 10d | 1 | 1.42mi |
| 178 E Lindsley Rd Unit 2 Cedar Grove, NJ | 2.0 | 1.0 | — | $3,200 | — | 15d | 1 | 1.43mi |
| 51 Haverhill Ave Apt 2 Woodland Park, NJ | 2.0 | 1.0 | — | $2,400 | — | 4d | 1 | 1.45mi |
| 1040 McBride Ave Unit 4 Woodland Park, NJ | 1.0 | 1.0 | — | $1,900 | — | 1d | 1 | 1.45mi |
HOA detail
- Monthly dues
- $878 · $10,536/yr
Listing history 9 events
-
2026-06-18days on market $325,000 Active 14 DOM
-
2026-06-17days on market $325,000 Active 13 DOM
-
2026-06-16days on market $325,000 Active 12 DOM
-
2026-06-15days on market $325,000 Active 11 DOM
-
2026-06-13days on market $325,000 Active 9 DOM
-
2026-06-13days on market $325,000 Active 8 DOM
-
2026-06-09days on market $325,000 Active 5 DOM
-
2026-06-08days on market $325,000 Active 4 DOM
-
2026-06-07$325,000 Active 3 DOM
ⓘ Source: listings_history table (triggers on properties + properties_extension) + one-shot
backfill from property_details.listing_events for pre-trigger history.
Climate risk First Street
- Flood 1/10 Low FEMA zone X (unshaded) · 0% chance over 30 yrs
- Wildfire 1/10 Low
- Heat 6/10 Major 7 d/yr ≥100°F today · 14 d/yr by 30 yrs out
- Wind 6/10 Major 27% chance of damaging wind over 30 yrs
- Air quality 4/10 Moderate 3 unhealthy d/yr today · 5 by 30 yrs out
Nearby sold comps map
Loading sold comps map…
Walkable amenities ~0.75 mi
Loading nearby amenities…
Taxation est. · year 1
- Rental income
- $29,563
- − Mortgage interest
- −$18,205
- − Property taxes
- −$4,875
- − Insurance
- −$1,625
- − Repairs & maintenance
- −$2,365
- − Management
- −$2,365
- − HOA
- −$10,536
- − Depreciation
- −$9,455
- Taxable loss
- −$19,863
- Est. tax savings @ 24.0%
- +$4,767
- After-tax cash flow
- $-9,366/yr
For passive investors: Depreciation is non-cash, so a rental often shows a tax loss while cash-flowing — sheltering income. Rental losses are passive: they offset passive income freely, and up to $25,000/yr can offset ordinary (W-2) income if you actively participate and your MAGI is under $100k (phasing out to $0 by $150k); unused losses carry forward. On sale, claimed depreciation is recaptured at up to 25%, and gains may owe capital-gains tax (a 1031 exchange can defer both). Figures are a year-1 estimate at your 24.0% rate — not tax advice; consult a CPA.
Schools (NCES district)
- District
- Passaic Valley Regional High School District #1
- NCES district ID
- 3412570
- Math proficiency
- 23% ▼ -8.00%
- Reading proficiency
- 45% ▼ -3.00%
- Median HH income
- $78,223
- Composite
- 32.13/100
- National rank
- #5799
- State rank
- #271 of 472 in NJ
Livability — Great Notch
No livability data for this city. (Only ~50 U.S. cities are tracked.)
Census & demographics
- Census place
- Great Notch, NJ
- County
- Passaic County · 360,294 people
- Metro
- New York-Newark-Jersey City, NY-NJ-PA
- Population (ZIP)
- 28,085
- Household income
- $105,050
- Rent vs Own
- Severe rent burden
- 835.0
Population outlook (Passaic County) Hauer SSP2
- Today (2025)
- 525,915 people
- By 2030
- 532,160 · +1.2%
- By 2040
- 543,670 · +3.4%
- By 2050
- 554,326 · +5.4%
- By 2075
- 584,728 · +11.2%
- By 2100
- 598,978 · +13.9%
Race, ethnicity, and origin ACS 2023
- Neighborhood character
- Majority White (63%)
- Race & ethnicity
- White 63% Hispanic / Latino 24% Two or more races 10% Asian 7% Black 4%
- Hispanic origin (detail)
- Mexican 1% Puerto Rican 5% Cuban 1% Dominican 4%
- Common ancestry
- Romanian 5% Armenian 3% Iranian 1%
- Foreign-born
- 24% · Canada, Jamaica, China
- Languages at home
- 65% English-only · Spanish 15% Arabic 8% Other Indo-European 4%
Political lean MEDSL · Passaic
- 2024 margin
- Toss-up / Even · D 46.9% · R 49.8% · Other 3.3%
- 2008→2024 swing
- -24.6pp toward R · 2008: 21.7pp · 2024: -2.9pp
- All cycles
- 2024: R+2.9 2020: D+16.5 2016: D+21.8 2012: D+27.3 2008: D+21.7
Not yet ingested
- Civics
- —
Market trends
- HPI YoY
- ▼ -202.53%
- Current HPI
- 278.7888
- Rent YoY
- —
- Metro
- New York-Newark-Jersey City, NY-NJ-PA
- State GDP YoY
- ▲ 2.05%
- F500 in state
- 34
Industry mix (Fortune 500 HQ in NJ)
| Industry | F500 HQs | Revenue |
|---|---|---|
| Consumer Goods | 3 | $31B |
|
||
| Pharmaceuticals | 2 | $153B |
|
||
| Technology | 2 | $21B |
|
||
| Insurance | 2 | $20B |
|
||
| Healthcare | 2 | $19B |
|
||
| Financial Services | 1 | $70B |
|
||
Price history
-98.6% since first listed34 events — show timeline
- 2026-06-03 Listed $325,000 NJMLS
- 2026-01-30 Listed $415,000 NJMLS
- 2025-10-02 Sold (MLS) $335,000 GSMLS
- 2025-08-21 Pending — GSMLS
- 2025-08-07 Rental Removed $1,600 SHOWMOJO
- 2025-08-06 Listed $310,000 GSMLS
- 2025-07-30 Listed for Rent $1,600 SHOWMOJO
- 2025-07-10 Sold (MLS) $466,000 NJMLS
- 2025-06-09 Contingent — NJMLS
- 2025-05-27 Pending — NJMLS
- 2025-05-21 Listed $409,000 NJMLS
- 2025-04-22 Sold (MLS) $390,000 NJMLS
- 2025-01-27 Contingent — NJMLS
- 2025-01-16 Rental Removed $2,400 NJMLS
- 2025-01-11 Listed for Rent $2,400 NJMLS
- 2024-10-11 Sold (MLS) $290,000 GSMLS
- 2024-08-24 Pending — GSMLS
- 2024-08-09 Listed $250,000 GSMLS
- 2022-01-21 Sold (MLS) $245,000 NJMLS
- 2021-10-11 Contingent — NJMLS
- 2021-09-14 Listed $249,999 NJMLS
- 2020-03-06 Sold (MLS) $205,000 GSMLS
- 2019-12-03 Delisted — GSMLS
- 2019-10-28 Sold (MLS) $292,000 GSMLS
- 2019-09-18 Listed $220,000 GSMLS
- 2019-09-10 Delisted — GSMLS
- 2019-08-14 Sold (MLS) $315,450 GSMLS
- 2019-07-22 Price Changed $298,000 GSMLS
- 2019-06-12 Price Changed $305,000 GSMLS
- 2019-05-03 Listed $309,900 GSMLS
- 2015-10-02 Sold (MLS) $175,000 GSMLS
- 2015-08-26 Delisted — GSMLS
- 2015-06-24 Listed $184,900 GSMLS
- 1984-07-01 Sold (Public Records) $22,793,693 Public Records
Property tax history
+2.2%/yrLatest (2025): $2,155,284 · +4.9% YoY. Source: county tax records.
Cash-flow waterfall
monthlySold comps — $/sqft
last 12 mo · ≤1 miLoading sold comps…