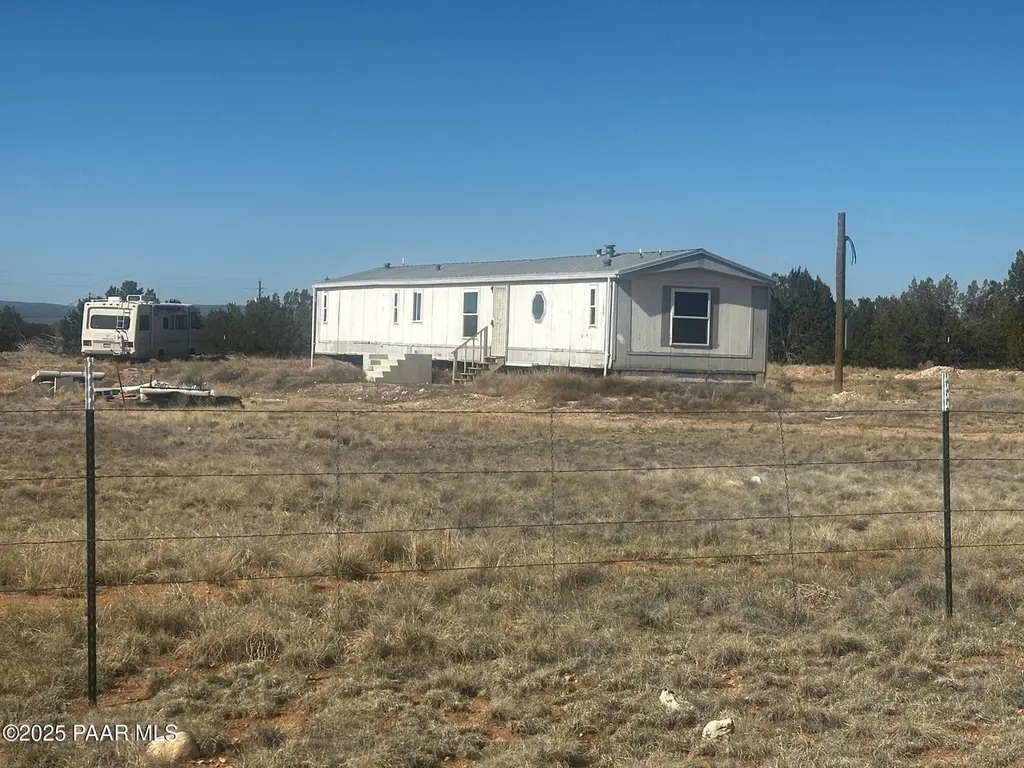
25085 Hillcrest Dr · Seligman, AZ
Flood risk 1/10 · Minimal
- FEMA flood zone
- D
- Chance of flooding over 30 yrs
- 0.0%
- Est. flood insurance / yr
- $544 – $1,084
Fire risk 5/10 · Moderate
- Est. fire insurance / yr
- $610 – $1,132
Heat risk 4/10 · Minor
- Hot days now (above 95°F)
- 7 days/yr
- Hot days in 30 yrs
- 19 days/yr
Wind risk 1/10 · Minimal
- Chance of severe wind over 30 yrs
- —
Air-quality risk 1/10 · Minimal
- Unhealthy air days now
- 0 days/yr
- Unhealthy air days in 30 yrs
- 0 days/yr
Risk factors via First Street. Map © Google.
Why this score? — see what drove the B grade
The composite is a weighted blend of 9 inputs, each scored 0–100. Each bar is that input's sub-score; the figure is the points it added to the 100-point composite (weight × sub-score).
- Cash flow +30.0/30.0
- 1% rule +10.0/10.0
- DSCR +10.0/10.0
- ARV discount +7.5/15.0
- Appreciation +4.0/10.0
- Livability +3.1/5.0
- Rent growth +2.5/5.0
- Condition / age +2.5/5.0
- Schools +2.4/10.0
$73,000
🖨 Deal sheet (PDF) 📄 Offer letter ✓ Due diligence
Listing remarks MLS
Great location for residential / service zoned lot. Just off of pavement and close to town. Everybody coming in or out of Bridge Canyon must pass Hillcrest Drive. There is an existing septic tank for 3 bedroom home. Flat and usable. Electricity at the lot line. Mostly fenced.
Key facts
- Large water cisterns
- Included rv
- 2.13 acre lot
Tags
Property features AI
Finance
- Other: Lot is level, rural and approximately 2.13 acres; Private maintained, unimproved dirt road frontage; Zoned RS-3
- HOA & community: Subdivision offers clubhouse and community kitchen; membership optional; Not a senior community
Exterior
- Parking: Off-street RV parking
- Utilities: Cistern water source; Hauled water; Other utilities; Water heater: Other (see remarks)
- Home design: Manufactured home (single wide); 12x80 plan; One story; Residential property
- Construction: Composition roof; Construction materials: Other; Piers foundation; Built area approximately 1,280
- Exterior features: Dirt driveway; Shed(s); Perimeter fencing; See remarks for additional exterior details
Interior
- Kitchen: Appliances listed in remarks
- Bedrooms: Master downstairs
- Flooring: See remarks
- Bathrooms: 2 full bathrooms
- Heating & cooling: Other heating
- Interior features: Master bedroom on main level; See remarks for appliances; See remarks for flooring
- Laundry & utility: See remarks
Neighborhood map
What this means for you Summary
Snapshot
- This is a 3-bed/2.0-bath manufactured listed at $73k.
Deal economics
- At list price, monthly cash flow is $820 ($10k/yr) — positive.
- The deal already cash-flows at list — no discount required.
- Meets the 1% rule at list price ($2k rent vs $73k).
- Recommended offer: $72k (1.5% below list) — sets the bar for market timing.
- Cap rate 19.8% vs local median 4.1% in Seligman — top-decile yield for the area; either an underpriced asset or a hidden risk that comps aren't pricing in. Stress-test before assuming the spread holds.
Location & tenants
- Location reads 62/100 on livability (#127 in AZ) — a middle-class / working-renter tenant base. Strengths: employment A+, cost of living A+; Watch: schools F, crime F, amenities F.
- Seligman Unified District (4472) (rural): math 20% / reading 30% proficiency, ranked #339 of 501 in AZ (top 68%) — low school quality limits family demand, transient renter base, plan for 1-2y turnover.
- Market conditions: 293 active listings in the ZIP; 2,062 units permitted in Yavapai County in 2024 (98 in 5+ unit buildings).
Forward outlook
- Local home prices are declining (-2.0%/yr); year-one equity from $505 of loan paydown is wiped out by about $1k of value loss. Plan a longer hold.
- Yavapai County population projected at +10% by 2050 — modest demand growth; plan on rents tracking national, not racing it.
- At projected returns (-2.0% appreciation + 3.0% rent growth), your $20k cash investment doubles in ~3 years — after that, you're playing with house money.
Negotiation context
- It's been on market 22 days — a 2% lower offer ($72k) is reasonable based on typical stale-listing flexibility.
- 4 sale attempts; this cycle's ask is 6% above the opening price — seller raised mid-cycle; expect resistance to lowballs.
- Current owner paid $25k; list at $73k implies a 192% gain — meaningful room to come down on a strong offer.
Risks & watch-outs
- Climate carrying-cost: moderate wildfire risk — expect insurance premiums to compound above CPI over the hold.
Questions for the listing agent
- Is there a deadline driving the sale (1031 exchange, divorce, estate, relocation)? That informs how much negotiation room exists.
- Schools are F-rated, which usually means shorter tenancies and higher turnover. Who's the typical renter profile here, and what's been the actual vacancy rate?
- Crime grade is F in this area — have there been break-ins, vandalism, or insurance claims at this property in the last 3 years? What carrier currently insures it and at what premium?
- What's the average days-on-market for RENTAL listings here right now (not sales)? A rising rental-DOM trend means longer vacancies and softer asking-rent achievability than the comps imply.
- What's the recent tenant-quality profile in this submarket — average credit score on applications, eviction rate, late-payment / NSF rate, and stable-employment percentage? A property-management company in the area should have these aggregated.
- How much new for-sale + rental construction is in the pipeline within 1–3 miles? Heavy new supply typically softens prices + rents 12–24 months out; constrained supply supports both.
Investment metrics
- 1% rule
- 2.30% ✓
- Cap rate
- 19.77%
- Cash-on-cash
- 48.13%
- DSCR
- 3.14
- GRM
- 3.6
CMA / ARV
No comps found within radius.
Projected returns pro-forma
-2.0% appreciation · 3.0% rent growth · sell at horizon
- IRR
- 46.9%
- Equity multiple
- 3.13×
- Total profit
- $43,500
- Equity at exit
- $14,175
- IRR
- 51.7%
- Equity multiple
- 6.28×
- Total profit
- $107,970
- Equity at exit
- $12,111
Cash invested: $20,440 (down + closing). Projections, not guarantees.
Landlord ↔ Tenant lean methodology
- Overall (STATE)
- 87 Strongly Landlord-Friendly
- State Arizona
- 87 Strongly Landlord-Friendly · R+3
- County
- — inherits STATE
- City
- — inherits STATE
ZIP-level market 86337
- Home prices YoY
- -1.0%
- Active inventory
- 293
- Price-to-rent
- 3.6×
Monthly cashflow live
- Estimated rent
- $1,676 medium interval (Pro) →
- Mortgage (P&I)
- −$383
- Tax est. 1.5%
- −$91 /mo · $1,095/yr
- Insurance
- −$30
- HOA
- −$0
- Vacancy / Maint / Mgmt
- −$352
- Net cashflow
- $820
Break-even live
Sensitivity live
| Price | -10% $870 | -5% $845 | +0% $820 | +5% $795 | +10% $769 |
|---|---|---|---|---|---|
| Rent | -10% $687 | -5% $754 | +0% $820 | +5% $886 | +10% $952 |
| Rate | -1.0pp $857 | -0.5pp $838 | base $820 | +0.5pp $801 | +1.0pp $782 |
UW: 25.0% down · 7.5% · 30yr · 1.5% tax · 5.0% vac · 8.0% maint · 8.0% mgmt
Financing live
Cash to close
- Down payment
- $18,250
- Closing costs
- $2,190
- Reserves months
- —
- Total cash needed
- —
Loan-product check · same deal, 3 products live
Conventional
25% down · 7.5% · 30yr
- Down + closing
- —
- Monthly P&I
- —
- Monthly cashflow
- —
- DSCR
- —
- Eligible?
- —
Personal DTI + credit; lowest rate.
DSCR
20% down · 8.5% · 30yr
- Down + closing
- —
- Monthly P&I
- —
- Monthly cashflow
- —
- DSCR
- —
- Eligible?
- —
No personal income docs; deal must DSCR.
Hard money
10% down · 12.0% · 12mo
- Down + closing
- —
- Monthly P&I
- —
- Monthly cashflow
- —
- DSCR
- —
- Eligible?
- —
Short-term bridge; refi at stabilization.
Listing history 18 events
-
2026-06-21days on market $73,000 Active 22 DOM
-
2026-06-19days on market $73,000 Active 20 DOM
-
2026-06-18days on market $73,000 Active 19 DOM
-
2026-06-17days on market $73,000 Active 18 DOM
-
2026-06-16days on market $73,000 Active 17 DOM
-
2026-06-15days on market $73,000 Active 16 DOM
-
2026-06-14days on market $73,000 Active 14 DOM
-
2026-06-13days on market $73,000 Active 13 DOM
-
2026-06-10days on market $73,000 Active 11 DOM
-
2026-06-09days on market $73,000 Active 10 DOM
-
2026-06-08days on market $73,000 Active 9 DOM
-
2026-06-07days on market $73,000 Active 8 DOM
-
2026-06-03days on market $73,000 Active 4 DOM
-
2026-06-03price $73,000 Active 3 DOM
-
2026-06-02days on market $69,000 Active 3 DOM
-
2026-06-01days on market $69,000 Active 2 DOM
-
2026-05-31remarks 371-char remark
-
2026-05-31$69,000 Active 1 DOM
ⓘ Source: listings_history table (triggers on properties + properties_extension) + one-shot
backfill from property_details.listing_events for pre-trigger history.
Climate risk First Street
- Flood 1/10 Low FEMA zone D · 0% chance over 30 yrs
- Wildfire 5/10 Major
- Heat 4/10 Moderate 7 d/yr ≥95°F today · 19 d/yr by 30 yrs out
- Wind 1/10 Low
- Air quality 1/10 Low 0 unhealthy d/yr today · 0 by 30 yrs out
Nearby sold comps map
Loading sold comps map…
Walkable amenities ~0.75 mi
Loading nearby amenities…
Taxation est. · year 1
- Rental income
- $20,115
- − Mortgage interest
- −$4,089
- − Property taxes
- −$1,095
- − Insurance
- −$365
- − Repairs & maintenance
- −$1,609
- − Management
- −$1,609
- − Depreciation
- −$2,124
- Taxable income
- $9,224
- Est. tax owed @ 24.0%
- −$2,214
- After-tax cash flow
- $7,623/yr
For passive investors: Depreciation is non-cash, so a rental often shows a tax loss while cash-flowing — sheltering income. Rental losses are passive: they offset passive income freely, and up to $25,000/yr can offset ordinary (W-2) income if you actively participate and your MAGI is under $100k (phasing out to $0 by $150k); unused losses carry forward. On sale, claimed depreciation is recaptured at up to 25%, and gains may owe capital-gains tax (a 1031 exchange can defer both). Figures are a year-1 estimate at your 24.0% rate — not tax advice; consult a CPA.
Schools (NCES district)
- District
- Seligman Unified District (4472)
- NCES district ID
- 0407630
- Math proficiency
- 20% ▬ 0.00%
- Reading proficiency
- 30% ▬ 0.00%
- Median HH income
- $35,531
- Composite
- 23.7/100
- National rank
- #13238
- State rank
- #339 of 501 in AZ
Livability — Seligman
- Score
- 62/100
- State rank
- #127
- US rank
- #16174
Category grades
Schools grade is shown separately in the Schools card above.
Census & demographics
- Population (ZIP)
- 1,827
Population outlook (Yavapai County) Hauer SSP2
- Today (2025)
- 241,389 people
- By 2030
- 249,523 · +3.4%
- By 2040
- 259,966 · +7.7%
- By 2050
- 264,736 · +9.7%
- By 2075
- 269,334 · +11.6%
- By 2100
- 256,505 · +6.3%
Race, ethnicity, and origin ACS 2023
- Neighborhood character
- Predominantly White (70%)
- Race & ethnicity
- White 70% Hispanic / Latino 19% Two or more races 9% Native American 4% Asian 1%
- Hispanic origin (detail)
- Mexican 18%
- Common ancestry
- Slovak 7% Lithuanian 4% Serbian 3%
- Foreign-born
- 1% · Canada
- Languages at home
- 94% English-only · Spanish 5% Other Asian/Pacific 1%
Political lean MEDSL · Yavapai
- 2024 margin
- Solid R (+33.9) · D 32.6% · R 66.5%
- 2008→2024 swing
- -9.5pp toward R · 2008: -24.4pp · 2024: -33.9pp
- All cycles
- 2024: R+33.9 2020: R+29.3 2016: R+31.4 2012: R+30.7 2008: R+24.4
Not yet ingested
- Civics
- —
Market trends
- HPI YoY
- ▼ -2.00%
- Current HPI
- 196.1506
- Rent YoY
- —
- Metro
- —
- State GDP YoY
- ▲ 4.54%
- F500 in state
- 20
Industry mix (Fortune 500 HQ in AZ)
| Industry | F500 HQs | Revenue |
|---|---|---|
| Technology | 2 | $13B |
|
||
| Mining / Metals | 1 | $23B |
|
||
| Environmental Services | 1 | $16B |
|
||
| Metals / Steel | 1 | $14B |
|
||
| Technology Distribution | 1 | $9B |
|
||
| Homebuilding | 1 | $8B |
|
||
Price history
+176.1% since first listed12 events — show timeline
- 2026-05-30 Listed $69,000 PAARMLS as Distributed by MLS Grid
- 2026-01-10 Price Changed $70,000 PAARMLS as Distributed by MLS Grid
- 2025-09-18 Price Changed $75,000 PAARMLS as Distributed by MLS Grid
- 2025-09-18 Relisted — PAARMLS as Distributed by MLS Grid
- 2025-09-18 Listing Removed — PAARMLS as Distributed by MLS Grid
- 2025-08-22 Pending — PAARMLS as Distributed by MLS Grid
- 2025-07-25 Price Changed $85,000 PAARMLS as Distributed by MLS Grid
- 2025-05-17 Relisted — PAARMLS as Distributed by MLS Grid
- 2025-04-18 Listing Removed — PAARMLS as Distributed by MLS Grid
- 2025-04-17 Listed $99,900 PAARMLS as Distributed by MLS Grid
- 2021-06-08 Sold (Public Records) $24,995 Public Records
- 2021-06-08 Sold (MLS) $24,995 PAARMLS as Distributed by MLS Grid
Property tax history
-3.1%/yrLatest (2025): $58 · +4.1% YoY. Source: county tax records.
Cash-flow waterfall
monthlySold comps — $/sqft
last 12 mo · ≤1 miLoading sold comps…