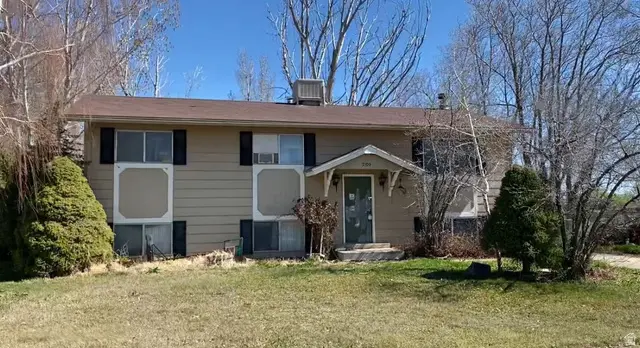
2109 S 3400 W · Syracuse, UT
Flood risk 1/10 · Minimal
- FEMA flood zone
- X (unshaded)
- Chance of flooding over 30 yrs
- 0.0%
- Est. flood insurance / yr
- $507 – $1,088
Fire risk 4/10 · Minor
- Est. fire insurance / yr
- $453 – $841
Heat risk 4/10 · Minor
- Hot days now (above 95°F)
- 7 days/yr
- Hot days in 30 yrs
- 17 days/yr
Wind risk 1/10 · Minimal
- Chance of severe wind over 30 yrs
- —
Air-quality risk 2/10 · Minimal
- Unhealthy air days now
- 1 days/yr
- Unhealthy air days in 30 yrs
- 2 days/yr
Risk factors via First Street. Map © Google.
Why this score? — see what drove the D- grade
The composite is a weighted blend of 9 inputs, each scored 0–100. Each bar is that input's sub-score; the figure is the points it added to the 100-point composite (weight × sub-score).
- Cash flow +10.9/30.0
- ARV discount +7.5/15.0
- Livability +4.3/5.0
- Schools +4.1/10.0
- DSCR +3.2/10.0
- Rent growth +2.5/5.0
- Condition / age +2.5/5.0
- 1% rule +2.4/10.0
- Appreciation +0.0/10.0
$305,000
🖨 Deal sheet 📄 Offer letter ✓ Due diligence
Key facts
- 0.51 acre lot
- Built 1980
Neighborhood map
What this means for you Summary
Snapshot
- This is a 3-bed/1.0-bath single-family listed at $305k.
Deal economics
- At list price, monthly cash flow is $-134 ($-2k/yr) — negative.
- To cash-flow at today's rent, offer at most $281k (7.8% below list).
- To meet the 1% rule (rent ≥ 1% of price), the offer needs to be $224k (26.5% below list).
- Recommended offer: $224k (26.5% below list) — sets the bar for 1% rule.
Location & tenants
- Location reads 86/100 on livability (#8 in UT, #353 nationally) — a professional / high-income tenant draw. Strengths: crime A+, employment A+, housing A+; Watch: cost of living F.
- Davis District (suburban): math 43% / reading 47% proficiency, ranked #28 of 80 in UT (top 35%) — families likely to look elsewhere, expect single-tenant / working-renter base with shorter leases; only 19% free/reduced lunch — higher-income household profile.
- Zoned schools: Buffalo Point School (math 42% / reading 42%, grade F, #287 of 585 statewide, top 52%, 938 students, 11% FRL); Syracuse Jr High (math 33% / reading 44%, grade F, #82 of 138 statewide, top 60%, 1,359 students, 14% FRL); Syracuse High (math 27% / reading 45%, grade F, #90 of 171 statewide, top 53%, 2,452 students, 13% FRL).
- Market conditions: 202 active listings in the ZIP; high-income renter base; 1,461 units permitted in Davis County in 2024 (508 in 5+ unit buildings).
Forward outlook
- Local home prices are declining (-3.0%/yr); year-one equity from $2k of loan paydown is wiped out by about $9k of value loss. Plan a longer hold.
- Davis County population projected at +39% by 2050 — long-run rental-demand tailwind backs the buy-and-hold thesis.
Negotiation context
- Only 0 days on market — expect competitive offers; lowballing is unlikely to land.
Questions for the listing agent
- What do current leases actually rent for vs. the listed asking? Can we see a recent rent roll and the last 12 months of T-12 income?
- Is there a deadline driving the sale (1031 exchange, divorce, estate, relocation)? That informs how much negotiation room exists.
- Schools are B-rated — typically a magnet for longer-tenancy family renters. What's the average tenant stay here, and is there a school-zone premium baked into asking?
- The area grade is low — what's the realistic commute time and amenity access for the typical tenant pool here? Any planned neighborhood developments (good or bad) we should know about?
- What's the average days-on-market for RENTAL listings here right now (not sales)? A rising rental-DOM trend means longer vacancies and softer asking-rent achievability than the comps imply.
- What's the recent tenant-quality profile in this submarket — average credit score on applications, eviction rate, late-payment / NSF rate, and stable-employment percentage? A property-management company in the area should have these aggregated.
- How much new for-sale + rental construction is in the pipeline within 1–3 miles? Heavy new supply typically softens prices + rents 12–24 months out; constrained supply supports both.
Investment metrics
- 1% rule
- 0.74% ✗
- Cap rate
- 5.77%
- Cash-on-cash
- -1.88%
- DSCR
- 0.92
- GRM
- 11.3
CMA / ARV
No comps found within radius.
Projected returns pro-forma
-3.0% appreciation · 3.0% rent growth · sell at horizon
- IRR
- -19.5%
- Equity multiple
- 0.32×
- Total profit
- $-58,051
- Equity at exit
- $45,476
- IRR
- -12.3%
- Equity multiple
- 0.28×
- Total profit
- $-61,909
- Equity at exit
- $26,371
Cash invested: $85,400 (down + closing). Projections, not guarantees.
Landlord ↔ Tenant lean methodology
- Overall (STATE)
- 86 Strongly Landlord-Friendly
- State Utah
- 86 Strongly Landlord-Friendly · R+15
- County
- — inherits STATE
- City
- — inherits STATE
ZIP-level market 84075
- Home prices YoY
- -24.8%
- Active inventory
- 202
- Price-to-rent
- 11.3×
Monthly cashflow live
- Estimated rent
- $2,243 medium interval (Pro) →
- Mortgage (P&I)
- −$1,599
- Tax from tax record
- −$180 /mo · $2,155/yr
- Insurance
- −$127
- HOA
- −$0
- Vacancy / Maint / Mgmt
- −$471
- Net cashflow
- $-134
Break-even live
UW: 25.0% down · 7.5% · 30yr · 1.5% tax · 5.0% vac · 8.0% maint · 8.0% mgmt
Financing live
Cash to close
- Down payment
- $76,250
- Closing costs
- $9,150
- Reserves months
- —
- Total cash needed
- —
Loan-product check · same deal, 3 products live
Conventional
25% down · 7.5% · 30yr
- Down + closing
- —
- Monthly P&I
- —
- Monthly cashflow
- —
- DSCR
- —
- Eligible?
- —
Personal DTI + credit; lowest rate.
DSCR
20% down · 8.5% · 30yr
- Down + closing
- —
- Monthly P&I
- —
- Monthly cashflow
- —
- DSCR
- —
- Eligible?
- —
No personal income docs; deal must DSCR.
Hard money
10% down · 12.0% · 12mo
- Down + closing
- —
- Monthly P&I
- —
- Monthly cashflow
- —
- DSCR
- —
- Eligible?
- —
Short-term bridge; refi at stabilization.
Listing history 2 events
-
2026-05-24historical
-
2026-05-24$305,000
ⓘ Source: listings_history table (triggers on properties + properties_extension) + one-shot
backfill from property_details.listing_events for pre-trigger history.
Tax reassessment forecast UT · Resets to sale price
- Current annual tax
- $2,155 · $180/mo
- Projected year-2 tax
- $2,155 · $180/mo
- Expected delta
- $0/yr ($0/mo · 0.0%)
ⓘ Screening estimate from a state-policy table — verify with the county assessor before closing.
Climate risk First Street
- Flood 1/10 Low FEMA zone X (unshaded) · 0% chance over 30 yrs
- Wildfire 4/10 Moderate
- Heat 4/10 Moderate 7 d/yr ≥95°F today · 17 d/yr by 30 yrs out
- Wind 1/10 Low
- Air quality 2/10 Low 1 unhealthy d/yr today · 2 by 30 yrs out
Nearby sold comps map
Loading sold comps map…
Walkable amenities ~0.75 mi
Loading nearby amenities…
Taxation est. · year 1
- Rental income
- $26,917
- − Mortgage interest
- −$17,085
- − Property taxes
- −$2,155
- − Insurance
- −$1,525
- − Repairs & maintenance
- −$2,153
- − Management
- −$2,153
- − Depreciation
- −$8,873
- Taxable loss
- −$7,027
- Est. tax savings @ 24.0%
- +$1,686
- After-tax cash flow
- $78/yr
For passive investors: Depreciation is non-cash, so a rental often shows a tax loss while cash-flowing — sheltering income. Rental losses are passive: they offset passive income freely, and up to $25,000/yr can offset ordinary (W-2) income if you actively participate and your MAGI is under $100k (phasing out to $0 by $150k); unused losses carry forward. On sale, claimed depreciation is recaptured at up to 25%, and gains may owe capital-gains tax (a 1031 exchange can defer both). Figures are a year-1 estimate at your 24.0% rate — not tax advice; consult a CPA.
Schools (NCES district)
- District
- Davis District
- NCES district ID
- 4900210
- Math proficiency
- 43% ▼ -9.00%
- Reading proficiency
- 47% ▼ -5.00%
- Median HH income
- $70,511
- Composite
- 40.59/100
- National rank
- #3698
- State rank
- #28 of 80 in UT
Livability — Syracuse
- Score
- 86/100
- State rank
- #8
- US rank
- #353
Category grades
Schools grade is shown separately in the Schools card above.
Census & demographics
- Census place
- Syracuse, UT
- County
- Davis County · 341,755 people
- City population
- 35,545
- Metro
- Ogden-Clearfield, UT
- Population (ZIP)
- 35,545
- Household income
- $133,286
- Rent vs Own
- Severe rent burden
- 113.0
Population outlook (Davis County) Hauer SSP2
- Today (2025)
- 399,271 people
- By 2030
- 430,528 · +7.8%
- By 2040
- 493,485 · +23.6%
- By 2050
- 555,187 · +39.1%
- By 2075
- 688,589 · +72.5%
- By 2100
- 769,646 · +92.8%
Race, ethnicity, and origin ACS 2023
- Neighborhood character
- Predominantly White (86%)
- Race & ethnicity
- White 86% Hispanic / Latino 8% Two or more races 5% Asian 2%
- Hispanic origin (detail)
- Mexican 5%
- Common ancestry
- Slovak 6% Italian 3% Portuguese 3%
- Foreign-born
- 3% · Canada, Dominican Republic
- Languages at home
- 92% English-only · Spanish 5% Other Indo-European 1% Tagalog/Filipino 1%
Political lean MEDSL · Davis
- 2024 margin
- Strong R (+24.9) · D 36.0% · R 60.8% · Other 3.2%
- 2008→2024 swing
- +17.4pp toward D · 2008: -42.3pp · 2024: -24.9pp
- All cycles
- 2024: R+24.9 2020: R+27.5 2016: R+23.3 2012: R+61.8 2008: R+42.3
Not yet ingested
- Civics
- —
Market trends
- HPI YoY
- ▼ -102.18%
- Current HPI
- 310.6904
- Rent YoY
- —
- Metro
- Ogden-Clearfield, UT
- State GDP YoY
- ▲ 3.54%
- F500 in state
- 2
Industry mix (Fortune 500 HQ in UT)
| Industry | F500 HQs | Revenue |
|---|---|---|
| Financial Services | 1 | $3B |
|
||
Price history
2 events — show timeline
- 2026-05-24 Listing Removed — WFRMLS
- 2026-05-24 Listed $305,000 WFRMLS
Property tax history
+6.7%/yrLatest (2025): $2,155 · +2.0% YoY. Source: county tax records.
Cash-flow waterfall
monthlySold comps — $/sqft
last 12 mo · ≤1 miLoading sold comps…