1901 Millington Sq · Bel Air North, MD
Flood risk 1/10 · Minimal
- FEMA flood zone
- X (unshaded)
- Chance of flooding over 30 yrs
- 0.0%
- Est. flood insurance / yr
- $473 – $860
Fire risk 3/10 · Minor
- Est. fire insurance / yr
- $755 – $1,403
Heat risk 6/10 · Moderate
- Hot days now (above 105°F)
- 7 days/yr
- Hot days in 30 yrs
- 15 days/yr
Wind risk 5/10 · Moderate
- Chance of severe wind over 30 yrs
- 24.0%
Air-quality risk 3/10 · Minor
- Unhealthy air days now
- 3 days/yr
- Unhealthy air days in 30 yrs
- 5 days/yr
Risk factors via First Street. Map © Google.
Why this score? — see what drove the C grade
The composite is a weighted blend of 9 inputs, each scored 0–100. Each bar is that input's sub-score; the figure is the points it added to the 100-point composite (weight × sub-score).
- Cash flow +20.0/30.0
- ARV discount +15.0/15.0
- DSCR +6.3/10.0
- 1% rule +5.4/10.0
- Livability +4.1/5.0
- Rent growth +3.6/5.0
- Schools +2.9/10.0
- Condition / age +2.5/5.0
- Appreciation +0.0/10.0
$275,000
🖨 Deal sheet (PDF) 📄 Offer letter ✓ Due diligence
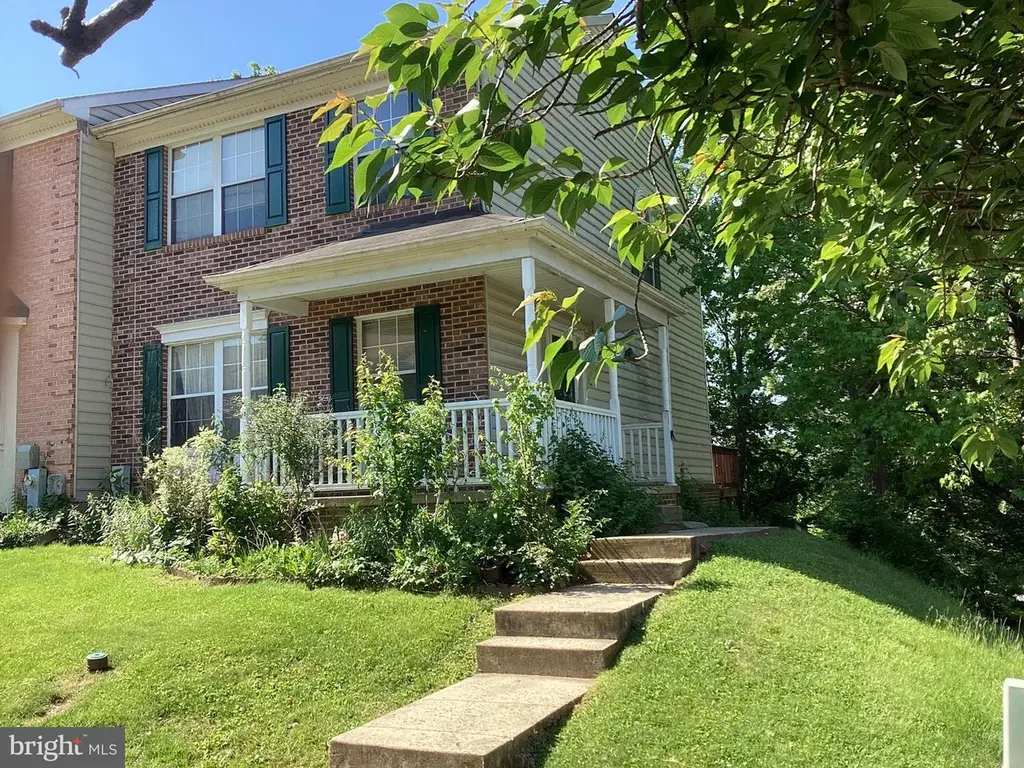
Listing remarks
Opportunity awaits in this 3 bedroom, 3 1/2 bath end of group townhome in The Villages of Thomas Run. This property is an ESTATE SALE, and being sold "AS-IS", sellers will make no repairs. Home will require extensive interior renovations and is not in move in condition. HVAC and water heater are recent. Close to great schools and shopping.
Key facts
- $125 HOA
- Built 1993
- Listed 3 days
Property features AI
Finance
- Other: Ownership is fee simple; Property condition: major rehab needed
- HOA & community: Monthly HOA fee of $125
Exterior
- Parking: On-street parking
- Utilities: Public water; Public sewer; Electric service for heating, cooling, and hot water
- Home design: End of row townhouse; Brick front with vinyl siding; Asphalt roof
- Construction: Brick front and vinyl siding construction; Asphalt roof; Foundation described as other; Double-hung windows
- Exterior features: Corner lot/unit; Basement with daylight/partial exposure, outside entrance, rear entrance and walkout level; Basement is partially finished and improved with connecting stairway and interior access; Not in a federal flood zone; Ground rent paid annually
Interior
- Kitchen: Electric oven/range; Dishwasher; Garbage disposal; Breakfast room adjacent to kitchen
- Bedrooms: Three bedrooms on the upper level (including master bedroom); Additional bedrooms listed as Bedroom 2 and Bedroom 3
- Flooring: Carpet; Vinyl
- Bathrooms: Three full bathrooms (two on upper level, one on lower level); One half bathroom on the main level
- Heating & cooling: Heat pump heating; Central air conditioning (electric); Electric hot water
- Interior features: Six-panel doors; Dry wall on walls and ceilings; Living room, foyer, breakfast room, recreation room
- Laundry & utility: Washer and dryer in unit; Laundry located in the basement
Neighborhood map
What this means for you Summary
Snapshot
- This is a 3-bed/2.5-bath townhouse listed at $275k.
Deal economics
- At list price, monthly cash flow is $338 ($4k/yr) — positive.
- The deal already cash-flows at list — no discount required.
- Meets the 1% rule at list price ($3k rent vs $275k).
- Cap rate 7.8% vs local median 4.2% in Bel Air North — top-decile yield for the area; either an underpriced asset or a hidden risk that comps aren't pricing in. Stress-test before assuming the spread holds.
Location & tenants
- Location reads 82/100 on livability (#35 in MD, #1,269 nationally) — a professional / high-income tenant draw. Strengths: employment A+, housing A+, health & safety A+; Watch: crime C-, amenities C-, cost of living F.
- Harford County Public Schools (suburban): math 22% / reading 39% proficiency, ranked #9 of 24 in MD (top 38%) — families likely to look elsewhere, expect single-tenant / working-renter base with shorter leases.
- Market conditions: Rents rising fast (+4.2%/yr); 166 active listings in the ZIP; 2 comparable units currently listed for rent nearby; high-income renter base; 803 units permitted in Harford County in 2024 (26 in 5+ unit buildings).
Forward outlook
- Local home prices are declining (-3.0%/yr); year-one equity from $2k of loan paydown is wiped out by about $8k of value loss. Plan a longer hold.
Negotiation context
- Only 3 days on market — expect competitive offers; lowballing is unlikely to land.
- 2 sale attempts since 26y ago with the ask held roughly flat each time — persistent listings suggest the price (not the market) is what's stuck; bring a comps-based counter.
- Current owner paid $125k; list at $275k implies a 120% gain — meaningful room to come down on a strong offer.
Risks & watch-outs
- Climate carrying-cost: moderate wind risk, 24% chance of damaging wind over 30y; extreme-heat days projected 7→15/yr by 2055 (HVAC capex compounding) — expect insurance premiums to compound above CPI over the hold.
Questions for the listing agent
- What does the HOA fee cover, when was the last increase, and are there any pending special assessments or reserve-fund shortfalls?
- Is there a deadline driving the sale (1031 exchange, divorce, estate, relocation)? That informs how much negotiation room exists.
- Schools are B-rated — typically a magnet for longer-tenancy family renters. What's the average tenant stay here, and is there a school-zone premium baked into asking?
- What's the average days-on-market for RENTAL listings here right now (not sales)? A rising rental-DOM trend means longer vacancies and softer asking-rent achievability than the comps imply.
- What's the recent tenant-quality profile in this submarket — average credit score on applications, eviction rate, late-payment / NSF rate, and stable-employment percentage? A property-management company in the area should have these aggregated.
- How much new for-sale + rental construction is in the pipeline within 1–3 miles? Heavy new supply typically softens prices + rents 12–24 months out; constrained supply supports both.
Investment metrics
- 1% rule
- 1.04% ✓
- Cap rate
- 7.77%
- Cash-on-cash
- 5.26%
- DSCR
- 1.23
- GRM
- 8.0
CMA / ARV
- ARV (on-the-fly)
- $362,780
- Comps found
- 12
Show comp detail 12 sales within ~0.75 mi
| Address | Dist | Beds/Ba | Sqft | Sold | Price | $/sf | Match |
|---|---|---|---|---|---|---|---|
| 1901 Millington Sq | 0.00mi | 3/3.5 | 1,870 (0%) | 1mo | $260,000 | $139 | 96 |
| 1810 Wye Mills Ln | 0.18mi | 3/3.0 | 1,867 (-0%) | 1mo | $365,000 | $196 | 88 |
| 1831 Still Pond Way | 0.06mi | 3/1.5 | 1,760 (-6%) | 3mo | $312,000 | $177 | 81 |
| 1820 Queen Anne Sq | 0.30mi | 3/3.0 | 1,800 (-4%) | 1mo | $372,500 | $207 | 77 |
| 1812 Glendale Ln | 0.26mi | 3/3.0 | 1,760 (-6%) | 3mo | $345,000 | $196 | 74 |
| 1852 Oxford Sq | 0.25mi | 3/2.5 | 1,746 (-7%) | 4mo | $325,000 | $186 | 74 |
| 1903 Thomas Run Cir | 0.20mi | 2/2.0 (-1) | 2,040 (+9%) | 0mo | $340,000 | $167 | 68 |
| 1836 Bramble Brook Ln | 0.31mi | 3/1.0 | 1,746 (-7%) | 2mo | $341,500 | $196 | 67 |
| 1721 Beechbank Way | 0.55mi | 3/3.0 | 1,821 (-3%) | 1mo | $353,000 | $194 | 67 |
| 1876 Oxford Sq | 0.21mi | 3/2.5 | 1,626 (-13%) | 3mo | $363,500 | $224 | 66 |
| 1704 Beechbank Way | 0.55mi | 3/2.5 | 1,740 (-7%) | 1mo | $335,000 | $193 | 62 |
| 1723 Beechbank Way | 0.55mi | 3/2.5 | 1,960 (+5%) | 5mo | $340,000 | $173 | 62 |
Match score weights: distance 35% · size 25% · config 20% · recency 20%. Top-matched comps best support the ARV.
Projected returns pro-forma
-3.0% appreciation · 4.23% rent growth · sell at horizon
- IRR
- -6.7%
- Equity multiple
- 0.75×
- Total profit
- $-19,415
- Equity at exit
- $41,003
- IRR
- 4.4%
- Equity multiple
- 1.34×
- Total profit
- $26,122
- Equity at exit
- $23,777
Cash invested: $77,000 (down + closing). Projections, not guarantees.
Landlord ↔ Tenant lean methodology
- Overall (STATE)
- 27 Tenant-Leaning
- State Maryland
- 27 Tenant-Leaning · D+14
- County
- — inherits STATE
- City
- — inherits STATE
ZIP-level market 21015
- Rents YoY
- 4.2%
- Active inventory
- 166
- Price-to-rent
- 8.0×
Monthly cashflow live
- Estimated rent
- $2,866 medium interval (Pro) →
- Mortgage (P&I)
- −$1,442
- Tax from tax record
- −$245 /mo · $2,939/yr
- Insurance
- −$115
- HOA
- −$125
- Vacancy / Maint / Mgmt
- −$602
- Net cashflow
- $338
Break-even live
Sensitivity live
| Price | -10% $493 | -5% $415 | +0% $338 | +5% $260 | +10% $182 |
|---|---|---|---|---|---|
| Rent | -10% $111 | -5% $224 | +0% $338 | +5% $451 | +10% $564 |
| Rate | -1.0pp $476 | -0.5pp $407 | base $338 | +0.5pp $266 | +1.0pp $194 |
UW: 25.0% down · 7.5% · 30yr · 1.5% tax · 5.0% vac · 8.0% maint · 8.0% mgmt
Financing live
Cash to close
- Down payment
- $68,750
- Closing costs
- $8,250
- Reserves months
- —
- Total cash needed
- —
Loan-product check · same deal, 3 products live
Conventional
25% down · 7.5% · 30yr
- Down + closing
- —
- Monthly P&I
- —
- Monthly cashflow
- —
- DSCR
- —
- Eligible?
- —
Personal DTI + credit; lowest rate.
DSCR
20% down · 8.5% · 30yr
- Down + closing
- —
- Monthly P&I
- —
- Monthly cashflow
- —
- DSCR
- —
- Eligible?
- —
No personal income docs; deal must DSCR.
Hard money
10% down · 12.0% · 12mo
- Down + closing
- —
- Monthly P&I
- —
- Monthly cashflow
- —
- DSCR
- —
- Eligible?
- —
Short-term bridge; refi at stabilization.
Rent comps 2 comps
| Address | Beds | Baths | Sqft | Rent | $/sqft | DOM | Units | Dist |
|---|---|---|---|---|---|---|---|---|
| 2219 Jack Ln Bel Air, MD | 1.0–3.0 | 1.5–3.0 | 1304 | $2,985 | $2.29 | 4d | 18 | 1.19mi |
| 1302 Roman Ridge Way Bel Air, MD | 3.0 | 2.0 | 1456 | $2,250 | $1.55 | 18d | 1 | 1.45mi |
HOA detail
- Monthly dues
- $125 · $1,500/yr
- Likely covers
- water
Listing history 6 events
-
2026-05-21$275,000 Active
-
2001-05-08soldstatus $125,000
-
2001-04-20soldstatus $125,000
-
2001-03-07historical
-
2000-11-03$127,900
-
1992-11-20soldstatus $224,000
ⓘ Source: listings_history table (triggers on properties + properties_extension) + one-shot
backfill from property_details.listing_events for pre-trigger history.
Tax reassessment forecast MD · Partial reset (capped growth)
- Current annual tax
- $2,939 · $245/mo
- Projected year-2 tax
- $2,968 · $247/mo
- Expected delta
- +$29/yr (+$2/mo · 1.0%)
ⓘ Screening estimate from a state-policy table — verify with the county assessor before closing.
Climate risk First Street
- Flood 1/10 Low FEMA zone X (unshaded) · 0% chance over 30 yrs
- Wildfire 3/10 Moderate
- Heat 6/10 Major 7 d/yr ≥105°F today · 15 d/yr by 30 yrs out
- Wind 5/10 Major 24% chance of damaging wind over 30 yrs
- Air quality 3/10 Moderate 3 unhealthy d/yr today · 5 by 30 yrs out
Nearby sold comps map
Loading sold comps map…
Walkable amenities ~0.75 mi
Loading nearby amenities…
Taxation est. · year 1
- Rental income
- $34,392
- − Mortgage interest
- −$15,404
- − Property taxes
- −$2,939
- − Insurance
- −$1,375
- − Repairs & maintenance
- −$2,751
- − Management
- −$2,751
- − HOA
- −$1,500
- − Depreciation
- −$8,000
- Taxable loss
- −$329
- Est. tax savings @ 24.0%
- +$79
- After-tax cash flow
- $4,129/yr
For passive investors: Depreciation is non-cash, so a rental often shows a tax loss while cash-flowing — sheltering income. Rental losses are passive: they offset passive income freely, and up to $25,000/yr can offset ordinary (W-2) income if you actively participate and your MAGI is under $100k (phasing out to $0 by $150k); unused losses carry forward. On sale, claimed depreciation is recaptured at up to 25%, and gains may owe capital-gains tax (a 1031 exchange can defer both). Figures are a year-1 estimate at your 24.0% rate — not tax advice; consult a CPA.
Schools (NCES district)
- District
- Harford County Public Schools
- NCES district ID
- 2400390
- Math proficiency
- 22% ▼ -23.00%
- Reading proficiency
- 39% ▼ -12.00%
- Median HH income
- $79,569
- Composite
- 29.38/100
- National rank
- #6527
- State rank
- #9 of 24 in MD
Livability — Bel Air North
- Score
- 82/100
- State rank
- #35
- US rank
- #1269
Category grades
Schools grade is shown separately in the Schools card above.
Census & demographics
- Census place
- Bel Air North, MD
- County
- Harford County · 198,512 people
- Metro
- Baltimore-Columbia-Towson, MD
- Population (ZIP)
- 30,013
- Household income
- $137,281
- Rent vs Own
- Severe rent burden
- 251.0
Population outlook (Harford County) Hauer SSP2
- Today (2025)
- 262,292 people
- By 2030
- 266,437 · +1.6%
- By 2040
- 269,954 · +2.9%
- By 2050
- 265,659 · +1.3%
- By 2075
- 252,886 · -3.6%
- By 2100
- 224,014 · -14.6%
Race, ethnicity, and origin ACS 2023
- Neighborhood character
- Predominantly White (79%)
- Race & ethnicity
- White 79% Black 7% Two or more races 6% Asian 5% Hispanic / Latino 5%
- Common ancestry
- Romanian 5% Italian 2% Lithuanian 2%
- Foreign-born
- 6% · Canada, Vietnam, China
- Languages at home
- 91% English-only · Spanish 3% Other Indo-European 2% Vietnamese 1%
Political lean MEDSL · Harford
- 2024 margin
- R (+13.8) · D 41.9% · R 55.7% · Other 2.4%
- 2008→2024 swing
- +5.0pp toward D · 2008: -18.8pp · 2024: -13.8pp
- All cycles
- 2024: R+13.8 2020: R+12.0 2016: R+24.5 2012: R+19.5 2008: R+18.8
Not yet ingested
- Civics
- —
Market trends
- HPI YoY
- ▼ -211.26%
- Current HPI
- 251.2512
- Rent YoY
- ▲ 4.23%
- Metro
- Baltimore-Columbia-Towson, MD
- State GDP YoY
- ▲ 2.97%
- F500 in state
- 12
Industry mix (Fortune 500 HQ in MD)
| Industry | F500 HQs | Revenue |
|---|---|---|
| Aerospace / Defense | 1 | $71B |
|
||
| Utilities | 1 | $25B |
|
||
| Hotels | 1 | $24B |
|
||
| Consumer Goods | 1 | $7B |
|
||
| Real Estate | 1 | $6B |
|
||
| Chemicals | 1 | $2B |
|
||
Price history
+22.8% since first listed6 events — show timeline
- 2026-05-21 Listed $275,000 BRIGHT MLS
- 2001-05-08 Sold (Public Records) $125,000 Public Records
- 2001-04-20 Sold (MLS) $125,000 MRIS
- 2001-03-07 Delisted — MRIS
- 2000-11-03 Listed $127,900 MRIS
- 1992-11-20 Sold (Public Records) $224,000 Public Records
Property tax history
+2.0%/yrLatest (2025): $2,939 · +5.0% YoY. Source: county tax records.
Cash-flow waterfall
monthlySold comps — $/sqft
last 12 mo · ≤1 miLoading sold comps…