716 S 2nd St #175 · El Cajon, CA
Flood risk 1/10 · Minimal
- FEMA flood zone
- X (unshaded)
- Chance of flooding over 30 yrs
- 0.0%
- Est. flood insurance / yr
- $507 – $1,088
Fire risk 1/10 · Minimal
- Est. fire insurance / yr
- $659 – $1,223
Heat risk 5/10 · Moderate
- Hot days now (above 99°F)
- 6 days/yr
- Hot days in 30 yrs
- 16 days/yr
Wind risk 1/10 · Minimal
- Chance of severe wind over 30 yrs
- —
Air-quality risk 4/10 · Minor
- Unhealthy air days now
- 6 days/yr
- Unhealthy air days in 30 yrs
- 7 days/yr
Risk factors via First Street. Map © Google.
Why this score? — see what drove the C+ grade
The composite is a weighted blend of 9 inputs, each scored 0–100. Each bar is that input's sub-score; the figure is the points it added to the 100-point composite (weight × sub-score).
- Cash flow +30.0/30.0
- DSCR +10.0/10.0
- 1% rule +9.7/10.0
- Schools +4.0/10.0
- Livability +3.5/5.0
- Condition / age +2.5/5.0
- Rent growth +1.8/5.0
- ARV discount +0.0/15.0
- Appreciation +0.0/10.0
$185,000
🖨 Deal sheet 📄 Offer letter ✓ Due diligence
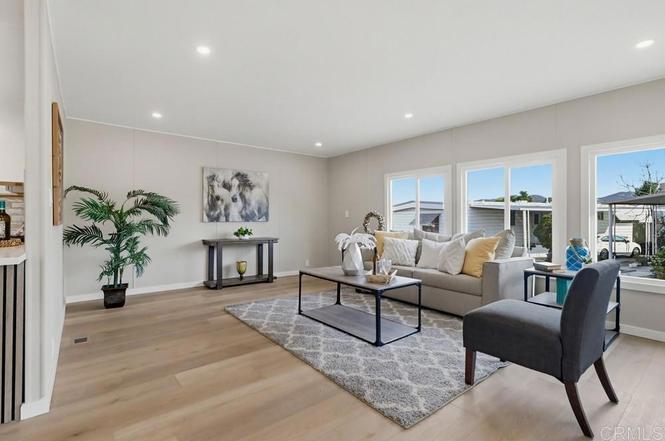
Listing remarks
Fully remodeled 2-bedroom, 2-bath home located in the desirable 55+ community of Lynnwood West Mobile Estates in East County San Diego. This home in El Cajon has been thoughtfully updated to deliver the look and feel of a modern, move-in-ready residence at an exceptional value. Step inside to a bright, fresh interior featuring new flooring, updated windows, a beautifully refreshed kitchen, and renovated bathrooms with stylish finishes throughout. Every detail was carefully selected to create a clean, contemporary feel that’s both comfortable and low maintenance. Located in a well-kept, quiet senior community with convenient access to shopping, dining, and local amenities, this home of
Key facts
- Renovated bathrooms
- Updated windows
- Convenient access
Tags
Property features AI
Finance
- Other: Lot described as 0-1 unit/acre (seller provided lot size information)
- Financial info: Assessments: Unknown (buyer to assume)
- HOA & community: Senior community; Land lease community (land lease amount $1,395)
Exterior
- Parking: 2 parking spaces; 2 carport spaces; Located in Lynnwood West Mobile Estates
- Utilities: Public sewer
- Home design: Mobile home (20' x 60'); Mobile home remains; One story; Has view
- Construction: Year built reported by seller
- Exterior features: In-ground pool (fenced); Community pool; Suburban setting
Interior
- Bedrooms: Main floor bedrooms
- Bathrooms: 2 full bathrooms
- Heating & cooling: Central cooling
- Interior features: Single-level home; Ground-level entry; All bedrooms on main floor; Living room
- Laundry & utility: Laundry inside; Gas and electric dryer hookups
Neighborhood map
What this means for you Summary
Snapshot
- This is a 2-bed/2.0-bath manufactured listed at $185k.
Deal economics
- At list price, monthly cash flow is $864 ($10k/yr) — positive.
- The deal already cash-flows at list — no discount required.
- Meets the 1% rule at list price ($3k rent vs $185k).
- Recommended offer: $163k (12.0% below list) — sets the bar for market timing.
- Cap rate 11.9% vs local median 2.4% in El Cajon — top-decile yield for the area; either an underpriced asset or a hidden risk that comps aren't pricing in. Stress-test before assuming the spread holds.
Location & tenants
- Location reads 70/100 on livability (#230 in CA) — a middle-class / working-renter tenant base. Strengths: amenities A+, commute A+; Watch: health & safety C-, crime D+, cost of living F.
- Grossmont Union High (suburban): math 31% / reading 60% proficiency, ranked #173 of 517 in CA (top 34%) — families likely to look elsewhere, expect single-tenant / working-renter base with shorter leases; only 17% free/reduced lunch — higher-income household profile.
- Market conditions: Rents soft (-2.6%/yr); 137 active listings in the ZIP; 40 comparable units currently listed for rent nearby; rentals leasing fast (median 2d on market — plan ~1-2 weeks tenant-placement turnaround); solid renter incomes; 11,759 units permitted in San Diego County in 2024 (7,244 in 5+ unit buildings).
- This rent runs 32% of the median local income ($102k/yr) — at the standard rent-burdened threshold; future hikes will face affordability resistance.
Forward outlook
- Local home prices are declining (-3.0%/yr); year-one equity from $1k of loan paydown is wiped out by about $6k of value loss. Plan a longer hold.
- San Diego County population projected at +20% by 2050 — long-run rental-demand tailwind backs the buy-and-hold thesis.
- At projected returns (-3.0% appreciation + 0.0% rent growth), your $52k cash investment doubles in ~8 years — after that, you're playing with house money.
Negotiation context
- It's been on market 132 days — a 12% lower offer ($163k) is reasonable based on typical stale-listing flexibility.
Risks & watch-outs
- Climate carrying-cost: extreme-heat days projected 6→16/yr by 2055 (HVAC capex compounding) — expect insurance premiums to compound above CPI over the hold.
Questions for the listing agent
- It's been on market 132 days. Have you received any prior offers? Is the seller open to a 12% concession, seller financing, or rate buy-down credit?
- Built in 1968 — when were the roof, HVAC, electrical panel, plumbing, and water heater last replaced?
- Why hasn't it sold? Are there any deal-killer items the seller is aware of (foundation, flood, title, zoning, code violations)?
- Is there a deadline driving the sale (1031 exchange, divorce, estate, relocation)? That informs how much negotiation room exists.
- Crime grade is D in this area — have there been break-ins, vandalism, or insurance claims at this property in the last 3 years? What carrier currently insures it and at what premium?
- What's the average days-on-market for RENTAL listings here right now (not sales)? A rising rental-DOM trend means longer vacancies and softer asking-rent achievability than the comps imply.
- What's the recent tenant-quality profile in this submarket — average credit score on applications, eviction rate, late-payment / NSF rate, and stable-employment percentage? A property-management company in the area should have these aggregated.
- How much new for-sale + rental construction is in the pipeline within 1–3 miles? Heavy new supply typically softens prices + rents 12–24 months out; constrained supply supports both.
Investment metrics
- 1% rule
- 1.47% ✓
- Cap rate
- 11.90%
- Cash-on-cash
- 20.02%
- DSCR
- 1.89
- GRM
- 5.7
CMA / ARV
- ARV (on-the-fly)
- $129,920
- Comps found
- 7
Show comp detail 7 sales within ~0.75 mi
| Address | Dist | Beds/Ba | Sqft | Sold | Price | $/sf | Match |
|---|---|---|---|---|---|---|---|
| 716 S 2nd St #194 | 0.00mi | 2/2.0 | 1,120 (0%) | 4mo | $125,000 | $112 | 97 |
| 1285 E Washington Ave Spc 29 | 0.12mi | 2/2.0 | 1,167 (+4%) | 5mo | $155,000 | $133 | 83 |
| 410 S 1st. St #175 | 0.57mi | 2/2.0 | 1,080 (-4%) | 8mo | $125,000 | $116 | 61 |
| 410 S 1st St #197 | 0.63mi | 2/2.0 | 1,080 (-4%) | 9mo | $114,000 | $106 | 57 |
| 410 S 1st St Spc 3 | 0.57mi | 2/2.0 | 1,101 (-2%) | 23mo | $160,000 | $145 | 52 |
| 410 S 1st St #81 | 0.57mi | 2/2.0 | 983 (-12%) | 14mo | $146,000 | $149 | 42 |
| 410 S 1st St Spc 26 | 0.63mi | 1/1.0 (-1) | 1,040 (-7%) | 13mo | $79,000 | $76 | 39 |
Match score weights: distance 35% · size 25% · config 20% · recency 20%. Top-matched comps best support the ARV.
Projected returns pro-forma
-3.0% appreciation · 0.0% rent growth · sell at horizon
- IRR
- 8.7%
- Equity multiple
- 1.33×
- Total profit
- $17,154
- Equity at exit
- $27,584
- IRR
- 15.3%
- Equity multiple
- 2.07×
- Total profit
- $55,258
- Equity at exit
- $15,995
Cash invested: $51,800 (down + closing). Projections, not guarantees.
Landlord ↔ Tenant lean methodology
- Overall (STATE)
- 18 Strongly Tenant-Friendly
- State California
- 18 Strongly Tenant-Friendly · D+13
- County
- — inherits STATE
- City
- — inherits STATE
ZIP-level market 92019
- Rents YoY
- -2.6%
- Active inventory
- 137
- Price-to-rent
- 5.7×
Monthly cashflow live
- Estimated rent
- $2,712 high interval (Pro) →
- Mortgage (P&I)
- −$970
- Tax est. 1.5%
- −$231 /mo · $2,775/yr
- Insurance
- −$77
- HOA
- −$0
- Vacancy / Maint / Mgmt
- −$570
- Net cashflow
- $864
Break-even live
UW: 25.0% down · 7.5% · 30yr · 1.5% tax · 5.0% vac · 8.0% maint · 8.0% mgmt
Financing live
Cash to close
- Down payment
- $46,250
- Closing costs
- $5,550
- Reserves months
- —
- Total cash needed
- —
Loan-product check · same deal, 3 products live
Conventional
25% down · 7.5% · 30yr
- Down + closing
- —
- Monthly P&I
- —
- Monthly cashflow
- —
- DSCR
- —
- Eligible?
- —
Personal DTI + credit; lowest rate.
DSCR
20% down · 8.5% · 30yr
- Down + closing
- —
- Monthly P&I
- —
- Monthly cashflow
- —
- DSCR
- —
- Eligible?
- —
No personal income docs; deal must DSCR.
Hard money
10% down · 12.0% · 12mo
- Down + closing
- —
- Monthly P&I
- —
- Monthly cashflow
- —
- DSCR
- —
- Eligible?
- —
Short-term bridge; refi at stabilization.
Rent comps 40 comps
| Address | Beds | Baths | Sqft | Rent | $/sqft | DOM | Units | Dist |
|---|---|---|---|---|---|---|---|---|
| 805 Benny Way El Cajon, CA | 3.0 | 3.0 | 1477 | $4,300 | $2.91 | 2d | 1 | 0.11mi |
| 595 S 2nd St El Cajon, CA | 2.0 | 1.0 | 800 | $2,290 | $2.86 | 1d | 1 | 0.24mi |
| 725 Washington Heights Rd El Cajon, CA | 2.0 | 1.0 | 800 | $2,238 | $2.80 | 1d | 4 | 0.25mi |
| 1380 E Washington Ave Unit 49W El Cajon, CA | 3.0 | 3.0 | 1446 | $3,550 | $2.46 | 7d | 1 | 0.39mi |
| 639 Bighorn Ct El Cajon, CA | 3.0 | 2.0 | 1150 | $4,300 | $3.74 | 1d | 1 | 0.39mi |
| 480 Jamacha Rd El Cajon, CA | 2.0 | 2.0 | 913 | $2,495 | $2.73 | 1d | 1 | 0.47mi |
| 1065 E Washington Ave Apt N El Cajon, CA | 3.0 | 2.0 | 1100 | $2,850 | $2.59 | 17d | 1 | 0.47mi |
| 1065 E Washington Ave El Cajon, CA | 3.0 | 2.0 | 1100 | $2,850 | $2.59 | 1d | 1 | 0.47mi |
| 346 Jamacha Rd El Cajon, CA | 2.0 | 1.0–2.0 | 887 | $2,436 | $2.74 | 1d | 8 | 0.48mi |
| 1137 E Lexington Ave El Cajon, CA | 2.0 | 1.0 | 900 | $1,995 | $2.22 | 1d | 1 | 0.53mi |
| 187 Ballard St El Cajon, CA | 1.0–2.0 | 1.0–2.0 | 542 | $2,150 | $3.97 | 1d | 2 | 0.55mi |
| 1371 E Lexington Ave El Cajon, CA | 2.0 | 1.0 | 850 | $2,060 | $2.42 | 1d | 2 | 0.55mi |
| 291 Jamacha Rd El Cajon, CA | 1.0–2.0 | 1.0 | 825 | $2,095 | $2.54 | 1d | 4 | 0.58mi |
| 257 Jamacha Rd El Cajon, CA | 2.0 | 1.0 | 850 | $2,272 | $2.67 | 1d | 4 | 0.59mi |
| 1041-89 E Lexington Ave El Cajon, CA | 1.0–2.0 | 1.0–2.0 | 838 | $2,425 | $2.89 | 1d | 8 | 0.61mi |
| 975 E Washington Ave Apt E El Cajon, CA | 2.0 | 1.0 | 900 | $2,100 | $2.33 | 21d | 1 | 0.65mi |
| 1037 E Lexington Ave El Cajon, CA | 1.0–3.0 | 1.0–2.0 | 855 | $2,225 | $2.60 | 1d | 5 | 0.68mi |
| 957 E Washington Ave El Cajon, CA | 2.0 | 2.0 | 900 | $2,295 | $2.55 | 1d | 1 | 0.68mi |
| 588 S Anza St El Cajon, CA | 1.0–2.0 | 1.0 | 767 | $2,100 | $2.74 | 1d | 6 | 0.70mi |
| 1536 Gustavo St Unit D El Cajon, CA | 2.0 | 1.0 | 945 | $2,800 | $2.96 | 24d | 1 | 0.71mi |
| 1526 Granite Hills Dr Unit B El Cajon, CA | 3.0 | 3.0 | 1375 | $3,800 | $2.76 | 13d | 1 | 0.72mi |
| 1535 Granite Hills Dr El Cajon, CA | 2.0 | 2.0 | 825 | $2,400 | $2.91 | 1d | 1 | 0.73mi |
| 265 S Anza St El Cajon, CA | 2.0 | 1.0 | 775 | $2,250 | $2.90 | 1d | 1 | 0.75mi |
| 960 E Chase Ave Unit C El Cajon, CA | 2.0 | 2.0 | 813 | $2,100 | $2.58 | 1d | 1 | 0.76mi |
| 758 S Mollison Ave El Cajon, CA | 2.0 | 1.0 | 875 | $1,945 | $2.22 | 1d | 3 | 0.80mi |
| 301 Shady Ln El Cajon, CA | 1.0–2.0 | 1.0 | 720 | $2,250 | $3.12 | 1d | 8 | 0.80mi |
| 421 S Mollison Ave El Cajon, CA | 1.0–2.0 | 1.0 | 726 | $1,900 | $2.62 | 1d | 2 | 0.82mi |
| 602 S Mollison Ave Unit C El Cajon, CA | 2.0 | 2.0 | 1024 | $2,600 | $2.54 | 1d | 1 | 0.82mi |
| 180 N 1st St El Cajon, CA | 1.0–2.0 | 1.0–2.0 | 830 | $2,125 | $2.56 | 1d | 3 | 0.82mi |
| 870 E Chase Ave Unit D El Cajon, CA | 2.0 | 1.0 | 795 | $2,440 | $3.07 | 1d | 1 | 0.87mi |
| 390 S Mollison Ave El Cajon, CA | 1.0 | 1.0 | 750 | $1,725 | $2.30 | 1d | 1 | 0.88mi |
| 277 N 1st St El Cajon, CA | 2.0 | 2.0 | 825 | $2,130 | $2.58 | 1d | 1 | 0.88mi |
| 685 S Lincoln Ave El Cajon, CA | 2.0 | 2.0 | 800 | $2,300 | $2.88 | 1d | 1 | 0.91mi |
| 304 N 1st St El Cajon, CA | 2.0 | 1.0 | 769 | $2,300 | $2.99 | 1d | 1 | 0.92mi |
| 340 N 1st St El Cajon, CA | 2.0 | 1.0 | 751 | $1,980 | $2.64 | 1d | 3 | 0.92mi |
| 422 Shady Ln El Cajon, CA | 1.0–3.0 | 1.0–2.0 | 900 | $2,304 | $2.56 | 1d | 18 | 0.93mi |
| 447 S Lincoln Ave El Cajon, CA | 2.0 | 1.5 | 928 | $2,300 | $2.48 | 1d | 1 | 0.93mi |
| 200 S Mollison Ave El Cajon, CA | 2.0 | 1.0 | 950 | $1,995 | $2.10 | 1d | 1 | 0.94mi |
| 800 E Lexington Ave El Cajon, CA | 2.0–3.0 | 2.0 | 1040 | $2,390 | $2.30 | 1d | 5 | 0.95mi |
| 360 N 1st St El Cajon, CA | 2.0 | 2.0 | 725 | $1,995 | $2.75 | 16d | 1 | 0.96mi |
Listing history 20 events
-
2026-06-18days on market $185,000 Active 132 DOM
-
2026-06-17days on market $185,000 Active 131 DOM
-
2026-06-16days on market $185,000 Active 130 DOM
-
2026-06-15days on market $185,000 Active 129 DOM
-
2026-06-13days on market $185,000 Active 127 DOM
-
2026-06-13days on market $185,000 Active 126 DOM
-
2026-06-09days on market $185,000 Active 123 DOM
-
2026-06-08days on market $185,000 Active 122 DOM
-
2026-06-07days on market $185,000 Active 121 DOM
-
2026-06-04days on market $185,000 Active 118 DOM
-
2026-06-03days on market $185,000 Active 117 DOM
-
2026-06-02days on market $185,000 Active 116 DOM
-
2026-06-01days on market $185,000 Active 115 DOM
-
2026-05-31days on market $185,000 Active 114 DOM
-
2026-05-01price $185,000
-
2026-03-16price $189,900
-
2026-03-03price $199,900
-
2026-02-24price $209,900
-
2026-02-19price $219,900
-
2026-02-06$229,900 Active
ⓘ Source: listings_history table (triggers on properties + properties_extension) + one-shot
backfill from property_details.listing_events for pre-trigger history.
Climate risk First Street
- Flood 1/10 Low FEMA zone X (unshaded) · 0% chance over 30 yrs
- Wildfire 1/10 Low
- Heat 5/10 Major 6 d/yr ≥99°F today · 16 d/yr by 30 yrs out
- Wind 1/10 Low
- Air quality 4/10 Moderate 6 unhealthy d/yr today · 7 by 30 yrs out
Nearby sold comps map
Loading sold comps map…
Walkable amenities ~0.75 mi
Loading nearby amenities…
Taxation est. · year 1
- Rental income
- $32,547
- − Mortgage interest
- −$10,363
- − Property taxes
- −$2,775
- − Insurance
- −$925
- − Repairs & maintenance
- −$2,604
- − Management
- −$2,604
- − Depreciation
- −$5,382
- Taxable income
- $7,895
- Est. tax owed @ 24.0%
- −$1,895
- After-tax cash flow
- $8,475/yr
For passive investors: Depreciation is non-cash, so a rental often shows a tax loss while cash-flowing — sheltering income. Rental losses are passive: they offset passive income freely, and up to $25,000/yr can offset ordinary (W-2) income if you actively participate and your MAGI is under $100k (phasing out to $0 by $150k); unused losses carry forward. On sale, claimed depreciation is recaptured at up to 25%, and gains may owe capital-gains tax (a 1031 exchange can defer both). Figures are a year-1 estimate at your 24.0% rate — not tax advice; consult a CPA.
Schools (NCES district)
- District
- Grossmont Union High
- NCES district ID
- 0616230
- Math proficiency
- 31% ▼ -1.00%
- Reading proficiency
- 60% ▲ 5.00%
- Median HH income
- $61,801
- Composite
- 40.07/100
- National rank
- #3810
- State rank
- #173 of 517 in CA
Livability — El Cajon
- Score
- 70/100
- State rank
- #230
- US rank
- #7531
Category grades
Schools grade is shown separately in the Schools card above.
Census & demographics
- Census place
- El Cajon, CA
- County
- San Diego County · 3,178,799 people
- City population
- 173,694
- Metro
- San Diego-Chula Vista-Carlsbad, CA
- Population (ZIP)
- 45,351
- Household income
- $101,973
- Rent vs Own
- Severe rent burden
- 1897.0
Population outlook (San Diego County) Hauer SSP2
- Today (2025)
- 3,678,185 people
- By 2030
- 3,856,546 · +4.8%
- By 2040
- 4,171,407 · +13.4%
- By 2050
- 4,421,607 · +20.2%
- By 2075
- 4,831,599 · +31.4%
- By 2100
- 4,832,502 · +31.4%
Race, ethnicity, and origin ACS 2023
- Neighborhood character
- Predominantly White (67%)
- Race & ethnicity
- White 67% Hispanic / Latino 21% Two or more races 15% Asian 3% Black 2%
- Hispanic origin (detail)
- Mexican 19%
- Common ancestry
- Arab 6% Romanian 2% Lithuanian 2%
- Foreign-born
- 22% · Canada, China
- Languages at home
- 69% English-only · Spanish 11% Arabic 10% Other Indo-European 1%
Political lean MEDSL · San Diego
- 2024 margin
- D (+16.8) · D 56.9% · R 40.1% · Other 2.9%
- 2008→2024 swing
- +6.6pp toward D · 2008: 10.2pp · 2024: 16.8pp
- All cycles
- 2024: D+16.8 2020: D+22.8 2016: D+17.8 2012: D+5.1 2008: D+10.2
Not yet ingested
- Civics
- —
Market trends
- HPI YoY
- ▼ -553.81%
- Current HPI
- 349.3085
- Rent YoY
- ▼ -2.61%
- Metro
- San Diego-Chula Vista-Carlsbad, CA
- State GDP YoY
- ▲ 3.21%
- F500 in state
- 116
Industry mix (Fortune 500 HQ in CA)
| Industry | F500 HQs | Revenue |
|---|---|---|
| Technology | 27 | $1,492B |
|
||
| Financial Services | 3 | $174B |
|
||
| Retail | 3 | $44B |
|
||
| Insurance | 3 | $26B |
|
||
| Media / Entertainment | 2 | $115B |
|
||
| Pharmaceuticals / Biotech | 2 | $62B |
|
||
Price history
-19.5% since first listed6 events — show timeline
- 2026-05-01 Price Changed $185,000 CRMLS
- 2026-03-16 Price Changed $189,900 CRMLS
- 2026-03-03 Price Changed $199,900 CRMLS
- 2026-02-24 Price Changed $209,900 CRMLS
- 2026-02-19 Price Changed $219,900 CRMLS
- 2026-02-06 Listed $229,900 CRMLS
Cash-flow waterfall
monthlySold comps — $/sqft
last 12 mo · ≤1 miLoading sold comps…