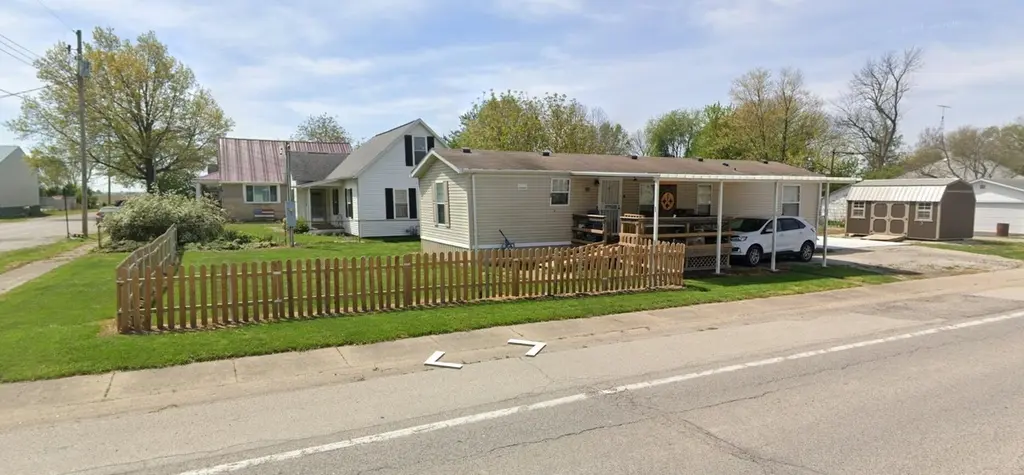
225 Parker St · Bulpitt, IL
Flood risk 1/10 · Minimal
- FEMA flood zone
- X (unshaded)
- Chance of flooding over 30 yrs
- 0.0%
- Est. flood insurance / yr
- $473 – $860
Fire risk 1/10 · Minimal
- Est. fire insurance / yr
- $804 – $1,492
Heat risk 4/10 · Minor
- Hot days now (above 105°F)
- 7 days/yr
- Hot days in 30 yrs
- 20 days/yr
Wind risk 2/10 · Minimal
- Chance of severe wind over 30 yrs
- 2.0%
Air-quality risk 2/10 · Minimal
- Unhealthy air days now
- 0 days/yr
- Unhealthy air days in 30 yrs
- 1 days/yr
Risk factors via First Street. Map © Google.
Why this score? — see what drove the A- grade
The composite is a weighted blend of 9 inputs, each scored 0–100. Each bar is that input's sub-score; the figure is the points it added to the 100-point composite (weight × sub-score).
- Cash flow +29.8/30.0
- ARV discount +15.0/15.0
- DSCR +10.0/10.0
- Appreciation +10.0/10.0
- 1% rule +7.4/10.0
- Livability +3.0/5.0
- Rent growth +2.5/5.0
- Condition / age +2.5/5.0
- Schools +1.8/10.0
$68,500
🖨 Deal sheet 📄 Offer letter ✓ Due diligence
Listing remarks
2006 Manufactured home on property. Well kept. Carport, Fenced in yard, 10 x 16 Newer Shed. 20 x 24 Slab ready for parking or build your garage on. Central Air, water heater, Stove, Microwave, Fridge and Dishwasher all approx 3 years old. Maytag Washer/ Dryer. Insulated crawlspace. Nice school disrict less than 2 miles. Walmart and shopping 6 miles
Key facts
- Insulated crawlspace
- Newer shed
- Fenced in yard
Tags
Neighborhood map
What this means for you Summary
Snapshot
- This is a 2-bed/2.0-bath single-family listed at $68k.
Deal economics
- At list price, monthly cash flow is $251 ($3k/yr) — positive.
- The deal already cash-flows at list — no discount required.
- Meets the 1% rule at list price ($851 rent vs $68k).
- Recommended offer: $62k (9.0% below list) — sets the bar for market timing.
Location & tenants
- Location reads 59/100 on livability (#1,060 in IL) — a working-class tenant base; expect higher turnover. Strengths: cost of living A+, housing A+; Watch: employment C-, schools F, crime D-.
- South Fork SD 14 (rural): math 10% / reading 25% proficiency, ranked #744 of 919 in IL (top 81%) — low school quality limits family demand, transient renter base, plan for 1-2y turnover.
- Market conditions: 18 active listings in the ZIP; 26 units permitted in Christian County in 2024 (0 in 5+ unit buildings).
Forward outlook
- In year one you build about $7k of equity ($474 loan paydown + $7k appreciation (10.0% local appreciation)).
- Christian County population projected at -24% by 2050 — secular population decline; favor cash flow + early exit over multi-decade hold.
- At projected returns (10.0% appreciation + 3.0% rent growth), your $19k cash investment doubles in ~2 years — after that, you're playing with house money.
- By year 5, paydown + projected appreciation supports a ~$34k cash-out refi (75% LTV) — recoverable capital for the next deal without selling this one.
Negotiation context
- It's been on market 93 days — a 9% lower offer ($62k) is reasonable based on typical stale-listing flexibility.
- 4 sale attempts since 16y ago; this cycle's ask is 72% above the opening price — seller raised mid-cycle; expect resistance to lowballs.
- Current owner paid $34k; list at $68k implies a 99% gain — meaningful room to come down on a strong offer.
Questions for the listing agent
- It's been on market 93 days. Have you received any prior offers? Is the seller open to a 9% concession, seller financing, or rate buy-down credit?
- Why hasn't it sold? Are there any deal-killer items the seller is aware of (foundation, flood, title, zoning, code violations)?
- Is there a deadline driving the sale (1031 exchange, divorce, estate, relocation)? That informs how much negotiation room exists.
- Schools are F-rated, which usually means shorter tenancies and higher turnover. Who's the typical renter profile here, and what's been the actual vacancy rate?
- Crime grade is D in this area — have there been break-ins, vandalism, or insurance claims at this property in the last 3 years? What carrier currently insures it and at what premium?
- What's the average days-on-market for RENTAL listings here right now (not sales)? A rising rental-DOM trend means longer vacancies and softer asking-rent achievability than the comps imply.
- What's the recent tenant-quality profile in this submarket — average credit score on applications, eviction rate, late-payment / NSF rate, and stable-employment percentage? A property-management company in the area should have these aggregated.
- How much new for-sale + rental construction is in the pipeline within 1–3 miles? Heavy new supply typically softens prices + rents 12–24 months out; constrained supply supports both.
Investment metrics
- 1% rule
- 1.24% ✓
- Cap rate
- 10.69%
- Cash-on-cash
- 15.70%
- DSCR
- 1.70
- GRM
- 6.7
CMA / ARV
- ARV (median comp)
- $82,194
- List price
- $68,500
- Delta
- -16.66%
- Verdict
- UNDERPRICED
- Comps
- 20 within 1.0 mi
Show comp detail 5 sales within ~0.75 mi
| Address | Dist | Beds/Ba | Sqft | Sold | Price | $/sf | Match |
|---|---|---|---|---|---|---|---|
| 110 Chestnut St | 0.23mi | 2/1.0 | 784 (-12%) | 2mo | $53,000 | $68 | 63 |
| 223 Elm St | 0.41mi | 2/2.0 | 1,018 (+14%) | 6mo | $110,000 | $108 | 53 |
| 319 Walnut St | 0.54mi | 2/1.0 | 948 (+6%) | 10mo | $97,000 | $102 | 53 |
| 403 Oak St | 0.45mi | 1/1.0 (-1) | 784 (-12%) | 7mo | $75,000 | $96 | 43 |
| 760 Broccardo Ct | 0.74mi | 1/1.0 (-1) | 939 (+5%) | 20mo | $212,000 | $226 | 31 |
Match score weights: distance 35% · size 25% · config 20% · recency 20%. Top-matched comps best support the ARV.
Projected returns pro-forma
10.0% appreciation · 3.0% rent growth · sell at horizon
- IRR
- 35.9%
- Equity multiple
- 3.78×
- Total profit
- $53,266
- Equity at exit
- $61,710
- IRR
- 30.9%
- Equity multiple
- 8.52×
- Total profit
- $144,257
- Equity at exit
- $133,080
Cash invested: $19,180 (down + closing). Projections, not guarantees.
Landlord ↔ Tenant lean methodology
- Overall (STATE)
- 43 Moderately Tenant-Leaning
- State Illinois
- 43 Moderately Tenant-Leaning · D+7
- County
- — inherits STATE
- City
- — inherits STATE
ZIP-level market 62863
- Home prices YoY
- 10.9%
- Active inventory
- 18
- Price-to-rent
- 6.7×
Monthly cashflow live
- Estimated rent
- $851 medium interval (Pro) →
- Mortgage (P&I)
- −$359
- Tax from tax record
- −$33 /mo · $401/yr
- Insurance
- −$29
- HOA
- −$0
- Vacancy / Maint / Mgmt
- −$179
- Net cashflow
- $251
Break-even live
UW: 25.0% down · 7.5% · 30yr · 1.5% tax · 5.0% vac · 8.0% maint · 8.0% mgmt
Financing live
Cash to close
- Down payment
- $17,125
- Closing costs
- $2,055
- Reserves months
- —
- Total cash needed
- —
Loan-product check · same deal, 3 products live
Conventional
25% down · 7.5% · 30yr
- Down + closing
- —
- Monthly P&I
- —
- Monthly cashflow
- —
- DSCR
- —
- Eligible?
- —
Personal DTI + credit; lowest rate.
DSCR
20% down · 8.5% · 30yr
- Down + closing
- —
- Monthly P&I
- —
- Monthly cashflow
- —
- DSCR
- —
- Eligible?
- —
No personal income docs; deal must DSCR.
Hard money
10% down · 12.0% · 12mo
- Down + closing
- —
- Monthly P&I
- —
- Monthly cashflow
- —
- DSCR
- —
- Eligible?
- —
Short-term bridge; refi at stabilization.
Listing history 26 events
-
2026-06-18days on market $68,500 Active 93 DOM
-
2026-06-17days on market $68,500 Active 92 DOM
-
2026-06-16days on market $68,500 Active 91 DOM
-
2026-06-15days on market $68,500 Active 90 DOM
-
2026-06-13days on market $68,500 Active 88 DOM
-
2026-06-12days on market $68,500 Active 87 DOM
-
2026-06-09days on market $68,500 Active 84 DOM
-
2026-06-08days on market $68,500 Active 83 DOM
-
2026-06-07days on market $68,500 Active 82 DOM
-
2026-06-05days on market $68,500 Active 80 DOM
-
2026-06-04days on market $68,500 Active 78 DOM
-
2026-06-02days on market $68,500 Active 77 DOM
-
2026-06-01days on market $68,500 Active 76 DOM
-
2026-05-31days on market $68,500 Active 75 DOM
-
2026-05-31days on market $68,500 Active 74 DOM
-
2025-09-11status Active
-
2025-09-11price
-
2025-09-11historical
-
2025-09-11historical
-
2025-09-05status Pending
-
2025-09-04Active
-
2021-12-09soldstatus $34,500
-
2021-10-11$39,900
-
2010-12-15soldstatus $5,500
-
2010-07-15$6,000
-
2000-01-01soldstatus $8,000
ⓘ Source: listings_history table (triggers on properties + properties_extension) + one-shot
backfill from property_details.listing_events for pre-trigger history.
Tax reassessment forecast IL · Partial reset (capped growth)
- Current annual tax
- $401 · $33/mo
- Projected year-2 tax
- $978 · $81/mo
- Expected delta
- +$577/yr (+$48/mo · 144.1%)
ⓘ Screening estimate from a state-policy table — verify with the county assessor before closing.
Climate risk First Street
- Flood 1/10 Low FEMA zone X (unshaded) · 0% chance over 30 yrs
- Wildfire 1/10 Low
- Heat 4/10 Moderate 7 d/yr ≥105°F today · 20 d/yr by 30 yrs out
- Wind 2/10 Low 2% chance of damaging wind over 30 yrs
- Air quality 2/10 Low 0 unhealthy d/yr today · 1 by 30 yrs out
Nearby sold comps map
Loading sold comps map…
Walkable amenities ~0.75 mi
Loading nearby amenities…
Taxation est. · year 1
- Rental income
- $10,208
- − Mortgage interest
- −$3,837
- − Property taxes
- −$401
- − Insurance
- −$342
- − Repairs & maintenance
- −$817
- − Management
- −$817
- − Depreciation
- −$1,993
- Taxable income
- $2,002
- Est. tax owed @ 24.0%
- −$480
- After-tax cash flow
- $2,530/yr
For passive investors: Depreciation is non-cash, so a rental often shows a tax loss while cash-flowing — sheltering income. Rental losses are passive: they offset passive income freely, and up to $25,000/yr can offset ordinary (W-2) income if you actively participate and your MAGI is under $100k (phasing out to $0 by $150k); unused losses carry forward. On sale, claimed depreciation is recaptured at up to 25%, and gains may owe capital-gains tax (a 1031 exchange can defer both). Figures are a year-1 estimate at your 24.0% rate — not tax advice; consult a CPA.
Schools (NCES district)
- District
- South Fork SD 14
- NCES district ID
- 1736640
- Math proficiency
- 10% ▼ -5.00%
- Reading proficiency
- 25% ▲ 5.00%
- Median HH income
- $41,398
- Composite
- 18.34/100
- National rank
- #14054
- State rank
- #744 of 919 in IL
Livability — Bulpitt
- Score
- 59/100
- State rank
- #1060
- US rank
- #20249
Category grades
Schools grade is shown separately in the Schools card above.
Census & demographics
- Census place
- Bulpitt, IL
- Population (ZIP)
- 9,438
Population outlook (Christian County) Hauer SSP2
- Today (2025)
- 31,182 people
- By 2030
- 29,787 · -4.5%
- By 2040
- 26,793 · -14.1%
- By 2050
- 23,757 · -23.8%
- By 2075
- 17,333 · -44.4%
- By 2100
- 11,573 · -62.9%
Race, ethnicity, and origin ACS 2023
- Neighborhood character
- Predominantly White (94%)
- Race & ethnicity
- White 94% Two or more races 3% Hispanic / Latino 2% Asian 1% Black 1%
- Common ancestry
- Lithuanian 2% Slovak 2% Italian 2%
- Foreign-born
- 2% · South Korea, Canada
- Languages at home
- 97% English-only · Spanish 2% Korean 1%
Political lean MEDSL · Christian
- 2024 margin
- Solid R (+46.7) · D 25.9% · R 72.6% · Other 1.5%
- 2008→2024 swing
- -40.4pp toward R · 2008: -6.3pp · 2024: -46.7pp
- All cycles
- 2024: R+46.7 2020: R+44.6 2016: R+42.7 2012: R+23.1 2008: R+6.3
Not yet ingested
- Civics
- —
Market trends
- HPI YoY
- ▲ 27.59%
- Current HPI
- 280.61
- Rent YoY
- —
- Metro
- —
- State GDP YoY
- ▲ 1.59%
- F500 in state
- 60
Industry mix (Fortune 500 HQ in IL)
| Industry | F500 HQs | Revenue |
|---|---|---|
| Insurance | 4 | $201B |
|
||
| Consumer Goods | 4 | $87B |
|
||
| Industrial Machinery | 3 | $64B |
|
||
| Healthcare | 2 | $55B |
|
||
| Retail / Pharmacy | 1 | $148B |
|
||
| Agriculture / Food | 1 | $86B |
|
||
Price history
+331.2% since first listed11 events — show timeline
- 2025-09-11 Relisted — RMLSA as Distributed by MLS Grid
- 2025-09-11 Price Changed — RMLSA as Distributed by MLS Grid
- 2025-09-11 Listing Removed — MRED as Distributed by MLS Grid
- 2025-09-11 Listing Removed — RMLSA as Distributed by MLS Grid
- 2025-09-05 Pending — RMLSA as Distributed by MLS Grid
- 2025-09-04 Listed — RMLSA as Distributed by MLS Grid
- 2021-12-09 Sold (MLS) $34,500 RMLSA as Distributed by MLS Grid
- 2021-10-11 Listed $39,900 RMLSA as Distributed by MLS Grid
- 2010-12-15 Sold (MLS) $5,500 RMLSA as Distributed by MLS Grid
- 2010-07-15 Listed $6,000 RMLSA as Distributed by MLS Grid
- 2000-01-01 Sold (Public Records) $8,000 Public Records
Property tax history
+13.4%/yrLatest (2024): $401 · +133.1% YoY. Source: county tax records.
Cash-flow waterfall
monthlySold comps — $/sqft
last 12 mo · ≤1 miLoading sold comps…