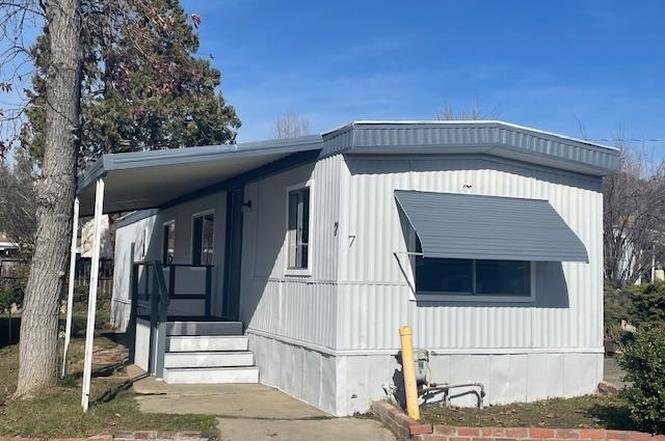
14610 Mono Way #7 · East Sonora, CA
Flood risk 1/10 · Minimal
- FEMA flood zone
- X (unshaded)
- Chance of flooding over 30 yrs
- 0.0%
- Est. flood insurance / yr
- $507 – $1,088
Fire risk 8/10 · Major
- Est. fire insurance / yr
- $659 – $1,223
Heat risk 5/10 · Moderate
- Hot days now (above 99°F)
- 7 days/yr
- Hot days in 30 yrs
- 17 days/yr
Wind risk 1/10 · Minimal
- Chance of severe wind over 30 yrs
- —
Air-quality risk 10/10 · Severe
- Unhealthy air days now
- 29 days/yr
- Unhealthy air days in 30 yrs
- 33 days/yr
Risk factors via First Street. Map © Google.
Why this score? — see what drove the D- grade
The composite is a weighted blend of 9 inputs, each scored 0–100. Each bar is that input's sub-score; the figure is the points it added to the 100-point composite (weight × sub-score).
- Cash flow +15.0/30.0
- 1% rule +5.0/10.0
- DSCR +5.0/10.0
- Livability +3.1/5.0
- Schools +3.0/10.0
- Rent growth +2.5/5.0
- Condition / age +2.5/5.0
- ARV discount +0.0/15.0
- Appreciation +0.0/10.0
$34,900
🖨 Deal sheet (PDF) 📄 Offer letter ✓ Due diligence
Listing remarks
Remodeled 2 bedroom, 1 bath single wide mobile in senior park. Conveniently located near shopping and entertainment. New: flooring, paint, appliances, HVAC unit and more. Park has a community pool and clubhouse. Please call or text me for a showing appointment today.
Key facts
- Remodeled
- Clubhouse
- Community pool
Tags
Property features AI
Finance
- HOA & community: Park: Tamarron Mobile Estates; Senior community; Clubhouse; Community pool (in-ground, no heat); Pets allowed with approvals and limits (cats and dogs OK); On-site laundry
Exterior
- Parking: Carport
- Utilities: Water/sewer/power details not specified
- Home design: Manufactured in park (mobile home); Single wide
- Construction: Aluminum siding; Approximately 720 square feet living area
- Exterior features: No yard; Level lot
Interior
- Kitchen: Built-in range; Range/oven (built-in); Refrigerator; Garbage disposal
- Bedrooms: 2 bedrooms
- Flooring: Vinyl flooring; Carpet
- Bathrooms: 1 full bathroom
- Heating & cooling: Propane central heating; Evaporative cooling
- Interior features: No additional rooms
- Laundry & utility: Community laundry available; Gas water heater
Neighborhood map
What this means for you Summary
Snapshot
- This is a 2-bed/1.0-bath manufactured listed at $35k.
Deal economics
- At list price, monthly cash flow is $1k ($12k/yr) — positive.
- The deal already cash-flows at list — no discount required.
- Meets the 1% rule at list price ($2k rent vs $35k).
- Recommended offer: $31k (12.0% below list) — sets the bar for market timing.
Location & tenants
- Location reads 62/100 on livability (#501 in CA) — a middle-class / working-renter tenant base. Strengths: crime A-, health & safety A-; Watch: amenities F, commute F, cost of living F.
- Curtis Creek Elementary (rural): math 29% / reading 39% proficiency, ranked #278 of 517 in CA (top 54%) — families likely to look elsewhere, expect single-tenant / working-renter base with shorter leases.
- Zoned schools: Curtis Creek Elementary (math 29% / reading 39%, grade F, #755 of 1,571 statewide, top 49%, 440 students, 54% FRL); Sonora High (math 27% / reading 67%, grade D-, #389 of 1,170 statewide, top 35%, 919 students, 36% FRL) — zoned schools at 45% FRL track the district average.
- Market conditions: 301 active listings in the ZIP; 60 units permitted in Tuolumne County in 2024 (0 in 5+ unit buildings).
Forward outlook
- Local home prices are declining (-3.0%/yr); year-one equity from $241 of loan paydown is wiped out by about $1k of value loss. Plan a longer hold.
- Tuolumne County population projected at -15% by 2050 — secular population decline; favor cash flow + early exit over multi-decade hold.
- At projected returns (-3.0% appreciation + 3.0% rent growth), your $10k cash investment doubles in ~1 year — after that, you're playing with house money.
Negotiation context
- It's been on market 141 days — a 12% lower offer ($31k) is reasonable based on typical stale-listing flexibility.
Risks & watch-outs
- Climate carrying-cost: severe wildfire risk; extreme-heat days projected 7→17/yr by 2055 (HVAC capex compounding) — expect insurance premiums to compound above CPI over the hold.
Questions for the listing agent
- It's been on market 141 days. Have you received any prior offers? Is the seller open to a 12% concession, seller financing, or rate buy-down credit?
- Built in 1961 — when were the roof, HVAC, electrical panel, plumbing, and water heater last replaced?
- Why hasn't it sold? Are there any deal-killer items the seller is aware of (foundation, flood, title, zoning, code violations)?
- Is there a deadline driving the sale (1031 exchange, divorce, estate, relocation)? That informs how much negotiation room exists.
- Schools are D-rated, which usually means shorter tenancies and higher turnover. Who's the typical renter profile here, and what's been the actual vacancy rate?
- The area grade is low — what's the realistic commute time and amenity access for the typical tenant pool here? Any planned neighborhood developments (good or bad) we should know about?
- What's the average days-on-market for RENTAL listings here right now (not sales)? A rising rental-DOM trend means longer vacancies and softer asking-rent achievability than the comps imply.
- What's the recent tenant-quality profile in this submarket — average credit score on applications, eviction rate, late-payment / NSF rate, and stable-employment percentage? A property-management company in the area should have these aggregated.
- How much new for-sale + rental construction is in the pipeline within 1–3 miles? Heavy new supply typically softens prices + rents 12–24 months out; constrained supply supports both.
Investment metrics
- 1% rule
- 4.64% ✓
- Cap rate
- 41.98%
- Cash-on-cash
- 127.45%
- DSCR
- 6.67
- GRM
- 1.8
CMA / ARV
- ARV (on-the-fly)
- $26,000
- Comps found
- 1
Show comp detail 1 sale within ~0.75 mi
| Address | Dist | Beds/Ba | Sqft | Sold | Price | $/sf | Match |
|---|---|---|---|---|---|---|---|
| 14610 Mono Way #37 | 0.00mi | 2/2.0 | 1,000 (-4%) | 14mo | $25,000 | $25 | 78 |
Match score weights: distance 35% · size 25% · config 20% · recency 20%. Top-matched comps best support the ARV.
Projected returns pro-forma
-3.0% appreciation · 3.0% rent growth · sell at horizon
- IRR
- —
- Equity multiple
- 7.19×
- Total profit
- $60,469
- Equity at exit
- $5,204
- IRR
- —
- Equity multiple
- 15.11×
- Total profit
- $137,869
- Equity at exit
- $3,018
Cash invested: $9,772 (down + closing). Projections, not guarantees.
Landlord ↔ Tenant lean methodology
- Overall (STATE)
- 18 Strongly Tenant-Friendly
- State California
- 18 Strongly Tenant-Friendly · D+13
- County
- — inherits STATE
- City
- — inherits STATE
ZIP-level market 95370
- Active inventory
- 301
- Price-to-rent
- 1.8×
Monthly cashflow live
- Estimated rent
- $1,619 medium interval (Pro) →
- Mortgage (P&I)
- −$183
- Tax est. 1.5%
- −$44 /mo · $524/yr
- Insurance
- −$15
- HOA
- −$0
- Vacancy / Maint / Mgmt
- −$340
- Net cashflow
- $1,038
Break-even live
Sensitivity live
| Price | -10% $1,062 | -5% $1,050 | +0% $1,038 | +5% $1,026 | +10% $1,014 |
|---|---|---|---|---|---|
| Rent | -10% $910 | -5% $974 | +0% $1,038 | +5% $1,102 | +10% $1,166 |
| Rate | -1.0pp $1,055 | -0.5pp $1,047 | base $1,038 | +0.5pp $1,029 | +1.0pp $1,020 |
UW: 25.0% down · 7.5% · 30yr · 1.5% tax · 5.0% vac · 8.0% maint · 8.0% mgmt
Financing live
Cash to close
- Down payment
- $8,725
- Closing costs
- $1,047
- Reserves months
- —
- Total cash needed
- —
Loan-product check · same deal, 3 products live
Conventional
25% down · 7.5% · 30yr
- Down + closing
- —
- Monthly P&I
- —
- Monthly cashflow
- —
- DSCR
- —
- Eligible?
- —
Personal DTI + credit; lowest rate.
DSCR
20% down · 8.5% · 30yr
- Down + closing
- —
- Monthly P&I
- —
- Monthly cashflow
- —
- DSCR
- —
- Eligible?
- —
No personal income docs; deal must DSCR.
Hard money
10% down · 12.0% · 12mo
- Down + closing
- —
- Monthly P&I
- —
- Monthly cashflow
- —
- DSCR
- —
- Eligible?
- —
Short-term bridge; refi at stabilization.
Listing history 21 events
-
2026-06-21days on market $34,900 Active 141 DOM
-
2026-06-19days on market $34,900 Active 139 DOM
-
2026-06-18days on market $34,900 Active 138 DOM
-
2026-06-17days on market $34,900 Active 137 DOM
-
2026-06-16days on market $34,900 Active 136 DOM
-
2026-06-15days on market $34,900 Active 135 DOM
-
2026-06-14days on market $34,900 Active 133 DOM
-
2026-06-12days on market $34,900 Active 132 DOM
-
2026-06-10days on market $34,900 Active 130 DOM
-
2026-06-09days on market $34,900 Active 129 DOM
-
2026-06-08days on market $34,900 Active 128 DOM
-
2026-06-07days on market $34,900 Active 127 DOM
-
2026-06-05days on market $34,900 Active 125 DOM
-
2026-06-05pricedays on market $34,900 Active 124 DOM
-
2026-06-03days on market $37,900 Active 123 DOM
-
2026-06-02days on market $37,900 Active 122 DOM
-
2026-06-01days on market $37,900 Active 121 DOM
-
2026-05-31days on market $37,900 Active 120 DOM
-
2026-05-30days on market $37,900 Active 119 DOM
-
2026-03-27price $37,900
-
2026-02-01$39,500 Active
ⓘ Source: listings_history table (triggers on properties + properties_extension) + one-shot
backfill from property_details.listing_events for pre-trigger history.
Climate risk First Street
- Flood 1/10 Low FEMA zone X (unshaded) · 0% chance over 30 yrs
- Wildfire 8/10 Severe
- Heat 5/10 Major 7 d/yr ≥99°F today · 17 d/yr by 30 yrs out
- Wind 1/10 Low
- Air quality 10/10 Extreme 29 unhealthy d/yr today · 33 by 30 yrs out
Nearby sold comps map
Loading sold comps map…
Walkable amenities ~0.75 mi
Loading nearby amenities…
Taxation est. · year 1
- Rental income
- $19,428
- − Mortgage interest
- −$1,955
- − Property taxes
- −$524
- − Insurance
- −$174
- − Repairs & maintenance
- −$1,554
- − Management
- −$1,554
- − Depreciation
- −$1,015
- Taxable income
- $12,651
- Est. tax owed @ 24.0%
- −$3,036
- After-tax cash flow
- $9,418/yr
For passive investors: Depreciation is non-cash, so a rental often shows a tax loss while cash-flowing — sheltering income. Rental losses are passive: they offset passive income freely, and up to $25,000/yr can offset ordinary (W-2) income if you actively participate and your MAGI is under $100k (phasing out to $0 by $150k); unused losses carry forward. On sale, claimed depreciation is recaptured at up to 25%, and gains may owe capital-gains tax (a 1031 exchange can defer both). Figures are a year-1 estimate at your 24.0% rate — not tax advice; consult a CPA.
Schools (NCES district)
- District
- Curtis Creek Elementary
- NCES district ID
- 0610320
- Math proficiency
- 29% ▼ -7.00%
- Reading proficiency
- 39% ▼ -9.00%
- Median HH income
- $54,986
- Composite
- 29.96/100
- National rank
- #6372
- State rank
- #278 of 517 in CA
Livability — East Sonora
- Score
- 62/100
- State rank
- #501
- US rank
- #17006
Category grades
Schools grade is shown separately in the Schools card above.
Census & demographics
- Census place
- East Sonora, CA
- City population
- 28,373
- Population (ZIP)
- 28,373
Population outlook (Tuolumne County) Hauer SSP2
- Today (2025)
- 50,349 people
- By 2030
- 48,708 · -3.3%
- By 2040
- 45,284 · -10.1%
- By 2050
- 42,575 · -15.4%
- By 2075
- 36,827 · -26.9%
- By 2100
- 30,369 · -39.7%
Race, ethnicity, and origin ACS 2023
- Neighborhood character
- Predominantly White (82%)
- Race & ethnicity
- White 82% Hispanic / Latino 11% Two or more races 9% Asian 1% Native American 1%
- Hispanic origin (detail)
- Mexican 7% Puerto Rican 1%
- Common ancestry
- Italian 5% Russian 4% Slovak 3%
- Foreign-born
- 5% · Canada
- Languages at home
- 95% English-only · Spanish 3%
Political lean MEDSL · Tuolumne
- 2024 margin
- Strong R (+21.9) · D 37.9% · R 59.7% · Other 2.4%
- 2008→2024 swing
- -9.2pp toward R · 2008: -12.7pp · 2024: -21.9pp
- All cycles
- 2024: R+21.9 2020: R+18.8 2016: R+20.9 2012: R+15.9 2008: R+12.7
Not yet ingested
- Civics
- —
Market trends
- HPI YoY
- ▼ -322.67%
- Current HPI
- 130.9637
- Rent YoY
- —
- Metro
- —
- State GDP YoY
- ▲ 3.21%
- F500 in state
- 116
Industry mix (Fortune 500 HQ in CA)
| Industry | F500 HQs | Revenue |
|---|---|---|
| Technology | 27 | $1,492B |
|
||
| Financial Services | 3 | $174B |
|
||
| Retail | 3 | $44B |
|
||
| Insurance | 3 | $26B |
|
||
| Media / Entertainment | 2 | $115B |
|
||
| Pharmaceuticals / Biotech | 2 | $62B |
|
||
Price history
-4.1% since first listed2 events — show timeline
- 2026-03-27 Price Changed $37,900 bridgeMLS, Bay East AOR, or Contra Costa AOR
- 2026-02-01 Listed $39,500 bridgeMLS, Bay East AOR, or Contra Costa AOR
Property tax history
+0.1%/yrLatest (2025): $57 · -0.2% YoY. Source: county tax records.
Cash-flow waterfall
monthlySold comps — $/sqft
last 12 mo · ≤1 miLoading sold comps…