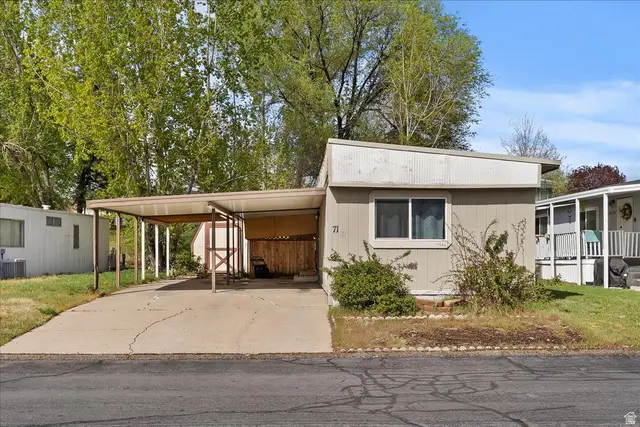
2600 N Hill Field Rd #71 · Layton, UT
Flood risk 1/10 · Minimal
- FEMA flood zone
- X (unshaded)
- Chance of flooding over 30 yrs
- 0.0%
- Est. flood insurance / yr
- $507 – $1,088
Fire risk 5/10 · Moderate
- Est. fire insurance / yr
- $453 – $841
Heat risk 4/10 · Minor
- Hot days now (above 93°F)
- 7 days/yr
- Hot days in 30 yrs
- 17 days/yr
Wind risk 1/10 · Minimal
- Chance of severe wind over 30 yrs
- —
Air-quality risk 4/10 · Minor
- Unhealthy air days now
- 5 days/yr
- Unhealthy air days in 30 yrs
- 7 days/yr
Risk factors via First Street. Map © Google.
Why this score? — see what drove the D grade
The composite is a weighted blend of 9 inputs, each scored 0–100. Each bar is that input's sub-score; the figure is the points it added to the 100-point composite (weight × sub-score).
- 1% rule +10.0/10.0
- Cash flow +7.6/30.0
- ARV discount +7.5/15.0
- Livability +4.3/5.0
- Schools +4.1/10.0
- Rent growth +2.8/5.0
- Condition / age +2.2/5.0
- DSCR +1.7/10.0
- Appreciation +0.0/10.0
$59,900
🖨 Deal sheet 📄 Offer letter ✓ Due diligence
Listing remarks MLS
There are no remarks available.
Key facts
- Washer and dryer
- Well-kept park
- 4,356 sq ft lot
Tags
Property features AI
Finance
- HOA & community: Homeowners association: Lakeview Estates; Monthly association fee; Association fees include trash and water; Community amenities: clubhouse, RV parking, management, pet rules (pets permitted), picnic area, playground, snow removal, trash, water
Exterior
- Parking: Covered carport with 2 spaces; Total of 2 parking spaces; Common RV parking available
- Utilities: Natural gas connected; Electricity connected; Sewer connected; Culinary water connected
- Home design: Mobile home (single level living); Faces south; Residential use; Has view
- Construction: Clapboard/Masonite siding; Asphalt roof; Built/standing condition
- Exterior features: Covered deck; Covered entry/foyer; Storage shed(s); Paved road access; Mountain view; Landscaped
Interior
- Kitchen: Range/oven (free-standing); Refrigerator
- Bedrooms: Three main-level bedrooms; Primary bedroom on first floor
- Flooring: Carpet; Laminate
- Bathrooms: One full bathroom; One partial/half bathroom
- Heating & cooling: Central gas heating; Evaporative cooling
- Interior features: Primary bath with separate tub and shower; Disposal; Standard free-standing range/oven; Part window treatments
- Laundry & utility: Washer; Dryer
Neighborhood map
What this means for you Summary
Snapshot
- This is a 3-bed/1.5-bath manufactured listed at $60k. Condition is rated fair.
Deal economics
- At list price, monthly cash flow is $-71 ($-855/yr) — negative.
- To cash-flow at today's rent, offer at most $50k (17.2% below list).
- Meets the 1% rule at list price ($2k rent vs $60k).
- Recommended offer: $50k (17.2% below list) — sets the bar for cash-flow.
Location & tenants
- Location reads 86/100 on livability (#11 in UT, #457 nationally) — a professional / high-income tenant draw. Strengths: commute A+, employment A+, housing A+.
- Davis District (suburban): math 43% / reading 47% proficiency, ranked #28 of 80 in UT (top 35%) — families likely to look elsewhere, expect single-tenant / working-renter base with shorter leases; only 19% free/reduced lunch — higher-income household profile.
- Zoned schools: Lincoln School (math 13% / reading 16%, grade F, #559 of 585 statewide, top 96%, 703 students, 42% FRL); North Layton Jr High (math 39% / reading 40%, grade F, #75 of 138 statewide, top 56%, 1,009 students, 30% FRL); Northridge High (math 24% / reading 43%, grade F, #106 of 171 statewide, top 62%, 1,954 students, 23% FRL).
- Zoned-school proficiency averages 29% at this address vs 45% district-wide (-16 pts) — the specific schools serving this property underperform the Davis District average; the district grade overstates school quality for this exact location.
- Market conditions: Rents rising (+1.3%/yr); 342 active listings in the ZIP; 16 comparable units currently listed for rent nearby; rentals at typical pace (median 14d on market — plan ~3-4 weeks tenant-placement turnaround); solid renter incomes; 1,461 units permitted in Davis County in 2024 (508 in 5+ unit buildings).
Forward outlook
- Local home prices are declining (-3.0%/yr); year-one equity from $414 of loan paydown is wiped out by about $2k of value loss. Plan a longer hold.
- Davis County population projected at +39% by 2050 — long-run rental-demand tailwind backs the buy-and-hold thesis.
Negotiation context
- It's been on market 72 days — a 6% lower offer ($56k) is reasonable based on typical stale-listing flexibility.
- 4 sale attempts since 5y ago with the ask held roughly flat each time — persistent listings suggest the price (not the market) is what's stuck; bring a comps-based counter.
Risks & watch-outs
- Watch-outs: HOA is 59% of rent.
- Climate carrying-cost: moderate wildfire risk — expect insurance premiums to compound above CPI over the hold.
Questions for the listing agent
- What do current leases actually rent for vs. the listed asking? Can we see a recent rent roll and the last 12 months of T-12 income?
- It's been on market 72 days. Have you received any prior offers? Is the seller open to a 17% concession, seller financing, or rate buy-down credit?
- Have any recent inspections been done? Can we get a copy of the seller's disclosures and any deferred-maintenance estimates?
- Built in 1975 — when were the roof, HVAC, electrical panel, plumbing, and water heater last replaced?
- What does the HOA fee cover, when was the last increase, and are there any pending special assessments or reserve-fund shortfalls?
- Why hasn't it sold? Are there any deal-killer items the seller is aware of (foundation, flood, title, zoning, code violations)?
- Is there a deadline driving the sale (1031 exchange, divorce, estate, relocation)? That informs how much negotiation room exists.
- Schools are B-rated — typically a magnet for longer-tenancy family renters. What's the average tenant stay here, and is there a school-zone premium baked into asking?
- The area grade is low — what's the realistic commute time and amenity access for the typical tenant pool here? Any planned neighborhood developments (good or bad) we should know about?
- What's the average days-on-market for RENTAL listings here right now (not sales)? A rising rental-DOM trend means longer vacancies and softer asking-rent achievability than the comps imply.
- What's the recent tenant-quality profile in this submarket — average credit score on applications, eviction rate, late-payment / NSF rate, and stable-employment percentage? A property-management company in the area should have these aggregated.
- How much new for-sale + rental construction is in the pipeline within 1–3 miles? Heavy new supply typically softens prices + rents 12–24 months out; constrained supply supports both.
Investment metrics
- 1% rule
- 2.89% ✓
- Cap rate
- 4.86%
- Cash-on-cash
- -5.10%
- DSCR
- 0.77
- GRM
- 2.9
CMA / ARV
No comps found within radius.
Projected returns pro-forma
-3.0% appreciation · 1.3% rent growth · sell at horizon
- IRR
- -31.3%
- Equity multiple
- 0.02×
- Total profit
- $-16,499
- Equity at exit
- $8,931
- IRR
- -85.4%
- Equity multiple
- -0.73×
- Total profit
- $-29,084
- Equity at exit
- $5,179
Cash invested: $16,772 (down + closing). Projections, not guarantees.
Landlord ↔ Tenant lean methodology
- Overall (STATE)
- 86 Strongly Landlord-Friendly
- State Utah
- 86 Strongly Landlord-Friendly · R+15
- County
- — inherits STATE
- City
- — inherits STATE
ZIP-level market 84041
- Rents YoY
- 1.3%
- Active inventory
- 342
- Price-to-rent
- 2.9×
Monthly cashflow live
- Estimated rent
- $1,729 high interval (Pro) →
- Mortgage (P&I)
- −$314
- Tax est. 1.5%
- −$75 /mo · $898/yr
- Insurance
- −$25
- HOA
- −$1,023
- Vacancy / Maint / Mgmt
- −$363
- Net cashflow
- $-71
Break-even live
UW: 25.0% down · 7.5% · 30yr · 1.5% tax · 5.0% vac · 8.0% maint · 8.0% mgmt
Financing live
Cash to close
- Down payment
- $14,975
- Closing costs
- $1,797
- Reserves months
- —
- Total cash needed
- —
Loan-product check · same deal, 3 products live
Conventional
25% down · 7.5% · 30yr
- Down + closing
- —
- Monthly P&I
- —
- Monthly cashflow
- —
- DSCR
- —
- Eligible?
- —
Personal DTI + credit; lowest rate.
DSCR
20% down · 8.5% · 30yr
- Down + closing
- —
- Monthly P&I
- —
- Monthly cashflow
- —
- DSCR
- —
- Eligible?
- —
No personal income docs; deal must DSCR.
Hard money
10% down · 12.0% · 12mo
- Down + closing
- —
- Monthly P&I
- —
- Monthly cashflow
- —
- DSCR
- —
- Eligible?
- —
Short-term bridge; refi at stabilization.
Rent comps 16 comps
| Address | Beds | Baths | Sqft | Rent | $/sqft | DOM | Units | Dist |
|---|---|---|---|---|---|---|---|---|
| 2525 N Hill Field Rd Layton, UT | 2.0 | 1.0 | 775 | $1,659 | $2.14 | 23d | 1 | 0.16mi |
| 2955 N 400 W Layton, UT | 2.0 | 1.0 | 581 | $1,417 | $2.44 | 14d | 45 | 0.40mi |
| 1814 N 700 W Layton, UT | 1.0–2.0 | 1.0–2.0 | 838 | $1,734 | $2.07 | 14d | 10 | 0.90mi |
| 1656 N 400 W Layton, UT | 1.0–2.0 | 1.0–1.5 | 848 | $1,584 | $1.87 | 14d | 10 | 0.96mi |
| 1100 S 2000 E Clearfield, UT | 1.0–3.0 | 1.0–2.0 | 895 | $1,952 | $2.18 | 13d | 32 | 1.04mi |
| 1300 S 1800 E Clearfield, UT | 1.0–3.0 | 1.0–2.0 | 1113 | $2,197 | $1.97 | 14d | 20 | 1.06mi |
| 1902 E 700 S Clearfield, UT | 1.0–3.0 | 1.0–2.0 | 1085 | $2,415 | $2.23 | 14d | 21 | 1.14mi |
| 540 W 1425 N Layton, UT | 1.0–2.0 | 1.0–2.0 | 600 | $1,475 | $2.46 | 13d | 8 | 1.22mi |
| 1200 S 1500 E Clearfield, UT | 1.0–2.0 | 1.0 | 815 | $1,260 | $1.55 | 14d | 18 | 1.24mi |
| 1428 W 1650 N Layton, UT | 2.0 | 1.5 | 1000 | $1,350 | $1.35 | 23d | 1 | 1.35mi |
| 1448 W 1650 N Unit 3 Layton, UT | 2.0 | 1.0 | 819 | $1,120 | $1.37 | 14d | 1 | 1.38mi |
| 1737 N 1450 W Layton, UT | 2.0 | 1.0 | 750 | $1,250 | $1.67 | 23d | 1 | 1.38mi |
| 1600 N 1575 W Layton, UT | 1.0–2.0 | 1.0–2.0 | 842 | $1,800 | $2.14 | 14d | 8 | 1.41mi |
| 900 S 1500 E Clearfield, UT | 1.0–3.0 | 1.0–2.5 | 1175 | $1,855 | $1.58 | 13d | 7 | 1.43mi |
| 1505 N Angel St Layton, UT | 2.0 | 1.5 | 1100 | $1,417 | $1.29 | 14d | 3 | 1.45mi |
| 1560 N Main St Layton, UT | 1.0–2.0 | 1.0–2.0 | 1125 | $1,400 | $1.24 | 23d | 8 | 1.50mi |
HOA detail
- Monthly dues
- $1,023 · $12,276/yr
Listing history 28 events
-
2026-06-18days on market $59,900 Active 72 DOM
-
2026-06-17days on market $59,900 Active 71 DOM
-
2026-06-16days on market $59,900 Active 70 DOM
-
2026-06-15days on market $59,900 Active 69 DOM
-
2026-06-14days on market $59,900 Active 67 DOM
-
2026-06-13days on market $59,900 Active 66 DOM
-
2026-06-10days on market $59,900 Active 64 DOM
-
2026-06-09days on market $59,900 Active 63 DOM
-
2026-06-08days on market $59,900 Active 62 DOM
-
2026-06-07days on market $59,900 Active 61 DOM
-
2026-06-05days on market $59,900 Active 58 DOM
-
2026-06-03days on market $59,900 Active 57 DOM
-
2026-06-02days on market $59,900 Active 56 DOM
-
2026-06-01days on market $59,900 Active 55 DOM
-
2026-05-31days on market $59,900 Active 54 DOM
-
2026-05-31days on market $59,900 Active 53 DOM
-
2026-04-08price $59,900
-
2026-04-07$59,500 Active
-
2023-05-24soldstatus Closed 31-char remark
Show marketing remark (31 chars)
There are no remarks available.
-
2023-04-25status Under Contract 31-char remark
Show marketing remark (31 chars)
There are no remarks available.
-
2023-04-18historical Backup 31-char remark
Show marketing remark (31 chars)
There are no remarks available.
-
2023-04-05status Under Contract 31-char remark
Show marketing remark (31 chars)
There are no remarks available.
-
2023-03-16$55,000 Active 31-char remark
Show marketing remark (31 chars)
There are no remarks available.
-
2022-01-04historical
-
2021-11-02price $50,000
-
2021-09-17status Active
-
2021-09-13historical
-
2021-09-03$65,000
ⓘ Source: listings_history table (triggers on properties + properties_extension) + one-shot
backfill from property_details.listing_events for pre-trigger history.
Climate risk First Street
- Flood 1/10 Low FEMA zone X (unshaded) · 0% chance over 30 yrs
- Wildfire 5/10 Major
- Heat 4/10 Moderate 7 d/yr ≥93°F today · 17 d/yr by 30 yrs out
- Wind 1/10 Low
- Air quality 4/10 Moderate 5 unhealthy d/yr today · 7 by 30 yrs out
Nearby sold comps map
Loading sold comps map…
Walkable amenities ~0.75 mi
Loading nearby amenities…
Taxation est. · year 1
- Rental income
- $20,744
- − Mortgage interest
- −$3,355
- − Property taxes
- −$898
- − Insurance
- −$300
- − Repairs & maintenance
- −$1,660
- − Management
- −$1,660
- − HOA
- −$12,276
- − Depreciation
- −$1,743
- Taxable loss
- −$1,147
- Est. tax savings @ 24.0%
- +$275
- After-tax cash flow
- $-580/yr
For passive investors: Depreciation is non-cash, so a rental often shows a tax loss while cash-flowing — sheltering income. Rental losses are passive: they offset passive income freely, and up to $25,000/yr can offset ordinary (W-2) income if you actively participate and your MAGI is under $100k (phasing out to $0 by $150k); unused losses carry forward. On sale, claimed depreciation is recaptured at up to 25%, and gains may owe capital-gains tax (a 1031 exchange can defer both). Figures are a year-1 estimate at your 24.0% rate — not tax advice; consult a CPA.
Condition & rehab AI · 12 photos
This mobile home requires moderate repairs to its exterior and kitchen, but has a good interior and floor plan. Upgrades to the exterior and kitchen would significantly increase its value.
Repairs flagged
- Major exterior siding — Significant wear and peeling
- Major exterior paint — Peeling and faded
Value-add opportunities
- Both paint exterior siding and paint — Enhances curb appeal and value
- Both replace kitchen appliances — Modernizes the space and increases appeal
Renovation cost estimate screening
| Repair item | Severity | Est. cost |
|---|---|---|
| exterior siding · Significant wear and peeling | Major | $15,000–50,000 |
| exterior paint · Peeling and faded | Major | $15,000–50,000 |
| Total estimated repair cost · 2 items | $30,000–100,000 |
Value-add ROI direction
- Both paint exterior siding and paint — Enhances curb appeal and value ↑
- Both replace kitchen appliances — Modernizes the space and increases appeal ↑
ⓘ Cost ranges are severity-bucket heuristics (US national rule-of-thumb). Get contractor quotes + a written scope before underwriting a rehab budget.
Schools (NCES district)
- District
- Davis District
- NCES district ID
- 4900210
- Math proficiency
- 43% ▼ -9.00%
- Reading proficiency
- 47% ▼ -5.00%
- Median HH income
- $70,511
- Composite
- 40.59/100
- National rank
- #3698
- State rank
- #28 of 80 in UT
Livability — Layton
- Score
- 86/100
- State rank
- #11
- US rank
- #457
Category grades
Schools grade is shown separately in the Schools card above.
Census & demographics
- Census place
- Layton, UT
- County
- Davis County · 341,755 people
- City population
- 83,689
- Metro
- Ogden-Clearfield, UT
- Population (ZIP)
- 55,180
- Household income
- $89,604
- Rent vs Own
- Severe rent burden
- 1058.0
Population outlook (Davis County) Hauer SSP2
- Today (2025)
- 399,271 people
- By 2030
- 430,528 · +7.8%
- By 2040
- 493,485 · +23.6%
- By 2050
- 555,187 · +39.1%
- By 2075
- 688,589 · +72.5%
- By 2100
- 769,646 · +92.8%
Race, ethnicity, and origin ACS 2023
- Neighborhood character
- Predominantly White (75%)
- Race & ethnicity
- White 75% Hispanic / Latino 17% Two or more races 10% Asian 2% Black 1% Pacific Islander 1%
- Hispanic origin (detail)
- Mexican 12%
- Common ancestry
- Slovak 4% Italian 2% Portuguese 2%
- Foreign-born
- 7% · Canada
- Languages at home
- 86% English-only · Spanish 11% Tagalog/Filipino 1% Other Indo-European 1%
Political lean MEDSL · Davis
- 2024 margin
- Strong R (+24.9) · D 36.0% · R 60.8% · Other 3.2%
- 2008→2024 swing
- +17.4pp toward D · 2008: -42.3pp · 2024: -24.9pp
- All cycles
- 2024: R+24.9 2020: R+27.5 2016: R+23.3 2012: R+61.8 2008: R+42.3
Not yet ingested
- Civics
- —
Market trends
- HPI YoY
- ▼ -173.00%
- Current HPI
- 307.2627
- Rent YoY
- ▲ 1.30%
- Metro
- Ogden-Clearfield, UT
- State GDP YoY
- ▲ 3.54%
- F500 in state
- 2
Industry mix (Fortune 500 HQ in UT)
| Industry | F500 HQs | Revenue |
|---|---|---|
| Financial Services | 1 | $3B |
|
||
Price history
-7.8% since first listed12 events — show timeline
- 2026-04-08 Price Changed $59,900 WFRMLS
- 2026-04-07 Listed $59,500 WFRMLS
- 2023-05-24 Sold (MLS) — WFRMLS
- 2023-04-25 Pending — WFRMLS
- 2023-04-18 Contingent — WFRMLS
- 2023-04-05 Pending — WFRMLS
- 2023-03-16 Listed $55,000 WFRMLS
- 2022-01-04 Listing Removed — WFRMLS
- 2021-11-02 Price Changed $50,000 WFRMLS
- 2021-09-17 Relisted — WFRMLS
- 2021-09-13 Listing Removed — WFRMLS
- 2021-09-03 Listed $65,000 WFRMLS
Cash-flow waterfall
monthlySold comps — $/sqft
last 12 mo · ≤1 miLoading sold comps…