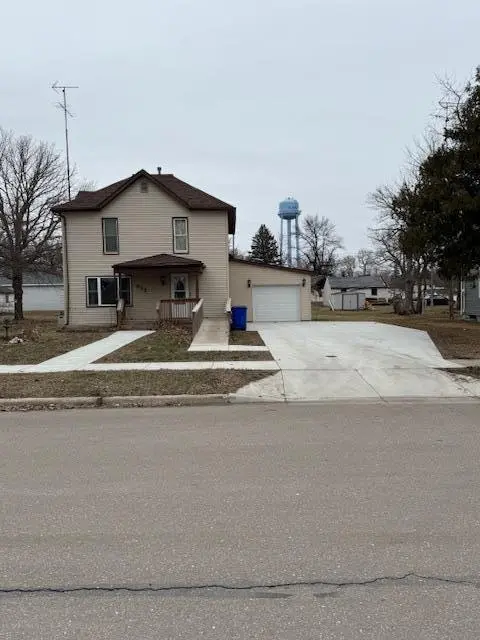
812 11th Ave · Clarkfield, MN
Flood risk 1/10 · Minimal
- FEMA flood zone
- X (unshaded)
- Chance of flooding over 30 yrs
- 0.0%
- Est. flood insurance / yr
- $473 – $860
Fire risk 1/10 · Minimal
- Est. fire insurance / yr
- $888 – $1,650
Heat risk 2/10 · Minimal
- Hot days now (above 99°F)
- 7 days/yr
- Hot days in 30 yrs
- 14 days/yr
Wind risk 2/10 · Minimal
- Chance of severe wind over 30 yrs
- —
Air-quality risk 2/10 · Minimal
- Unhealthy air days now
- 1 days/yr
- Unhealthy air days in 30 yrs
- 1 days/yr
Risk factors via First Street. Map © Google.
Why this score? — see what drove the B+ grade
The composite is a weighted blend of 9 inputs, each scored 0–100. Each bar is that input's sub-score; the figure is the points it added to the 100-point composite (weight × sub-score).
- Cash flow +29.0/30.0
- DSCR +10.0/10.0
- Appreciation +10.0/10.0
- 1% rule +7.6/10.0
- ARV discount +7.5/15.0
- Schools +3.4/10.0
- Livability +3.3/5.0
- Rent growth +2.5/5.0
- Condition / age +2.5/5.0
$81,900
🖨 Deal sheet (PDF) 📄 Offer letter ✓ Due diligence
Listing remarks
Need room to grow? This home is ready for you. Step inside and discover a spacious 4-bedroom, 2-bath home with an insulated attached garage—perfect for comfort and convenience. This property has seen several thoughtful updates, including: newer windows and shingles, fresh cement in the garage, driveway, and walkway, new garage door and back door, beautiful tiled walk-in shower, new patio door, main-floor laundry for easy living. If you’re looking for everything on one level, you’ll find it here. Come explore the possibilities and see how easily you can make this home your own.
Key facts
- Tiled walk-in shower
- New patio door
- Newer windows
Tags
Property features AI
Exterior
- Parking: Attached garage (1 car) with a 7' high by 9' wide door
- Utilities: City water (connected); City sewer (connected); Natural gas; 100 amp electric service (Xcel Energy)
- Home design: Residential property; Two levels; Stone foundation; Roof replaced/installed within the last 8 years; Public-maintained city street frontage; Lot dimensions approximately 85 x 140
- Construction: Stone foundation; Vinyl siding; Roof age 8 years or less; Built with foundation area of 912
- Exterior features: Vinyl exterior; Light tree coverage on the lot; Wheelchair ramp(s)
Interior
- Kitchen: Kitchen on main level
- Bedrooms: 4 bedrooms total; One bedroom on the main level; Three bedrooms on the upper level
- Bathrooms: 2 full bathrooms (one on main level, one on upper level)
- Heating & cooling: Forced air heating; Central air conditioning
- Interior features: Main-floor laundry; Living/Dining room; Foyer; Bonus room (upper level); Has crawl space basement
- Laundry & utility: Main-floor laundry
Neighborhood map
What this means for you Summary
Snapshot
- This is a 4-bed/1.0-bath single-family listed at $82k.
Deal economics
- At list price, monthly cash flow is $279 ($3k/yr) — positive.
- The deal already cash-flows at list — no discount required.
- Meets the 1% rule at list price ($1k rent vs $82k).
- Recommended offer: $79k (3.0% below list) — sets the bar for market timing.
Location & tenants
- Location reads 66/100 on livability (#497 in MN) — a middle-class / working-renter tenant base. Strengths: cost of living A+, housing A+; Watch: employment C-, crime D+, health & safety D+.
- Yellow Medicine East (town): math 31% / reading 47% proficiency, ranked #227 of 301 in MN (top 75%) — families likely to look elsewhere, expect single-tenant / working-renter base with shorter leases.
- Zoned schools: Bert Raney Elementary School (math 47% / reading 52%, grade D, #423 of 857 statewide, top 55%, 267 students, 59% FRL); Yellow Medicine East Middle School (math 12% / reading 47%, grade F, #204 of 258 statewide, top 80%, 143 students, 49% FRL); Yellow Medicine East High School (math 24% / reading 44%, grade F, #306 of 471 statewide, top 70%, 206 students, 44% FRL) — zoned schools average 50% FRL vs 33% district-wide (17 pts higher); higher-poverty schools than district average — tighter screening recommended.
- Market conditions: 6 active listings in the ZIP; 7 units permitted in Yellow Medicine County in 2024 (0 in 5+ unit buildings).
Forward outlook
- In year one you build about $9k of equity ($566 loan paydown + $8k appreciation (10.0% local appreciation)).
- Yellow Medicine County population projected at -26% by 2050 — secular population decline; favor cash flow + early exit over multi-decade hold.
- At projected returns (10.0% appreciation + 3.0% rent growth), your $23k cash investment doubles in ~2 years — after that, you're playing with house money.
- By year 4, paydown + projected appreciation supports a ~$31k cash-out refi (75% LTV) — recoverable capital for the next deal without selling this one.
Negotiation context
- It's been on market 49 days — a 3% lower offer ($79k) is reasonable based on typical stale-listing flexibility.
- 2 sale attempts with the ask held roughly flat each time — persistent listings suggest the price (not the market) is what's stuck; bring a comps-based counter.
Risks & watch-outs
- Watch-outs: built in 1900 — expect roof / HVAC / electrical / plumbing capex.
Questions for the listing agent
- It's been on market 49 days. Have you received any prior offers? Is the seller open to a 3% concession, seller financing, or rate buy-down credit?
- Built in 1900 — when were the roof, HVAC, electrical panel, plumbing, and water heater last replaced?
- Is there a deadline driving the sale (1031 exchange, divorce, estate, relocation)? That informs how much negotiation room exists.
- Schools are A-rated — typically a magnet for longer-tenancy family renters. What's the average tenant stay here, and is there a school-zone premium baked into asking?
- Crime grade is D in this area — have there been break-ins, vandalism, or insurance claims at this property in the last 3 years? What carrier currently insures it and at what premium?
- What's the average days-on-market for RENTAL listings here right now (not sales)? A rising rental-DOM trend means longer vacancies and softer asking-rent achievability than the comps imply.
- What's the recent tenant-quality profile in this submarket — average credit score on applications, eviction rate, late-payment / NSF rate, and stable-employment percentage? A property-management company in the area should have these aggregated.
- How much new for-sale + rental construction is in the pipeline within 1–3 miles? Heavy new supply typically softens prices + rents 12–24 months out; constrained supply supports both.
Investment metrics
- 1% rule
- 1.26% ✓
- Cap rate
- 10.39%
- Cash-on-cash
- 14.62%
- DSCR
- 1.65
- GRM
- 6.6
CMA / ARV
No comps found within radius.
Projected returns pro-forma
10.0% appreciation · 3.0% rent growth · sell at horizon
- IRR
- 35.1%
- Equity multiple
- 3.72×
- Total profit
- $62,392
- Equity at exit
- $73,782
- IRR
- 30.2%
- Equity multiple
- 8.40×
- Total profit
- $169,733
- Equity at exit
- $159,114
Cash invested: $22,932 (down + closing). Projections, not guarantees.
Landlord ↔ Tenant lean methodology
- Overall (STATE)
- 46 Balanced
- State Minnesota
- 46 Balanced · D+2
- County
- — inherits STATE
- City
- — inherits STATE
ZIP-level market 56223
- Active inventory
- 6
- Price-to-rent
- 6.6×
Monthly cashflow live
- Estimated rent
- $1,028 medium interval (Pro) →
- Mortgage (P&I)
- −$429
- Tax from tax record
- −$69 /mo · $832/yr
- Insurance
- −$34
- HOA
- −$0
- Lot rent
- −$0
- Vacancy / Maint / Mgmt
- −$216
- Net cashflow
- $279
Break-even live
Sensitivity live
| Price | -10% $326 | -5% $303 | +0% $279 | +5% $256 | +10% $233 |
|---|---|---|---|---|---|
| Rent | -10% $198 | -5% $239 | +0% $279 | +5% $320 | +10% $361 |
| Rate | -1.0pp $321 | -0.5pp $300 | base $279 | +0.5pp $258 | +1.0pp $237 |
UW: 25.0% down · 7.5% · 30yr · 1.5% tax · 5.0% vac · 8.0% maint · 8.0% mgmt
Financing live
Cash to close
- Down payment
- $20,475
- Closing costs
- $2,457
- Reserves months
- —
- Total cash needed
- —
Loan-product check · same deal, 3 products live
Conventional
25% down · 7.5% · 30yr
- Down + closing
- —
- Monthly P&I
- —
- Monthly cashflow
- —
- DSCR
- —
- Eligible?
- —
Personal DTI + credit; lowest rate.
DSCR
20% down · 8.5% · 30yr
- Down + closing
- —
- Monthly P&I
- —
- Monthly cashflow
- —
- DSCR
- —
- Eligible?
- —
No personal income docs; deal must DSCR.
Hard money
10% down · 12.0% · 12mo
- Down + closing
- —
- Monthly P&I
- —
- Monthly cashflow
- —
- DSCR
- —
- Eligible?
- —
Short-term bridge; refi at stabilization.
Listing history 5 events
-
2026-05-13status Pending
-
2026-05-04historical Contingent - Inspection
-
2026-05-01status Active
-
2026-04-30historical
-
2026-03-23$81,900 Active
ⓘ Source: listings_history table (triggers on properties + properties_extension) + one-shot
backfill from property_details.listing_events for pre-trigger history.
Tax reassessment forecast MN · Partial reset (capped growth)
- Current annual tax
- $832 · $69/mo
- Projected year-2 tax
- $875 · $73/mo
- Expected delta
- +$43/yr (+$4/mo · 5.1%)
ⓘ Screening estimate from a state-policy table — verify with the county assessor before closing.
Climate risk First Street
- Flood 1/10 Low FEMA zone X (unshaded) · 0% chance over 30 yrs
- Wildfire 1/10 Low
- Heat 2/10 Low 7 d/yr ≥99°F today · 14 d/yr by 30 yrs out
- Wind 2/10 Low
- Air quality 2/10 Low 1 unhealthy d/yr today · 1 by 30 yrs out
Nearby sold comps map
Loading sold comps map…
Walkable amenities ~0.75 mi
Loading nearby amenities…
Taxation est. · year 1
- Rental income
- $12,339
- − Mortgage interest
- −$4,588
- − Property taxes
- −$832
- − Insurance
- −$410
- − Repairs & maintenance
- −$987
- − Management
- −$987
- − Depreciation
- −$2,383
- Taxable income
- $2,153
- Est. tax owed @ 24.0%
- −$517
- After-tax cash flow
- $2,836/yr
For passive investors: Depreciation is non-cash, so a rental often shows a tax loss while cash-flowing — sheltering income. Rental losses are passive: they offset passive income freely, and up to $25,000/yr can offset ordinary (W-2) income if you actively participate and your MAGI is under $100k (phasing out to $0 by $150k); unused losses carry forward. On sale, claimed depreciation is recaptured at up to 25%, and gains may owe capital-gains tax (a 1031 exchange can defer both). Figures are a year-1 estimate at your 24.0% rate — not tax advice; consult a CPA.
Schools (NCES district)
- District
- Yellow Medicine East
- NCES district ID
- 2700099
- Math proficiency
- 31% ▼ -7.00%
- Reading proficiency
- 47% ▼ -7.00%
- Median HH income
- $51,457
- Composite
- 33.74/100
- National rank
- #5369
- State rank
- #227 of 301 in MN
Livability — Clarkfield
- Score
- 66/100
- State rank
- #497
- US rank
- #11957
Category grades
Schools grade is shown separately in the Schools card above.
Census & demographics
- Census place
- Clarkfield, MN
- Population (ZIP)
- 1,403
Population outlook (Yellow Medicine County) Hauer SSP2
- Today (2025)
- 8,959 people
- By 2030
- 8,451 · -5.7%
- By 2040
- 7,514 · -16.1%
- By 2050
- 6,650 · -25.8%
- By 2075
- 5,306 · -40.8%
- By 2100
- 4,453 · -50.3%
Race, ethnicity, and origin ACS 2023
- Neighborhood character
- Predominantly White (88%)
- Race & ethnicity
- White 88% Hispanic / Latino 7% Two or more races 5% Native American 2%
- Hispanic origin (detail)
- Mexican 5%
- Common ancestry
- Portuguese 33% Lithuanian 4% Scottish 2%
- Foreign-born
- 4% · Canada
- Languages at home
- 93% English-only · Spanish 6%
Political lean MEDSL · Yellow Medicine
- 2024 margin
- Solid R (+40.6) · D 28.7% · R 69.3% · Other 1.9%
- 2008→2024 swing
- -44.9pp toward R · 2008: 4.3pp · 2024: -40.6pp
- All cycles
- 2024: R+40.6 2020: R+37.0 2016: R+35.4 2012: R+6.3 2008: D+4.3
Not yet ingested
- Civics
- —
Market trends
- HPI YoY
- ▲ 106.79%
- Current HPI
- 318.75
- Rent YoY
- —
- Metro
- —
- State GDP YoY
- ▲ 2.41%
- F500 in state
- 34
Industry mix (Fortune 500 HQ in MN)
| Industry | F500 HQs | Revenue |
|---|---|---|
| Healthcare | 2 | $407B |
|
||
| Retail | 2 | $150B |
|
||
| Consumer Goods | 2 | $32B |
|
||
| Industrial Machinery | 2 | $6B |
|
||
| Agriculture | 1 | $40B |
|
||
| Healthcare / Medical Devices | 1 | $32B |
|
||
Price history
5 events — show timeline
- 2026-05-13 Pending — NORTHSTARMLS as Distributed by MLS Grid
- 2026-05-04 Contingent — NORTHSTARMLS as Distributed by MLS Grid
- 2026-05-01 Relisted — NORTHSTARMLS as Distributed by MLS Grid
- 2026-04-30 Listing Removed — NORTHSTARMLS as Distributed by MLS Grid
- 2026-03-23 Listed $81,900 NORTHSTARMLS as Distributed by MLS Grid
Property tax history
+15.7%/yrLatest (2025): $832 · +17.8% YoY. Source: county tax records.
Cash-flow waterfall
monthlySold comps — $/sqft
last 12 mo · ≤1 miLoading sold comps…