 🔨 Auction
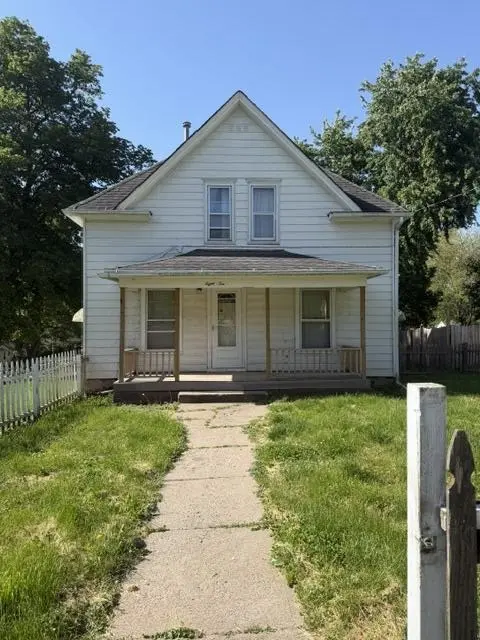
810 E Washington Ave · Red Oak, IA
Flood risk 1/10 · Minimal
- FEMA flood zone
- X (unshaded)
- Chance of flooding over 30 yrs
- 0.0%
- Est. flood insurance / yr
- $507 – $1,088
Fire risk 2/10 · Minimal
- Est. fire insurance / yr
- $902 – $1,676
Heat risk 3/10 · Minor
- Hot days now (above 104°F)
- 7 days/yr
- Hot days in 30 yrs
- 15 days/yr
Wind risk 2/10 · Minimal
- Chance of severe wind over 30 yrs
- —
Air-quality risk 1/10 · Minimal
- Unhealthy air days now
- 0 days/yr
- Unhealthy air days in 30 yrs
- 0 days/yr
Risk factors via First Street. Map © Google.
Why this score? — see what drove the F grade
The composite is a weighted blend of 9 inputs, each scored 0–100. Each bar is that input's sub-score; the figure is the points it added to the 100-point composite (weight × sub-score).
- ARV discount +7.5/15.0
- Cash flow +6.6/30.0
- Schools +4.9/10.0
- Livability +3.4/5.0
- Rent growth +2.5/5.0
- Condition / age +2.5/5.0
- 1% rule +1.7/10.0
- DSCR +0.9/10.0
- Appreciation +0.0/10.0
$10,000
🖨 Deal sheet (PDF) 📄 Offer letter ✓ Due diligence
Listing remarks
Online Bidding Only! Real estate closes at 10:00 am June 11th, 2026. Single Family Residence 1 1/2 story, 3 bed , 1 bath , detached garage, approximately 1304 sq. ft. living area situated on . 20 acres. Whether you are looking for a personal property to fix up and make your own or an investment this home offers tons of potential for either.
Key facts
- Garage
- Built 1900
- Listed 29 days
Property features AI
Exterior
- Parking: Off-street parking; Attached or detached 1-car garage
- Utilities: Public sewer
- Home design: Single-family residence; One story
- Construction: Frame construction; Composition roof
- Exterior features: Front porch; Deck; Corner lot; Asphalt road frontage
Interior
- Basement: Partial, unfinished basement
- Heating & cooling: Central air conditioning; Forced air heating
- Interior features: Other interior features
- Laundry & utility: Laundry on the main level
Neighborhood map
What this means for you Summary
Snapshot
- This is a 3-bed/1.0-bath single-family listed at $10k.
Deal economics
- At list price, monthly cash flow is $-221 ($-3k/yr) — negative.
- The deal already cash-flows at list — no discount required.
- Meets the 1% rule at list price ($895 rent vs $10k).
- Recommended offer: $10k (1.5% below list) — sets the bar for market timing.
Location & tenants
- Location reads 68/100 on livability (#428 in IA) — a middle-class / working-renter tenant base. Strengths: cost of living A+, housing A+, health & safety A+; Watch: employment D+, amenities F, commute F.
- Red Oak Community School District (town): math 58% / reading 59% proficiency, ranked #255 of 289 in IA (top 88%) — acceptable for families but not a draw, mixed tenant base, ~2y average lease.
- Zoned schools: Inman Elementary School (math 63% / reading 47%, grade C, #459 of 616 statewide, top 75%, 496 students, 59% FRL); Red Oak Early Childhood Center (74 students, 62% FRL); Red Oak Junior/Senior High School (math 55% / reading 67%, grade C+, #258 of 336 statewide, top 78%, 474 students, 55% FRL).
- Market conditions: 56 active listings in the ZIP; 1 comparable units currently listed for rent nearby; 13 units permitted in Montgomery County in 2024 (0 in 5+ unit buildings).
Forward outlook
- Local home prices are declining (-3.0%/yr); year-one equity from $929 of loan paydown is wiped out by about $4k of value loss. Plan a longer hold.
- Montgomery County population projected at -20% by 2050 — secular population decline; favor cash flow + early exit over multi-decade hold.
Negotiation context
- It's been on market 30 days — a 2% lower offer ($10k) is reasonable based on typical stale-listing flexibility.
- 2 sale attempts since 6y ago; this cycle's ask has dropped $39k (80%) from the opening price — seller is motivated, your offer sets the floor, not the list.
Risks & watch-outs
- Watch-outs: property tax is 20.1% of price; built in 1900 — expect roof / HVAC / electrical / plumbing capex.
Questions for the listing agent
- What do current leases actually rent for vs. the listed asking? Can we see a recent rent roll and the last 12 months of T-12 income?
- Built in 1900 — when were the roof, HVAC, electrical panel, plumbing, and water heater last replaced?
- Property tax is high relative to price — has the assessment been appealed recently, and will the sale trigger a re-assessment?
- Is there a deadline driving the sale (1031 exchange, divorce, estate, relocation)? That informs how much negotiation room exists.
- The area grade is low — what's the realistic commute time and amenity access for the typical tenant pool here? Any planned neighborhood developments (good or bad) we should know about?
- What's the average days-on-market for RENTAL listings here right now (not sales)? A rising rental-DOM trend means longer vacancies and softer asking-rent achievability than the comps imply.
- What's the recent tenant-quality profile in this submarket — average credit score on applications, eviction rate, late-payment / NSF rate, and stable-employment percentage? A property-management company in the area should have these aggregated.
- How much new for-sale + rental construction is in the pipeline within 1–3 miles? Heavy new supply typically softens prices + rents 12–24 months out; constrained supply supports both.
Investment metrics
- 1% rule
- 0.67% ✗
- Cap rate
- 4.32%
- Cash-on-cash
- -7.06%
- DSCR
- 0.69
- GRM
- 12.5
CMA / ARV
- ARV (on-the-fly)
- $134,312
- Comps found
- 12
Show comp detail 12 sales within ~0.75 mi
| Address | Dist | Beds/Ba | Sqft | Sold | Price | $/sf | Match |
|---|---|---|---|---|---|---|---|
| 706 E Prospect St | 0.41mi | 2/1.5 (-1) | 1,301 (-0%) | 7mo | $155,000 | $119 | 68 |
| 900 Boundary St | 0.33mi | 2/2.0 (-1) | 1,270 (-3%) | 9mo | $58,000 | $46 | 64 |
| 1005 N 2nd St | 0.59mi | 3/2.0 | 1,294 (-1%) | 4mo | $55,000 | $43 | 63 |
| 1109 E Reed St | 0.28mi | 3/2.0 | 1,380 (+6%) | 14mo | $110,000 | $80 | 62 |
| 904 N 6th St | 0.36mi | 3/3.0 | 1,396 (+7%) | 3mo | $188,250 | $135 | 61 |
| 601 S 6th St | 0.55mi | 4/2.0 (+1) | 1,394 (+7%) | 5mo | $182,000 | $131 | 50 |
| 207 W Coolbaugh St | 0.60mi | 2/2.0 (-1) | 1,190 (-9%) | 1mo | $78,000 | $66 | 48 |
| 709 Maple St | 0.57mi | 3/2.0 | 1,468 (+13%) | 3mo | $105,000 | $72 | 46 |
| 1108 Kelly Cir | 0.28mi | 3/1.5 | 1,485 (+14%) | 19mo | $169,900 | $114 | 46 |
| 100 W Valley St | 0.61mi | 2/1.0 (-1) | 1,164 (-11%) | 9mo | $50,000 | $43 | 41 |
| 507 E Elm St | 0.54mi | 2/2.0 (-1) | 1,116 (-14%) | 4mo | $115,000 | $103 | 38 |
| 1104 Irene Ct | 0.75mi | 4/2.0 (+1) | 1,182 (-9%) | 15mo | $150,000 | $127 | 28 |
Match score weights: distance 35% · size 25% · config 20% · recency 20%. Top-matched comps best support the ARV.
Projected returns pro-forma
-3.0% appreciation · 3.0% rent growth · sell at horizon
- IRR
- -28.5%
- Equity multiple
- 0.05×
- Total profit
- $-35,836
- Equity at exit
- $20,026
- IRR
- -27.9%
- Equity multiple
- -0.31×
- Total profit
- $-49,287
- Equity at exit
- $11,613
Cash invested: $37,607 (down + closing). Projections, not guarantees.
Landlord ↔ Tenant lean methodology
- Overall (STATE)
- 83 Strongly Landlord-Friendly
- State Iowa
- 83 Strongly Landlord-Friendly · R+6
- County
- — inherits STATE
- City
- — inherits STATE
ZIP-level market 51566
- Home prices YoY
- -33.3%
- Active inventory
- 56
- Price-to-rent
- 0.9×
Monthly cashflow live
- Estimated rent
- $895 medium interval (Pro) →
- Mortgage (P&I)
- −$704
- Tax est. 1.5%
- −$168 /mo · $2,015/yr
- Insurance
- −$56
- HOA
- −$0
- Lot rent
- −$0
- Vacancy / Maint / Mgmt
- −$188
- Net cashflow
- $-221
Break-even live
Sensitivity live
| Price | -10% $-128 | -5% $-175 | +0% $-221 | +5% $-268 | +10% $-314 |
|---|---|---|---|---|---|
| Rent | -10% $-292 | -5% $-257 | +0% $-221 | +5% $-186 | +10% $-150 |
| Rate | -1.0pp $-154 | -0.5pp $-187 | base $-221 | +0.5pp $-256 | +1.0pp $-291 |
UW: 25.0% down · 7.5% · 30yr · 1.5% tax · 5.0% vac · 8.0% maint · 8.0% mgmt
Financing live
Cash to close
- Down payment
- $33,578
- Closing costs
- $4,029
- Reserves months
- —
- Total cash needed
- —
Loan-product check · same deal, 3 products live
Conventional
25% down · 7.5% · 30yr
- Down + closing
- —
- Monthly P&I
- —
- Monthly cashflow
- —
- DSCR
- —
- Eligible?
- —
Personal DTI + credit; lowest rate.
DSCR
20% down · 8.5% · 30yr
- Down + closing
- —
- Monthly P&I
- —
- Monthly cashflow
- —
- DSCR
- —
- Eligible?
- —
No personal income docs; deal must DSCR.
Hard money
10% down · 12.0% · 12mo
- Down + closing
- —
- Monthly P&I
- —
- Monthly cashflow
- —
- DSCR
- —
- Eligible?
- —
Short-term bridge; refi at stabilization.
Rent comps 1 comps
| Address | Beds | Baths | Sqft | Rent | $/sqft | DOM | Units | Dist |
|---|---|---|---|---|---|---|---|---|
| 2400 N 8th St Red Oak, IA | 1.0–3.0 | 1.0–2.0 | 792 | $895 | $1.13 | 16d | 11 | 1.33mi |
Listing history 18 events
-
2026-06-18days on market $10,000 Active 30 DOM
-
2026-06-17days on market $10,000 Active 29 DOM
-
2026-06-16days on market $10,000 Active 28 DOM
-
2026-06-15days on market $10,000 Active 27 DOM
-
2026-06-13days on market $10,000 Active 25 DOM
-
2026-06-12pricedays on market $10,000 Active 24 DOM
-
2026-06-09days on market $49,000 Active 21 DOM
-
2026-06-08days on market $49,000 Active 20 DOM
-
2026-06-07days on market $49,000 Active 19 DOM
-
2026-06-05days on market $49,000 Active 17 DOM
-
2026-06-04days on market $49,000 Active 15 DOM
-
2026-06-02days on market $49,000 Active 14 DOM
-
2026-06-01days on market $49,000 Active 13 DOM
-
2026-05-31days on market $49,000 Active 12 DOM
-
2026-05-31days on market $49,000 Active 11 DOM
-
2026-05-19$49,000 Active
-
2020-10-22soldstatus $44,500
-
2020-01-16$41,500
ⓘ Source: listings_history table (triggers on properties + properties_extension) + one-shot
backfill from property_details.listing_events for pre-trigger history.
Climate risk First Street
- Flood 1/10 Low FEMA zone X (unshaded) · 0% chance over 30 yrs
- Wildfire 2/10 Low
- Heat 3/10 Moderate 7 d/yr ≥104°F today · 15 d/yr by 30 yrs out
- Wind 2/10 Low
- Air quality 1/10 Low 0 unhealthy d/yr today · 0 by 30 yrs out
Nearby sold comps map
Loading sold comps map…
Walkable amenities ~0.75 mi
Loading nearby amenities…
Taxation est. · year 1
- Rental income
- $10,740
- − Mortgage interest
- −$7,524
- − Property taxes
- −$2,015
- − Insurance
- −$672
- − Repairs & maintenance
- −$859
- − Management
- −$859
- − Depreciation
- −$3,907
- Taxable loss
- −$5,095
- Est. tax savings @ 24.0%
- +$1,223
- After-tax cash flow
- $-1,431/yr
For passive investors: Depreciation is non-cash, so a rental often shows a tax loss while cash-flowing — sheltering income. Rental losses are passive: they offset passive income freely, and up to $25,000/yr can offset ordinary (W-2) income if you actively participate and your MAGI is under $100k (phasing out to $0 by $150k); unused losses carry forward. On sale, claimed depreciation is recaptured at up to 25%, and gains may owe capital-gains tax (a 1031 exchange can defer both). Figures are a year-1 estimate at your 24.0% rate — not tax advice; consult a CPA.
Schools (NCES district)
- District
- Red Oak Community School District
- NCES district ID
- 1924000
- Math proficiency
- 58% ▼ -6.00%
- Reading proficiency
- 59% ▲ 2.00%
- Median HH income
- $38,902
- Composite
- 48.77/100
- National rank
- #2092
- State rank
- #255 of 289 in IA
Livability — Red Oak
- Score
- 68/100
- State rank
- #428
- US rank
- #9239
Category grades
Schools grade is shown separately in the Schools card above.
Census & demographics
- Census place
- Red Oak, IA
- City population
- 7,004
- Population (ZIP)
- 7,004
Population outlook (Montgomery County) Hauer SSP2
- Today (2025)
- 9,518 people
- By 2030
- 9,116 · -4.2%
- By 2040
- 8,303 · -12.8%
- By 2050
- 7,595 · -20.2%
- By 2075
- 6,568 · -31.0%
- By 2100
- 5,800 · -39.1%
Race, ethnicity, and origin ACS 2023
- Neighborhood character
- Predominantly White (91%)
- Race & ethnicity
- White 91% Two or more races 4% Hispanic / Latino 1% Asian 1%
- Common ancestry
- Serbian 2% Romanian 1% Iranian 1%
- Foreign-born
- 2% · Canada
- Languages at home
- 98% English-only · Spanish 1%
Political lean MEDSL · Montgomery
- 2024 margin
- Solid R (+39.1) · D 29.8% · R 68.9% · Other 1.3%
- 2008→2024 swing
- -28.5pp toward R · 2008: -10.6pp · 2024: -39.1pp
- All cycles
- 2024: R+39.1 2020: R+39.0 2016: R+42.4 2012: R+21.6 2008: R+10.6
Not yet ingested
- Civics
- —
Market trends
- HPI YoY
- ▼ -93.42%
- Current HPI
- 187.1643
- Rent YoY
- —
- Metro
- —
- State GDP YoY
- ▲ 2.48%
- F500 in state
- 4
Industry mix (Fortune 500 HQ in IA)
| Industry | F500 HQs | Revenue |
|---|---|---|
| Financial Services | 1 | $16B |
|
||
| Retail / Convenience | 1 | $15B |
|
||
Price history
-75.9% since first listed4 events — show timeline
- 2026-06-11 Price Changed $10,000 SWIAR
- 2026-05-19 Listed $49,000 SWIAR
- 2020-10-22 Sold (Public Records) $44,500 Public Records
- 2020-01-16 Listed $41,500 NORTHSTARMLS as Distributed by MLS Grid
Property tax history
+3.7%/yrLatest (2025): $1,334 · +4.2% YoY. Source: county tax records.
Cash-flow waterfall
monthlySold comps — $/sqft
last 12 mo · ≤1 miLoading sold comps…