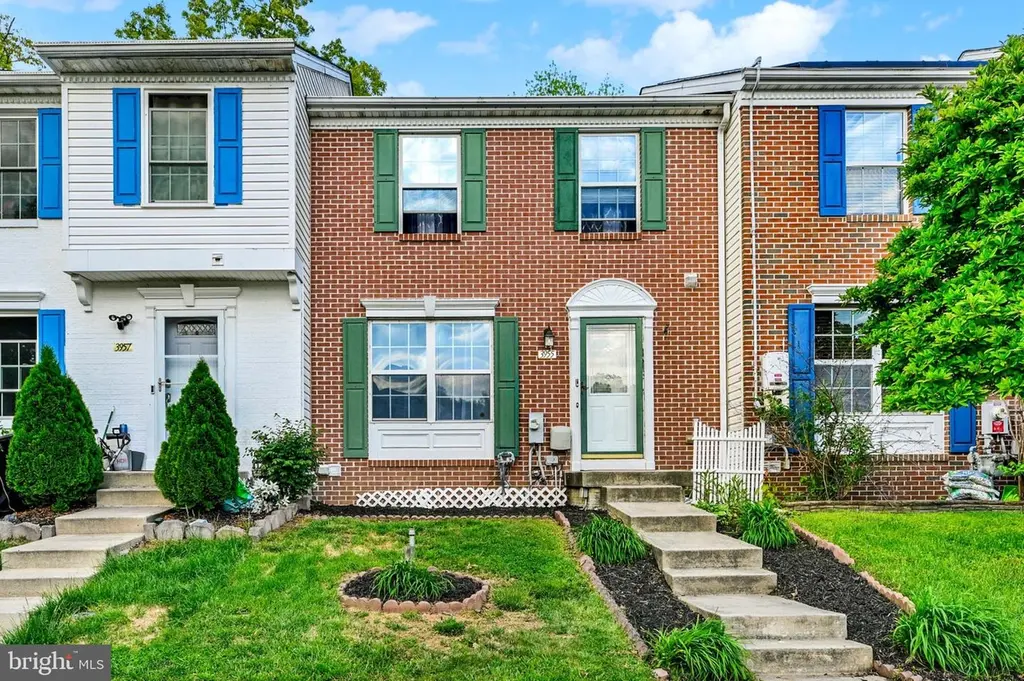
3955 Bush Ct · Abingdon, MD
Flood risk 1/10 · Minimal
- FEMA flood zone
- X (unshaded)
- Chance of flooding over 30 yrs
- 0.0%
- Est. flood insurance / yr
- $473 – $860
Fire risk 2/10 · Minimal
- Est. fire insurance / yr
- $755 – $1,403
Heat risk 7/10 · Major
- Hot days now (above 104°F)
- 7 days/yr
- Hot days in 30 yrs
- 15 days/yr
Wind risk 6/10 · Moderate
- Chance of severe wind over 30 yrs
- 27.0%
Air-quality risk 3/10 · Minor
- Unhealthy air days now
- 2 days/yr
- Unhealthy air days in 30 yrs
- 3 days/yr
Risk factors via First Street. Map © Google.
Why this score? — see what drove the D grade
The composite is a weighted blend of 9 inputs, each scored 0–100. Each bar is that input's sub-score; the figure is the points it added to the 100-point composite (weight × sub-score).
- Cash flow +12.0/30.0
- ARV discount +9.3/15.0
- Rent growth +4.3/5.0
- DSCR +3.6/10.0
- 1% rule +3.2/10.0
- Schools +2.9/10.0
- Livability +2.5/5.0
- Condition / age +2.5/5.0
- Appreciation +0.0/10.0
$280,000
🖨 Deal sheet (PDF) 📄 Offer letter ✓ Due diligence
Listing remarks MLS
Gorgeous brickfront 3 BR 2.5 Bath townhome on quiet cul de sac backing to woods. Home has over 1100 sq. ft on main two levels. Large eat-in kitchen with hardwood floors. Master bedroom with cathedral ceiling & walk in closet. Spacious, finished walk out lower level. Great deck & fenced in backyard with 10x8 shed. Community park with playground across the street. 10++
Key facts
- $98 HOA
- 2 parking spots
- Community pool
Property features AI
Finance
- HOA & community: HOA fee $98 monthly; HOA includes snow removal and trash; Community pool (outdoor)
Exterior
- Parking: Two assigned parking spaces; On-street parking available; Parking lot
- Utilities: Public water; Public sewer; Natural gas available; Hot water: electric
- Home design: Semi-detached property; Brick construction with brick front; Good condition; Fee simple ownership
- Construction: Concrete perimeter foundation; Above- and below-grade structures; Estimated year built
- Exterior features: Fully fenced; Community outdoor pool; Below-grade finished area
Interior
- Kitchen: Dishwasher; Disposal; Electric range/oven; Refrigerator; Stainless steel appliances
- Bedrooms: Three bedrooms on the upper level
- Flooring: Hardwood; Tile/brick; Vinyl; Carpet
- Bathrooms: Two full bathrooms; One half bathroom
- Heating & cooling: Forced air heating (natural gas); Central air conditioning; Ceiling fans
- Interior features: Tub/shower; Ceiling fans; Eat-in kitchen; Pantry; Walk-in closet(s); Drywall walls and ceilings; Wood floors; Carpeted areas
- Laundry & utility: Washer; Electric water heater
Neighborhood map
What this means for you Summary
Snapshot
- This is a 3-bed/2.5-bath townhouse listed at $280k.
Deal economics
- At list price, monthly cash flow is $-64 ($-771/yr) — negative.
- To cash-flow at today's rent, offer at most $269k (4.1% below list).
- To meet the 1% rule (rent ≥ 1% of price), the offer needs to be $228k (18.5% below list).
- Recommended offer: $228k (18.5% below list) — sets the bar for 1% rule.
- Cap rate 6.0% vs local median 4.4% in Abingdon — top-decile yield for the area; either an underpriced asset or a hidden risk that comps aren't pricing in. Stress-test before assuming the spread holds.
Location & tenants
- Location reads: area grade D — affects rentability + tenant quality, not the cash-flow math above.
- Harford County Public Schools (suburban): math 22% / reading 39% proficiency, ranked #9 of 24 in MD (top 38%) — families likely to look elsewhere, expect single-tenant / working-renter base with shorter leases.
- Zoned schools: Edgewood Middle (math 7% / reading 31%, grade F, #155 of 225 statewide, top 70%, 999 students, 72% FRL); Edgewood High (math 43% / reading 54%, grade D, #111 of 222 statewide, top 50%, 1,415 students, 62% FRL) — zoned schools average 67% FRL vs 24% district-wide (43 pts higher); higher-poverty schools than district average — tighter screening recommended.
- Market conditions: Rents rising fast (+7.1%/yr); 159 active listings in the ZIP; 11 comparable units currently listed for rent nearby; rentals lingering (median 45d on market — plan ~5-8 weeks vacancy on turnover, expect pricing pressure); 55% of comp listings sitting > 30 days — soft ceiling on asking rent; high-income renter base; 803 units permitted in Harford County in 2024 (26 in 5+ unit buildings).
Forward outlook
- Local home prices are declining (-3.0%/yr); year-one equity from $2k of loan paydown is wiped out by about $8k of value loss. Plan a longer hold.
Negotiation context
- It's been on market 39 days — a 3% lower offer ($272k) is reasonable based on typical stale-listing flexibility.
- 2 sale attempts since 7y ago; this cycle's ask has dropped $19k (6%) from the opening price — seller is motivated, your offer sets the floor, not the list.
- Current owner paid $175k; list at $280k implies a 60% gain — meaningful room to come down on a strong offer.
Risks & watch-outs
- Climate carrying-cost: major wind risk, 27% chance of damaging wind over 30y; extreme-heat days projected 7→15/yr by 2055 (HVAC capex compounding) — expect insurance premiums to compound above CPI over the hold.
Questions for the listing agent
- What do current leases actually rent for vs. the listed asking? Can we see a recent rent roll and the last 12 months of T-12 income?
- It's been on market 39 days. Have you received any prior offers? Is the seller open to a 18% concession, seller financing, or rate buy-down credit?
- What does the HOA fee cover, when was the last increase, and are there any pending special assessments or reserve-fund shortfalls?
- Is there a deadline driving the sale (1031 exchange, divorce, estate, relocation)? That informs how much negotiation room exists.
- The area grade is low — what's the realistic commute time and amenity access for the typical tenant pool here? Any planned neighborhood developments (good or bad) we should know about?
- What's the average days-on-market for RENTAL listings here right now (not sales)? A rising rental-DOM trend means longer vacancies and softer asking-rent achievability than the comps imply.
- What's the recent tenant-quality profile in this submarket — average credit score on applications, eviction rate, late-payment / NSF rate, and stable-employment percentage? A property-management company in the area should have these aggregated.
- How much new for-sale + rental construction is in the pipeline within 1–3 miles? Heavy new supply typically softens prices + rents 12–24 months out; constrained supply supports both.
Investment metrics
- 1% rule
- 0.82% ✗
- Cap rate
- 6.02%
- Cash-on-cash
- -0.98%
- DSCR
- 0.96
- GRM
- 10.2
CMA / ARV
- ARV (median comp)
- $291,603
- List price
- $280,000
- Delta
- -3.98%
- Verdict
- FAIR
- Comps
- 20 within 1.0 mi
Show comp detail 6 sales within ~0.75 mi
| Address | Dist | Beds/Ba | Sqft | Sold | Price | $/sf | Match |
|---|---|---|---|---|---|---|---|
| 1124 Splashing Brook Dr | 0.47mi | 3/3.0 | 1,456 (-4%) | 1mo | $290,500 | $200 | 69 |
| 1232 Splashing Brook Dr | 0.31mi | 3/2.5 | 1,407 (-7%) | 10mo | $317,000 | $225 | 66 |
| 1152 Splashing Brook Dr | 0.42mi | 3/3.5 | 1,596 (+6%) | 9mo | $275,000 | $172 | 60 |
| 1123 Splashing Brook Dr | 0.47mi | 2/2.0 (-1) | 1,488 (-2%) | 11mo | $290,000 | $195 | 59 |
| 3903 Bush Ct | 0.10mi | 2/1.5 (-1) | 1,374 (-9%) | 20mo | $302,500 | $220 | 55 |
| 3830 Copper Beech Dr | 0.27mi | 4/2.5 (+1) | 1,730 (+15%) | 10mo | $330,000 | $191 | 50 |
Match score weights: distance 35% · size 25% · config 20% · recency 20%. Top-matched comps best support the ARV.
Projected returns pro-forma
-3.0% appreciation · 7.12% rent growth · sell at horizon
- IRR
- -13.6%
- Equity multiple
- 0.49×
- Total profit
- $-39,615
- Equity at exit
- $41,749
- IRR
- 0.7%
- Equity multiple
- 1.05×
- Total profit
- $4,247
- Equity at exit
- $24,209
Cash invested: $78,400 (down + closing). Projections, not guarantees.
Landlord ↔ Tenant lean methodology
- Overall (STATE)
- 27 Tenant-Leaning
- State Maryland
- 27 Tenant-Leaning · D+14
- County
- — inherits STATE
- City
- — inherits STATE
ZIP-level market 21009
- Rents YoY
- 7.1%
- Active inventory
- 159
- Price-to-rent
- 10.2×
Monthly cashflow live
- Estimated rent
- $2,283 high interval (Pro) →
- Mortgage (P&I)
- −$1,468
- Tax from tax record
- −$185 /mo · $2,221/yr
- Insurance
- −$117
- HOA
- −$98
- Vacancy / Maint / Mgmt
- −$480
- Net cashflow
- $-64
Break-even live
Sensitivity live
| Price | -10% $94 | -5% $15 | +0% $-64 | +5% $-144 | +10% $-223 |
|---|---|---|---|---|---|
| Rent | -10% $-245 | -5% $-154 | +0% $-64 | +5% $26 | +10% $116 |
| Rate | -1.0pp $77 | -0.5pp $7 | base $-64 | +0.5pp $-137 | +1.0pp $-211 |
UW: 25.0% down · 7.5% · 30yr · 1.5% tax · 5.0% vac · 8.0% maint · 8.0% mgmt
Financing live
Cash to close
- Down payment
- $70,000
- Closing costs
- $8,400
- Reserves months
- —
- Total cash needed
- —
Loan-product check · same deal, 3 products live
Conventional
25% down · 7.5% · 30yr
- Down + closing
- —
- Monthly P&I
- —
- Monthly cashflow
- —
- DSCR
- —
- Eligible?
- —
Personal DTI + credit; lowest rate.
DSCR
20% down · 8.5% · 30yr
- Down + closing
- —
- Monthly P&I
- —
- Monthly cashflow
- —
- DSCR
- —
- Eligible?
- —
No personal income docs; deal must DSCR.
Hard money
10% down · 12.0% · 12mo
- Down + closing
- —
- Monthly P&I
- —
- Monthly cashflow
- —
- DSCR
- —
- Eligible?
- —
Short-term bridge; refi at stabilization.
Rent comps 11 comps
| Address | Beds | Baths | Sqft | Rent | $/sqft | DOM | Units | Dist |
|---|---|---|---|---|---|---|---|---|
| 1427 Sedum Sq Belcamp, MD | 4.0 | 2.5 | 2010 | $2,500 | $1.24 | 5d | 1 | 0.87mi |
| 1414 Primrose Pl Belcamp, MD | 2.0 | 1.5 | 1664 | $1,750 | $1.05 | 45d | 1 | 0.99mi |
| 1300 Liriope Ct Belcamp, MD | 1.0–3.0 | 1.0–2.0 | 974 | $2,249 | $2.31 | 44d | 32 | 1.00mi |
| 1300 Liriope Ct Belcamp, MD | 1.0–3.0 | 1.0–2.0 | 974 | $2,280 | $2.34 | 4d | 19 | 1.00mi |
| 4307 Greys Run Cir Belcamp, MD | 3.0 | 1.5 | 1605 | $2,600 | $1.62 | 44d | 1 | 1.07mi |
| 1402 Golden Rod Ct #5 Belcamp, MD | 2.0 | 2.0 | 1100 | $1,650 | $1.50 | 44d | 1 | 1.08mi |
| 1303 Sandwort Ct #102 Belcamp, MD | 3.0 | 2.0 | 1232 | $2,200 | $1.79 | 18d | 1 | 1.08mi |
| 1250 Independence Sq Belcamp, MD | 3.0 | 1.5 | 1152 | $1,950 | $1.69 | 44d | 1 | 1.22mi |
| 4203 Chapel Gate Pl Belcamp, MD | 3.0 | 2.5 | 1236 | $2,419 | $1.96 | 5d | 1 | 1.32mi |
| 1335 Stockett Sq Belcamp, MD | 3.0 | 1.5 | 1152 | $1,950 | $1.69 | 44d | 1 | 1.35mi |
| 2786 Megan Way Bel Air, MD | 1.0–2.0 | 1.0–2.0 | 1092 | $2,490 | $2.28 | 3d | 31 | 1.48mi |
HOA detail
- Monthly dues
- $98 · $1,176/yr
Listing history 21 events
-
2026-06-17status $280,000 Pending 39 DOM
-
2026-06-16days on market $280,000 Active 39 DOM
-
2026-06-15days on market $280,000 Active 38 DOM
-
2026-06-13pricedays on market $280,000 Active 36 DOM
-
2026-06-09days on market $292,500 Active 32 DOM
-
2026-06-08days on market $292,500 Active 31 DOM
-
2026-06-07days on market $292,500 Active 30 DOM
-
2026-06-04days on market $292,500 Active 27 DOM
-
2026-06-03days on market $292,500 Active 26 DOM
-
2026-06-02pricedays on market $292,500 Active 25 DOM
-
2026-06-01days on market $299,000 Active 24 DOM
-
2026-05-31days on market $299,000 Active 23 DOM
-
2026-05-09$299,000 Active 2003-char remark
-
2026-05-07historical $299,000 2003-char remark
-
2019-12-31soldstatus $175,000
-
2019-12-13soldstatus $175,000 Closed 381-char remark
Show marketing remark (381 chars)
Gorgeous brickfront 3 BR 2.5 Bath townhome on quiet cul de sac backing to woods. Home has over 1100 sq. ft on main two levels. Large eat-in kitchen with hardwood floors. Master bedroom with cathedral ceiling & walk in closet. Spacious, finished walk out lower level. Great deck & fenced in backyard with 10x8 shed. Community park with playground across the street. 10++
-
2019-10-30status Pending 381-char remark
Show marketing remark (381 chars)
Gorgeous brickfront 3 BR 2.5 Bath townhome on quiet cul de sac backing to woods. Home has over 1100 sq. ft on main two levels. Large eat-in kitchen with hardwood floors. Master bedroom with cathedral ceiling & walk in closet. Spacious, finished walk out lower level. Great deck & fenced in backyard with 10x8 shed. Community park with playground across the street. 10++
-
2019-10-26price $175,000 381-char remark
Show marketing remark (381 chars)
Gorgeous brickfront 3 BR 2.5 Bath townhome on quiet cul de sac backing to woods. Home has over 1100 sq. ft on main two levels. Large eat-in kitchen with hardwood floors. Master bedroom with cathedral ceiling & walk in closet. Spacious, finished walk out lower level. Great deck & fenced in backyard with 10x8 shed. Community park with playground across the street. 10++
-
2019-10-17$179,900 Active 381-char remark
Show marketing remark (381 chars)
Gorgeous brickfront 3 BR 2.5 Bath townhome on quiet cul de sac backing to woods. Home has over 1100 sq. ft on main two levels. Large eat-in kitchen with hardwood floors. Master bedroom with cathedral ceiling & walk in closet. Spacious, finished walk out lower level. Great deck & fenced in backyard with 10x8 shed. Community park with playground across the street. 10++
-
1997-11-20soldstatus $92,160
-
1997-06-30soldstatus $212,160
ⓘ Source: listings_history table (triggers on properties + properties_extension) + one-shot
backfill from property_details.listing_events for pre-trigger history.
Tax reassessment forecast MD · Partial reset (capped growth)
- Current annual tax
- $2,221 · $185/mo
- Projected year-2 tax
- $2,637 · $220/mo
- Expected delta
- +$415/yr (+$35/mo · 18.7%)
ⓘ Screening estimate from a state-policy table — verify with the county assessor before closing.
Climate risk First Street
- Flood 1/10 Low FEMA zone X (unshaded) · 0% chance over 30 yrs
- Wildfire 2/10 Low
- Heat 7/10 Severe 7 d/yr ≥104°F today · 15 d/yr by 30 yrs out
- Wind 6/10 Major 27% chance of damaging wind over 30 yrs
- Air quality 3/10 Moderate 2 unhealthy d/yr today · 3 by 30 yrs out
Nearby sold comps map
Loading sold comps map…
Walkable amenities ~0.75 mi
Loading nearby amenities…
Taxation est. · year 1
- Rental income
- $27,400
- − Mortgage interest
- −$15,684
- − Property taxes
- −$2,221
- − Insurance
- −$1,400
- − Repairs & maintenance
- −$2,192
- − Management
- −$2,192
- − HOA
- −$1,176
- − Depreciation
- −$8,145
- Taxable loss
- −$5,611
- Est. tax savings @ 24.0%
- +$1,347
- After-tax cash flow
- $575/yr
For passive investors: Depreciation is non-cash, so a rental often shows a tax loss while cash-flowing — sheltering income. Rental losses are passive: they offset passive income freely, and up to $25,000/yr can offset ordinary (W-2) income if you actively participate and your MAGI is under $100k (phasing out to $0 by $150k); unused losses carry forward. On sale, claimed depreciation is recaptured at up to 25%, and gains may owe capital-gains tax (a 1031 exchange can defer both). Figures are a year-1 estimate at your 24.0% rate — not tax advice; consult a CPA.
Schools (NCES district)
- District
- Harford County Public Schools
- NCES district ID
- 2400390
- Math proficiency
- 22% ▼ -23.00%
- Reading proficiency
- 39% ▼ -12.00%
- Median HH income
- $79,569
- Composite
- 29.38/100
- National rank
- #6527
- State rank
- #9 of 24 in MD
Livability — Abingdon
No livability data for this city. (Only ~50 U.S. cities are tracked.)
Census & demographics
- Census place
- Abingdon, MD
- County
- Harford County · 198,512 people
- City population
- 33,679
- Metro
- Baltimore-Columbia-Towson, MD
- Population (ZIP)
- 33,679
- Household income
- $121,660
- Rent vs Own
- Severe rent burden
- 437.0
Population outlook (Harford County) Hauer SSP2
- Today (2025)
- 262,292 people
- By 2030
- 266,437 · +1.6%
- By 2040
- 269,954 · +2.9%
- By 2050
- 265,659 · +1.3%
- By 2075
- 252,886 · -3.6%
- By 2100
- 224,014 · -14.6%
Race, ethnicity, and origin ACS 2023
- Neighborhood character
- Predominantly White (68%)
- Race & ethnicity
- White 68% Black 18% Hispanic / Latino 6% Asian 4% Two or more races 4%
- Hispanic origin (detail)
- Mexican 2% Puerto Rican 1%
- Common ancestry
- Romanian 5% Lithuanian 2% Slovak 2%
- Foreign-born
- 7% · Canada, South Korea, China
- Languages at home
- 89% English-only · Spanish 3% Other Indo-European 2% Other Asian/Pacific 1%
Political lean MEDSL · Harford
- 2024 margin
- R (+13.8) · D 41.9% · R 55.7% · Other 2.4%
- 2008→2024 swing
- +5.0pp toward D · 2008: -18.8pp · 2024: -13.8pp
- All cycles
- 2024: R+13.8 2020: R+12.0 2016: R+24.5 2012: R+19.5 2008: R+18.8
Not yet ingested
- Civics
- —
Market trends
- HPI YoY
- ▼ -176.25%
- Current HPI
- 251.4376
- Rent YoY
- ▲ 7.12%
- Metro
- Baltimore-Columbia-Towson, MD
- State GDP YoY
- ▲ 2.97%
- F500 in state
- 12
Industry mix (Fortune 500 HQ in MD)
| Industry | F500 HQs | Revenue |
|---|---|---|
| Aerospace / Defense | 1 | $71B |
|
||
| Utilities | 1 | $25B |
|
||
| Hotels | 1 | $24B |
|
||
| Consumer Goods | 1 | $7B |
|
||
| Real Estate | 1 | $6B |
|
||
| Chemicals | 1 | $2B |
|
||
Price history
+32.0% since first listed12 events — show timeline
- 2026-06-16 Pending — BRIGHT MLS
- 2026-06-10 Price Changed $280,000 BRIGHT MLS
- 2026-06-03 Price Changed $292,500 BRIGHT MLS
- 2026-05-09 Listed $299,000 BRIGHT MLS
- 2026-05-07 Coming Soon $299,000 BRIGHT MLS
- 2019-12-31 Sold (Public Records) $175,000 Public Records
- 2019-12-13 Sold (MLS) $175,000 BRIGHT MLS
- 2019-10-30 Pending — BRIGHT MLS
- 2019-10-26 Price Changed $175,000 BRIGHT MLS
- 2019-10-17 Listed $179,900 BRIGHT MLS
- 1997-11-20 Sold (Public Records) $92,160 Public Records
- 1997-06-30 Sold (Public Records) $212,160 Public Records
Property tax history
+2.5%/yrLatest (2025): $2,221 · +7.8% YoY. Source: county tax records.
Cash-flow waterfall
monthlySold comps — $/sqft
last 12 mo · ≤1 miLoading sold comps…