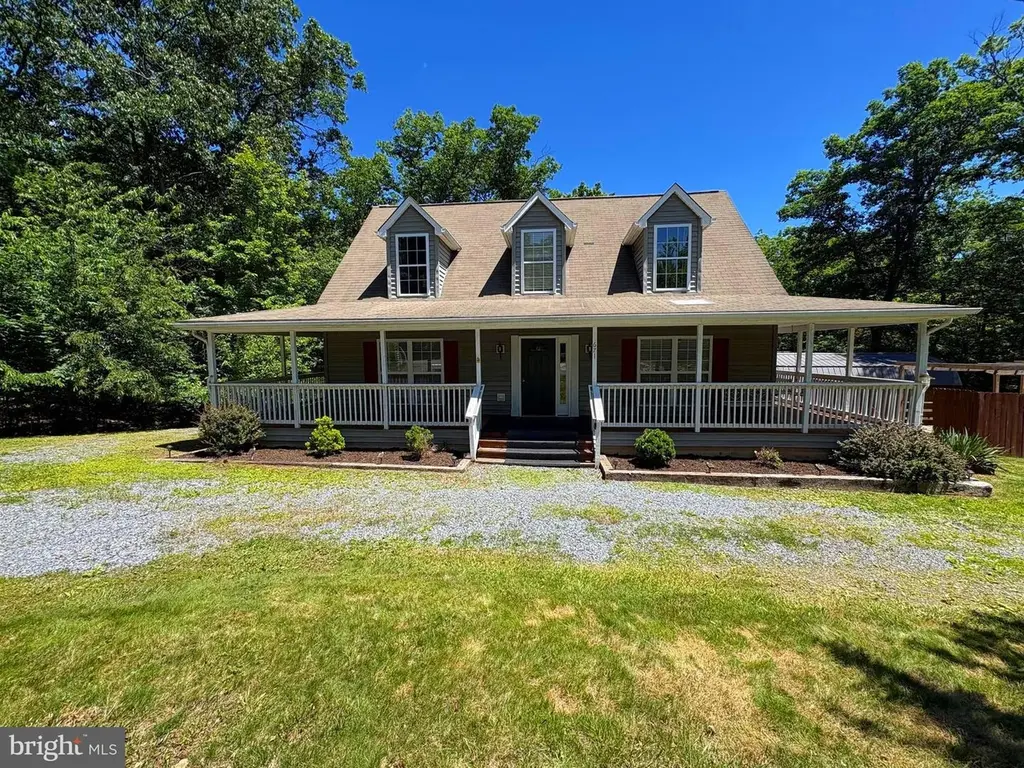
671 Willow Ln · Basye, VA
Flood risk 1/10 · Minimal
- FEMA flood zone
- X (unshaded)
- Chance of flooding over 30 yrs
- 0.0%
- Est. flood insurance / yr
- $507 – $1,088
Fire risk 4/10 · Minor
- Est. fire insurance / yr
- $666 – $1,236
Heat risk 4/10 · Minor
- Hot days now (above 99°F)
- 7 days/yr
- Hot days in 30 yrs
- 17 days/yr
Wind risk 2/10 · Minimal
- Chance of severe wind over 30 yrs
- 0.0%
Air-quality risk 1/10 · Minimal
- Unhealthy air days now
- 0 days/yr
- Unhealthy air days in 30 yrs
- 0 days/yr
Risk factors via First Street. Map © Google.
Why this score? — see what drove the D grade
The composite is a weighted blend of 9 inputs, each scored 0–100. Each bar is that input's sub-score; the figure is the points it added to the 100-point composite (weight × sub-score).
- Appreciation +10.0/10.0
- ARV discount +9.1/15.0
- Cash flow +6.7/30.0
- Schools +4.4/10.0
- Livability +3.3/5.0
- Rent growth +2.5/5.0
- Condition / age +2.5/5.0
- DSCR +1.0/10.0
- 1% rule +0.8/10.0
$369,000
🖨 Deal sheet (PDF) 📄 Offer letter ✓ Due diligence
Listing remarks MLS
- ON BRYCE RESORT - " Willow Haven" - Cozy Cape Cod with fenced in yard and workshop . The workshop is finished and has electric. Yes the main level has a primary bedroom and bath - 3BR/2.5 BA - Upper level has two bedrooms and a full bath and sitting room. Just an easy home to maintain. Want a FLAT yard? This is the one for you! The circular drive makes it easy to come and go. You will enjoy your special outside area with boxes ready for you to plant your garden come spring. Great area for the persons that like to grow their own food. Easy access and ready for you to enjoy. Less than 10 minutes to Bryce Resort - Skiing, Snow Tubing, Mountain Bike, Zipline, Golf, Lake, Swimming, Hiking, Pools. Tennis Courts. Furniture does not convey. This is a modular home where sections are built in a rain free environment factory and transported in sections and assembled by the builder. Vent less gas fireplace does not have propane on property. Owners didn't use it.
Key facts
- 0.28 acre lot
- 5 parking spots
- Community pool
Property features AI
Finance
- Other: Ground rent paid annually
- HOA & community: HOA fee paid annually; HOA fee includes trash, road maintenance, and snow removal; Community amenities: pool membership available, golf course membership available; Road responsibility: HOA
Exterior
- Parking: Five total garage and parking spaces; Driveway parking (circular and gravel) with five driveway spaces
- Utilities: Public water; Public sewer; Electric service
- Home design: Detached property; Very good condition; Fee simple ownership; Assessor-sourced year built
- Construction: Vinyl siding; Block foundation; Shingle roof; Building not winterized
- Exterior features: Porch(es); Deck(s); Outbuilding(s); Shed/shop; Board fencing; Trees/wooded lot; Level lot; Community pool
Interior
- Kitchen: Stove; Microwave; Refrigerator; Dishwasher
- Bedrooms: One bedroom on the main level; Two bedrooms on the upper level
- Flooring: Wood flooring; Carpet
- Bathrooms: Two full bathrooms; One half bathroom (main level)
- Heating & cooling: Heat pump and central heating; Central air conditioning; Ceiling fans; Electric heating and hot water
- Interior features: Open floor plan; Ceiling fan(s); Dining area; Entry-level bedroom; Drywall walls and ceilings; Insulated doors; Furnished
- Laundry & utility: Washer; Dryer; Main floor laundry
Neighborhood map
What this means for you Summary
Snapshot
- This is a 3-bed/2.5-bath single-family listed at $369k.
Deal economics
- At list price, monthly cash flow is $-587 ($-7k/yr) — negative.
- To cash-flow at today's rent, offer at most $265k (28.1% below list).
- To meet the 1% rule (rent ≥ 1% of price), the offer needs to be $215k (41.8% below list).
- Recommended offer: $215k (41.8% below list) — sets the bar for 1% rule.
- Cap rate 4.4% vs local median 2.2% in Basye — top-decile yield for the area; either an underpriced asset or a hidden risk that comps aren't pricing in. Stress-test before assuming the spread holds.
Location & tenants
- Location reads 66/100 on livability (#319 in VA) — a middle-class / working-renter tenant base. Strengths: crime A+, employment A+, housing A+; Watch: amenities F, commute F, health & safety D-.
- Shenandoah County Public School District (town): math 46% / reading 58% proficiency, ranked #91 of 131 in VA (top 70%) — acceptable for families but not a draw, mixed tenant base, ~2y average lease.
- Zoned schools: Honey Run Elementary (math 57% / reading 60%, grade B-, #576 of 1,108 statewide, top 52%, 564 students, 75% FRL); North Fork Middle (math 42% / reading 52%, grade D+, #257 of 342 statewide, top 77%, 350 students, 73% FRL); Mountain View High (math 54% / reading 65%, grade C+, #247 of 319 statewide, top 80%, 628 students, 74% FRL) — zoned schools average 74% FRL vs 37% district-wide (37 pts higher); higher-poverty schools than district average — tighter screening recommended.
- Market conditions: 52 active listings in the ZIP; 4 comparable units currently listed for rent nearby; rentals at typical pace (median 26d on market — plan ~3-4 weeks tenant-placement turnaround); 224 units permitted in Shenandoah County in 2024 (0 in 5+ unit buildings).
Forward outlook
- In year one you build about $39k of equity ($3k loan paydown + $37k appreciation (10.0% local appreciation)).
- Shenandoah County population projected at +5% by 2050 — modest demand growth; plan on rents tracking national, not racing it.
- By year 2, paydown + projected appreciation supports a ~$63k cash-out refi (75% LTV) — recoverable capital for the next deal without selling this one.
Negotiation context
- It's been on market 15 days — a 2% lower offer ($363k) is reasonable based on typical stale-listing flexibility.
- 2 sale attempts since 6y ago; this cycle's ask is 18350% above the opening price — seller raised mid-cycle; expect resistance to lowballs.
- Current owner paid $230k; list at $369k implies a 60% gain — meaningful room to come down on a strong offer.
Questions for the listing agent
- What do current leases actually rent for vs. the listed asking? Can we see a recent rent roll and the last 12 months of T-12 income?
- What does the HOA fee cover, when was the last increase, and are there any pending special assessments or reserve-fund shortfalls?
- Is there a deadline driving the sale (1031 exchange, divorce, estate, relocation)? That informs how much negotiation room exists.
- Schools are F-rated, which usually means shorter tenancies and higher turnover. Who's the typical renter profile here, and what's been the actual vacancy rate?
- The area grade is low — what's the realistic commute time and amenity access for the typical tenant pool here? Any planned neighborhood developments (good or bad) we should know about?
- What's the average days-on-market for RENTAL listings here right now (not sales)? A rising rental-DOM trend means longer vacancies and softer asking-rent achievability than the comps imply.
- What's the recent tenant-quality profile in this submarket — average credit score on applications, eviction rate, late-payment / NSF rate, and stable-employment percentage? A property-management company in the area should have these aggregated.
- How much new for-sale + rental construction is in the pipeline within 1–3 miles? Heavy new supply typically softens prices + rents 12–24 months out; constrained supply supports both.
Investment metrics
- 1% rule
- 0.58% ✗
- Cap rate
- 4.38%
- Cash-on-cash
- -6.82%
- DSCR
- 0.70
- GRM
- 14.3
CMA / ARV
- ARV (on-the-fly)
- $383,040
- Comps found
- 12
Show comp detail 12 sales within ~0.75 mi
| Address | Dist | Beds/Ba | Sqft | Sold | Price | $/sf | Match |
|---|---|---|---|---|---|---|---|
| 8650 Supinlick Ridge Rd | 0.11mi | 3/2.0 | 1,560 (-2%) | 6mo | $375,000 | $240 | 84 |
| 125 Crab Apple Rd | 0.19mi | 3/2.0 | 1,570 (-2%) | 6mo | $475,000 | $303 | 81 |
| 1355 Greenview Dr | 0.64mi | 3/2.5 | 1,536 (-4%) | 1mo | $525,000 | $342 | 63 |
| 185 Pin Oak Ln | 0.31mi | 3/2.5 | 1,492 (-6%) | 15mo | $325,000 | $218 | 62 |
| 172 Cottonwood Dr | 0.22mi | 3/2.0 | 1,380 (-14%) | 7mo | $345,000 | $250 | 59 |
| 1039 Quail Rd | 0.58mi | 3/2.0 | 1,646 (+3%) | 12mo | $300,500 | $183 | 56 |
| 739 Quail Rd | 0.47mi | 3/2.0 | 1,512 (-5%) | 16mo | $320,000 | $212 | 54 |
| 209 Beaver Rd | 0.47mi | 3/2.0 | 1,378 (-14%) | 8mo | $428,000 | $311 | 47 |
| 102 Bitternut Ln | 0.42mi | 4/2.0 (+1) | 1,728 (+8%) | 21mo | $349,000 | $202 | 42 |
| 4 Mulberry Ln | 0.47mi | 4/2.0 (+1) | 1,768 (+11%) | 14mo | $278,000 | $157 | 42 |
| 60 Pearl Pl | 0.67mi | 3/2.0 | 1,443 (-10%) | 14mo | $335,000 | $232 | 39 |
| 41 Moccasin Way | 0.56mi | 3/2.5 | 1,792 (+12%) | 21mo | $430,000 | $240 | 36 |
Match score weights: distance 35% · size 25% · config 20% · recency 20%. Top-matched comps best support the ARV.
Projected returns pro-forma
10.0% appreciation · 3.0% rent growth · sell at horizon
- IRR
- 19.4%
- Equity multiple
- 2.58×
- Total profit
- $163,457
- Equity at exit
- $332,424
- IRR
- 17.9%
- Equity multiple
- 5.94×
- Total profit
- $510,486
- Equity at exit
- $716,886
Cash invested: $103,320 (down + closing). Projections, not guarantees.
Landlord ↔ Tenant lean methodology
- Overall (STATE)
- 55 Moderately Landlord-Leaning
- State Virginia
- 55 Moderately Landlord-Leaning · D+2
- County
- — inherits STATE
- City
- — inherits STATE
ZIP-level market 22842
- Home prices YoY
- 13.7%
- Active inventory
- 52
- Price-to-rent
- 14.3×
Monthly cashflow live
- Estimated rent
- $2,146 medium interval (Pro) →
- Mortgage (P&I)
- −$1,935
- Tax from tax record
- −$130 /mo · $1,555/yr
- Insurance
- −$154
- HOA
- −$64
- Vacancy / Maint / Mgmt
- −$451
- Net cashflow
- $-587
Break-even live
Sensitivity live
| Price | -10% $-378 | -5% $-482 | +0% $-587 | +5% $-691 | +10% $-796 |
|---|---|---|---|---|---|
| Rent | -10% $-756 | -5% $-672 | +0% $-587 | +5% $-502 | +10% $-417 |
| Rate | -1.0pp $-401 | -0.5pp $-493 | base $-587 | +0.5pp $-682 | +1.0pp $-780 |
UW: 25.0% down · 7.5% · 30yr · 1.5% tax · 5.0% vac · 8.0% maint · 8.0% mgmt
Financing live
Cash to close
- Down payment
- $92,250
- Closing costs
- $11,070
- Reserves months
- —
- Total cash needed
- —
Loan-product check · same deal, 3 products live
Conventional
25% down · 7.5% · 30yr
- Down + closing
- —
- Monthly P&I
- —
- Monthly cashflow
- —
- DSCR
- —
- Eligible?
- —
Personal DTI + credit; lowest rate.
DSCR
20% down · 8.5% · 30yr
- Down + closing
- —
- Monthly P&I
- —
- Monthly cashflow
- —
- DSCR
- —
- Eligible?
- —
No personal income docs; deal must DSCR.
Hard money
10% down · 12.0% · 12mo
- Down + closing
- —
- Monthly P&I
- —
- Monthly cashflow
- —
- DSCR
- —
- Eligible?
- —
Short-term bridge; refi at stabilization.
Rent comps 4 comps
| Address | Beds | Baths | Sqft | Rent | $/sqft | DOM | Units | Dist |
|---|---|---|---|---|---|---|---|---|
| 671 Willow Ln Mount Jackson, VA | 3.0 | 2.5 | 2128 | $2,000 | $0.94 | 26d | 1 | 0.02mi |
| 32 Cherry St Mount Jackson, VA | 4.0 | 2.0 | 1248 | $1,700 | $1.36 | 45d | 1 | 0.14mi |
| 602 Sycamore Rd Mount Jackson, VA | 4.0 | 2.0 | 1777 | $2,849 | $1.60 | 20d | 1 | 0.14mi |
| 8148 Supinlick Ridge Rd Unit A Mt Jackson, VA | 3.0 | 2.0 | 1260 | $1,600 | $1.27 | 21d | 1 | 0.50mi |
HOA detail
- Monthly dues
- $64 · $768/yr
- Likely covers
- gaselectricpool
Listing history 13 events
-
2026-06-21days on market $369,000 Active 15 DOM
-
2026-06-18days on market $369,000 Active 12 DOM
-
2026-06-17days on market $369,000 Active 11 DOM
-
2026-06-16days on market $369,000 Active 10 DOM
-
2026-06-15days on market $369,000 Active 9 DOM
-
2026-06-13days on market $369,000 Active 7 DOM
-
2026-06-13days on market $369,000 Active 6 DOM
-
2026-06-09days on market $369,000 Active 3 DOM
-
2026-06-08days on market $369,000 Active 2 DOM
-
2026-06-07statusdays on market $369,000 Active 1 DOM
-
2026-06-04days on market $369,000 Coming Soon 2 DOM
-
2026-06-03remarks 689-char remark
-
2026-06-03$369,000 Coming Soon 1 DOM
ⓘ Source: listings_history table (triggers on properties + properties_extension) + one-shot
backfill from property_details.listing_events for pre-trigger history.
Tax reassessment forecast VA · Resets to sale price
- Current annual tax
- $1,555 · $130/mo
- Projected year-2 tax
- $3,026 · $252/mo
- Expected delta
- +$1,471/yr (+$123/mo · 94.6%)
ⓘ Screening estimate from a state-policy table — verify with the county assessor before closing.
Climate risk First Street
- Flood 1/10 Low FEMA zone X (unshaded) · 0% chance over 30 yrs
- Wildfire 4/10 Moderate
- Heat 4/10 Moderate 7 d/yr ≥99°F today · 17 d/yr by 30 yrs out
- Wind 2/10 Low 0% chance of damaging wind over 30 yrs
- Air quality 1/10 Low 0 unhealthy d/yr today · 0 by 30 yrs out
Nearby sold comps map
Loading sold comps map…
Walkable amenities ~0.75 mi
Loading nearby amenities…
Taxation est. · year 1
- Rental income
- $25,755
- − Mortgage interest
- −$20,670
- − Property taxes
- −$1,555
- − Insurance
- −$1,845
- − Repairs & maintenance
- −$2,060
- − Management
- −$2,060
- − HOA
- −$768
- − Depreciation
- −$10,735
- Taxable loss
- −$13,938
- Est. tax savings @ 24.0%
- +$3,345
- After-tax cash flow
- $-3,697/yr
For passive investors: Depreciation is non-cash, so a rental often shows a tax loss while cash-flowing — sheltering income. Rental losses are passive: they offset passive income freely, and up to $25,000/yr can offset ordinary (W-2) income if you actively participate and your MAGI is under $100k (phasing out to $0 by $150k); unused losses carry forward. On sale, claimed depreciation is recaptured at up to 25%, and gains may owe capital-gains tax (a 1031 exchange can defer both). Figures are a year-1 estimate at your 24.0% rate — not tax advice; consult a CPA.
Schools (NCES district)
- District
- Shenandoah County Public School District
- NCES district ID
- 5103510
- Math proficiency
- 46% ▼ -30.00%
- Reading proficiency
- 58% ▼ -9.00%
- Median HH income
- $50,207
- Composite
- 44.42/100
- National rank
- #2811
- State rank
- #91 of 131 in VA
Livability — Basye
- Score
- 66/100
- State rank
- #319
- US rank
- #11652
Category grades
Schools grade is shown separately in the Schools card above.
Census & demographics
- Census place
- Basye, VA
- Population (ZIP)
- 5,763
Population outlook (Shenandoah County) Hauer SSP2
- Today (2025)
- 44,891 people
- By 2030
- 45,630 · +1.6%
- By 2040
- 46,708 · +4.0%
- By 2050
- 47,072 · +4.9%
- By 2075
- 47,418 · +5.6%
- By 2100
- 43,707 · -2.6%
Race, ethnicity, and origin ACS 2023
- Neighborhood character
- Predominantly White (81%)
- Race & ethnicity
- White 81% Hispanic / Latino 14% Two or more races 5% Black 2%
- Hispanic origin (detail)
- Mexican 6%
- Common ancestry
- Slovak 1% Serbian 1% Portuguese 1%
- Foreign-born
- 8% · Canada, South Korea
- Languages at home
- 86% English-only · Spanish 12% Russian/Polish/Slavic 1%
Political lean MEDSL · Shenandoah
- 2024 margin
- Solid R (+42.2) · D 28.4% · R 70.6% · Other 1.0%
- 2008→2024 swing
- -15.8pp toward R · 2008: -26.5pp · 2024: -42.2pp
- All cycles
- 2024: R+42.2 2020: R+40.6 2016: R+43.3 2012: R+31.4 2008: R+26.5
Not yet ingested
- Civics
- —
Market trends
- HPI YoY
- ▲ 42.64%
- Current HPI
- 353.3603
- Rent YoY
- —
- Metro
- —
- State GDP YoY
- ▲ 2.40%
- F500 in state
- 50
Industry mix (Fortune 500 HQ in VA)
| Industry | F500 HQs | Revenue |
|---|---|---|
| Aerospace / Defense | 4 | $236B |
|
||
| Technology / Defense | 3 | $32B |
|
||
| Financial Services | 2 | $176B |
|
||
| Utilities | 2 | $27B |
|
||
| Insurance | 2 | $25B |
|
||
| Technology | 2 | $15B |
|
||
Price history
+94.2% since first listed8 events — show timeline
- 2026-06-02 Coming Soon $369,000 BRIGHT MLS
- 2026-05-31 Rental Removed $2,000 BRIGHTMLS
- 2026-05-17 Listed for Rent $2,000 BRIGHTMLS
- 2021-02-02 Sold (Public Records) $230,000 Public Records
- 2021-01-29 Sold (MLS) $230,000 BRIGHT MLS
- 2020-12-27 Contingent — BRIGHT MLS
- 2020-12-16 Listed $229,000 BRIGHT MLS
- 2009-11-24 Sold (Public Records) $190,000 Public Records
Property tax history
+3.4%/yrLatest (2025): $1,555 · +0.0% YoY. Source: county tax records.
Cash-flow waterfall
monthlySold comps — $/sqft
last 12 mo · ≤1 miLoading sold comps…