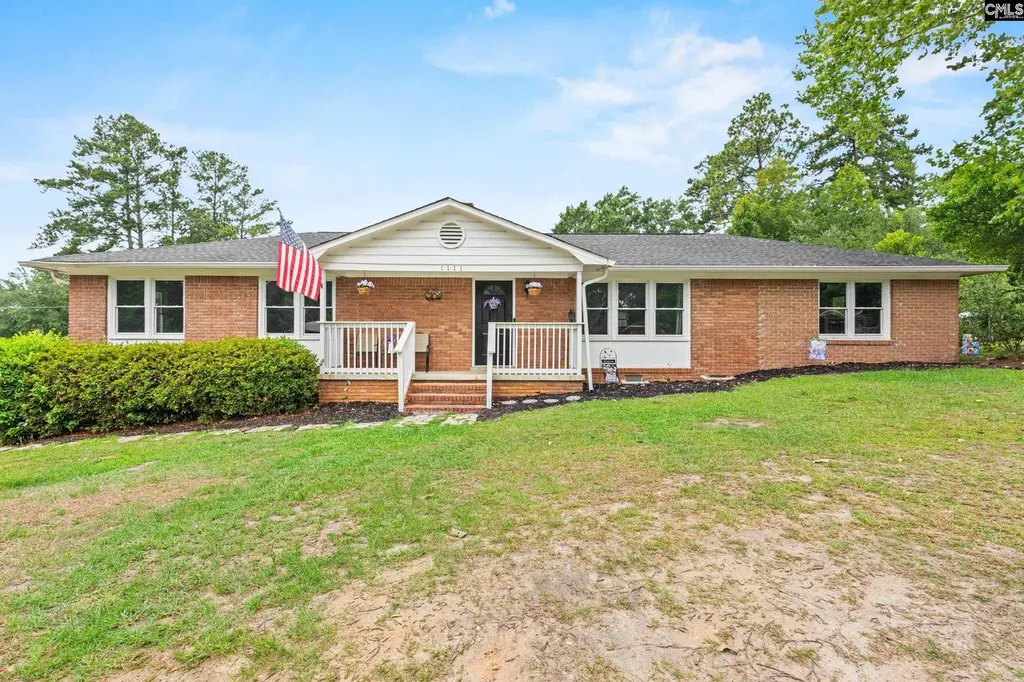
1111 Price Cir · West Columbia, SC
Flood risk 1/10 · Minimal
- FEMA flood zone
- X (unshaded)
- Chance of flooding over 30 yrs
- 0.0%
- Est. flood insurance / yr
- $507 – $1,088
Fire risk 2/10 · Minimal
- Est. fire insurance / yr
- $783 – $1,453
Heat risk 7/10 · Major
- Hot days now (above 108°F)
- 7 days/yr
- Hot days in 30 yrs
- 16 days/yr
Wind risk 6/10 · Moderate
- Chance of severe wind over 30 yrs
- 68.0%
Air-quality risk 3/10 · Minor
- Unhealthy air days now
- 2 days/yr
- Unhealthy air days in 30 yrs
- 2 days/yr
Risk factors via First Street. Map © Google.
Why this score? — see what drove the F grade
The composite is a weighted blend of 9 inputs, each scored 0–100. Each bar is that input's sub-score; the figure is the points it added to the 100-point composite (weight × sub-score).
- ARV discount +7.5/15.0
- Cash flow +7.0/30.0
- Rent growth +3.4/5.0
- Livability +3.2/5.0
- Schools +2.9/10.0
- Condition / age +2.5/5.0
- DSCR +1.2/10.0
- 1% rule +0.7/10.0
- Appreciation +0.0/10.0
$244,000
🖨 Deal sheet (PDF) 📄 Offer letter ✓ Due diligence
Listing remarks
Welcome to 1111 Price Circle, a beautifully maintained all-brick ranch nestled in the established Brookwood community of West Columbia. Offering 3 bedrooms, 2 full bathrooms, and over 1,800 square feet of living space, this charming home combines classic character with modern comfort on a spacious . 29-acre lot. The property features a detached two-car garage, mature landscaping, and a large backyard perfect for entertaining, gardening, or simply enjoying the outdoors. Step inside to discover a warm and inviting floor plan filled with natural light. The spacious living areas provide plenty of room for gathering with family and friends, while the cozy fireplace creates the perfect focal poin
Key facts
- All brick ranch
- Large backyard
- Well designed layout
Tags
Property features AI
Exterior
- Parking: Detached 2-car garage
- Utilities: Public sewer; Public water
- Home design: Single-story (1 story); Crawlspace foundation
- Construction: Brick-all-sides exterior; Crawlspace foundation
- Exterior features: Brick exterior above foundation; Chain link fencing; Paved road access; Public water
Interior
- Kitchen: Eat-in kitchen with island; Stained wood cabinets; Tile flooring in kitchen
- Bedrooms: Master bedroom on main level with ceiling fan and hardwood floors; Bedroom 2 on main level with private closet and hardwood floors; Bedroom 3 on main level with private closet and hardwood floors
- Flooring: Hardwood flooring in great room and bedrooms; Tile flooring in kitchen
- Bathrooms: Two full bathrooms
- Heating & cooling: Central air conditioning; Electric heating
- Interior features: One fireplace; Recessed lighting throughout great room and kitchen; Hardwood floors in great room and bedrooms
- Laundry & utility: Washer and dryer area on main level
Neighborhood map
What this means for you Summary
Snapshot
- This is a 3-bed/2.0-bath single-family listed at $244k.
Deal economics
- At list price, monthly cash flow is $-357 ($-4k/yr) — negative.
- To cash-flow at today's rent, offer at most $181k (25.8% below list).
- To meet the 1% rule (rent ≥ 1% of price), the offer needs to be $138k (43.3% below list).
- Recommended offer: $138k (43.3% below list) — sets the bar for 1% rule.
Location & tenants
- Location reads 63/100 on livability (#168 in SC) — a middle-class / working-renter tenant base. Strengths: cost of living A+, housing A+, health & safety A+; Watch: employment D+, crime F, commute F.
- Lexington 02 (suburban): math 30% / reading 38% proficiency, ranked #45 of 80 in SC (top 56%) — families likely to look elsewhere, expect single-tenant / working-renter base with shorter leases.
- Zoned schools: Cayce Elementary (math 24% / reading 22%, grade F, #469 of 597 statewide, top 79%, 998 students, 100% FRL); Cyril B. Busbee Creative Arts Academy (math 24% / reading 28%, grade F, #159 of 229 statewide, top 70%, 420 students, 100% FRL); Brookland-Cayce High (math 32% / reading 77%, grade C-, #130 of 196 statewide, top 69%, 1,171 students, 100% FRL) — zoned schools average 100% FRL vs 59% district-wide (41 pts higher); higher-poverty schools than district average — tighter screening recommended.
- Market conditions: Rents rising (+3.5%/yr); 136 active listings in the ZIP; 15 comparable units currently listed for rent nearby; rentals at typical pace (median 23d on market — plan ~3-4 weeks tenant-placement turnaround); 1,712 units permitted in Lexington County in 2024 (0 in 5+ unit buildings).
Forward outlook
- Local home prices are declining (-3.0%/yr); year-one equity from $2k of loan paydown is wiped out by about $7k of value loss. Plan a longer hold.
- Lexington County population projected at +26% by 2050 — long-run rental-demand tailwind backs the buy-and-hold thesis.
Negotiation context
- Only 4 days on market — expect competitive offers; lowballing is unlikely to land.
- 6 sale attempts since 2y ago with the ask held roughly flat each time — persistent listings suggest the price (not the market) is what's stuck; bring a comps-based counter.
Risks & watch-outs
- Climate carrying-cost: major wind risk, 68% chance of damaging wind over 30y; extreme-heat days projected 7→16/yr by 2055 (HVAC capex compounding) — expect insurance premiums to compound above CPI over the hold.
Questions for the listing agent
- What do current leases actually rent for vs. the listed asking? Can we see a recent rent roll and the last 12 months of T-12 income?
- Built in 1963 — when were the roof, HVAC, electrical panel, plumbing, and water heater last replaced?
- Is there a deadline driving the sale (1031 exchange, divorce, estate, relocation)? That informs how much negotiation room exists.
- Schools are D-rated, which usually means shorter tenancies and higher turnover. Who's the typical renter profile here, and what's been the actual vacancy rate?
- Crime grade is F in this area — have there been break-ins, vandalism, or insurance claims at this property in the last 3 years? What carrier currently insures it and at what premium?
- The area grade is low — what's the realistic commute time and amenity access for the typical tenant pool here? Any planned neighborhood developments (good or bad) we should know about?
- What's the average days-on-market for RENTAL listings here right now (not sales)? A rising rental-DOM trend means longer vacancies and softer asking-rent achievability than the comps imply.
- What's the recent tenant-quality profile in this submarket — average credit score on applications, eviction rate, late-payment / NSF rate, and stable-employment percentage? A property-management company in the area should have these aggregated.
- How much new for-sale + rental construction is in the pipeline within 1–3 miles? Heavy new supply typically softens prices + rents 12–24 months out; constrained supply supports both.
Investment metrics
- 1% rule
- 0.57% ✗
- Cap rate
- 4.54%
- Cash-on-cash
- -6.27%
- DSCR
- 0.72
- GRM
- 14.7
CMA / ARV
No comps found within radius.
Projected returns pro-forma
-3.0% appreciation · 3.48% rent growth · sell at horizon
- IRR
- -26.7%
- Equity multiple
- 0.10×
- Total profit
- $-61,716
- Equity at exit
- $36,381
- IRR
- -23.1%
- Equity multiple
- -0.18×
- Total profit
- $-80,729
- Equity at exit
- $21,097
Cash invested: $68,320 (down + closing). Projections, not guarantees.
Landlord ↔ Tenant lean methodology
- Overall (STATE)
- 90 Strongly Landlord-Friendly
- State South Carolina
- 90 Strongly Landlord-Friendly · R+6
- County
- — inherits STATE
- City
- — inherits STATE
ZIP-level market 29169
- Home prices YoY
- -15.8%
- Rents YoY
- 3.5%
- Active inventory
- 136
- Price-to-rent
- 14.7×
Monthly cashflow live
- Estimated rent
- $1,383 high interval (Pro) →
- Mortgage (P&I)
- −$1,280
- Tax from tax record
- −$68 /mo · $816/yr
- Insurance
- −$102
- HOA
- −$0
- Vacancy / Maint / Mgmt
- −$290
- Net cashflow
- $-357
Break-even live
Sensitivity live
| Price | -10% $-219 | -5% $-288 | +0% $-357 | +5% $-426 | +10% $-495 |
|---|---|---|---|---|---|
| Rent | -10% $-466 | -5% $-411 | +0% $-357 | +5% $-302 | +10% $-248 |
| Rate | -1.0pp $-234 | -0.5pp $-295 | base $-357 | +0.5pp $-420 | +1.0pp $-484 |
UW: 25.0% down · 7.5% · 30yr · 1.5% tax · 5.0% vac · 8.0% maint · 8.0% mgmt
Financing live
Cash to close
- Down payment
- $61,000
- Closing costs
- $7,320
- Reserves months
- —
- Total cash needed
- —
Loan-product check · same deal, 3 products live
Conventional
25% down · 7.5% · 30yr
- Down + closing
- —
- Monthly P&I
- —
- Monthly cashflow
- —
- DSCR
- —
- Eligible?
- —
Personal DTI + credit; lowest rate.
DSCR
20% down · 8.5% · 30yr
- Down + closing
- —
- Monthly P&I
- —
- Monthly cashflow
- —
- DSCR
- —
- Eligible?
- —
No personal income docs; deal must DSCR.
Hard money
10% down · 12.0% · 12mo
- Down + closing
- —
- Monthly P&I
- —
- Monthly cashflow
- —
- DSCR
- —
- Eligible?
- —
Short-term bridge; refi at stabilization.
Rent comps 15 comps
| Address | Beds | Baths | Sqft | Rent | $/sqft | DOM | Units | Dist |
|---|---|---|---|---|---|---|---|---|
| 944 Glenn St West Columbia, SC | 2.0 | 1.0 | 960 | $1,150 | $1.20 | 25d | 1 | 0.44mi |
| 2805 Shadblow Ln West Columbia, SC | 1.0–3.0 | 1.0–2.0 | 965 | $1,510 | $1.56 | 4d | 27 | 0.68mi |
| 320 Dreher Rd Unit 5 West Columbia, SC | 2.0 | 1.0 | 1000 | $1,000 | $1.00 | 25d | 1 | 0.82mi |
| 246 Dreher Rd West Columbia, SC | 2.0 | 1.0 | 800 | $1,400 | $1.75 | 15d | 1 | 0.91mi |
| 1639 North Ave West Columbia, SC | 2.0 | 1.5 | 900 | $1,150 | $1.28 | 25d | 1 | 0.91mi |
| 614 Wessinger St West Columbia, SC | 2.0 | 1.0–1.5 | 1012 | $960 | $0.95 | 25d | 2 | 0.95mi |
| 528 Wessinger St West Columbia, SC | 2.0 | 1.0 | 800 | $1,095 | $1.37 | 12d | 1 | 0.99mi |
| 524 Wessinger St West Columbia, SC | 2.0 | 1.5 | 900 | $1,300 | $1.44 | 22d | 1 | 1.01mi |
| 1713 Crapps Ave Unit 1 West Columbia, SC | 2.0 | 1.0 | 925 | $1,095 | $1.18 | 20d | 1 | 1.04mi |
| 1713 Crapps Ave West Columbia, SC | 2.0 | 1.0 | 925 | $1,095 | $1.18 | 15d | 1 | 1.04mi |
| 605 Picadilly Sq Cayce, SC | 2.0 | 1.5 | 1100 | $1,275 | $1.16 | 22d | 1 | 1.06mi |
| 602 Picadilly Sq Cayce, SC | 2.0 | 1.5 | 1100 | $1,250 | $1.14 | 4d | 1 | 1.07mi |
| 7 Londonderry Sq Cayce, SC | 2.0 | 1.5 | 833 | $1,150 | $1.38 | 25d | 1 | 1.12mi |
| 1642 Oak St Cayce, SC | 2.0 | 1.0 | 1000 | $1,245 | $1.25 | 25d | 1 | 1.27mi |
| 1736 12th St Unit 1754 Cayce, SC | 2.0 | 1.5 | 868 | $1,250 | $1.44 | 4d | 1 | 1.43mi |
Listing history 3 events
-
2026-06-21days on market $244,000 Active 4 DOM
-
2026-06-18remarks 699-char remark
-
2026-06-18$244,000 Active 1 DOM
ⓘ Source: listings_history table (triggers on properties + properties_extension) + one-shot
backfill from property_details.listing_events for pre-trigger history.
Tax reassessment forecast SC · Resets to sale price
- Current annual tax
- $816 · $68/mo
- Projected year-2 tax
- $1,391 · $116/mo
- Expected delta
- +$574/yr (+$48/mo · 70.4%)
ⓘ Screening estimate from a state-policy table — verify with the county assessor before closing.
Climate risk First Street
- Flood 1/10 Low FEMA zone X (unshaded) · 0% chance over 30 yrs
- Wildfire 2/10 Low
- Heat 7/10 Severe 7 d/yr ≥108°F today · 16 d/yr by 30 yrs out
- Wind 6/10 Major 68% chance of damaging wind over 30 yrs
- Air quality 3/10 Moderate 2 unhealthy d/yr today · 2 by 30 yrs out
Nearby sold comps map
Loading sold comps map…
Walkable amenities ~0.75 mi
Loading nearby amenities…
Taxation est. · year 1
- Rental income
- $16,594
- − Mortgage interest
- −$13,668
- − Property taxes
- −$816
- − Insurance
- −$1,220
- − Repairs & maintenance
- −$1,328
- − Management
- −$1,328
- − Depreciation
- −$7,098
- Taxable loss
- −$8,863
- Est. tax savings @ 24.0%
- +$2,127
- After-tax cash flow
- $-2,154/yr
For passive investors: Depreciation is non-cash, so a rental often shows a tax loss while cash-flowing — sheltering income. Rental losses are passive: they offset passive income freely, and up to $25,000/yr can offset ordinary (W-2) income if you actively participate and your MAGI is under $100k (phasing out to $0 by $150k); unused losses carry forward. On sale, claimed depreciation is recaptured at up to 25%, and gains may owe capital-gains tax (a 1031 exchange can defer both). Figures are a year-1 estimate at your 24.0% rate — not tax advice; consult a CPA.
Schools (NCES district)
- District
- Lexington 02
- NCES district ID
- 4502730
- Math proficiency
- 30% ▼ -6.00%
- Reading proficiency
- 38% ▬ 0.00%
- Median HH income
- $42,532
- Composite
- 28.78/100
- National rank
- #6669
- State rank
- #45 of 80 in SC
Livability — West Columbia
- Score
- 63/100
- State rank
- #168
- US rank
- #15166
Category grades
Schools grade is shown separately in the Schools card above.
Census & demographics
- Census place
- West Columbia, SC
- County
- Lexington County · 232,571 people
- City population
- 21,647
- Metro
- Columbia, SC
- Population (ZIP)
- 21,647
- Household income
- $57,122
- Rent vs Own
- Severe rent burden
- 1172.0
Population outlook (Lexington County) Hauer SSP2
- Today (2025)
- 322,999 people
- By 2030
- 342,356 · +6.0%
- By 2040
- 377,715 · +16.9%
- By 2050
- 406,984 · +26.0%
- By 2075
- 465,447 · +44.1%
- By 2100
- 485,674 · +50.4%
Race, ethnicity, and origin ACS 2023
- Neighborhood character
- Predominantly White (66%)
- Race & ethnicity
- White 66% Black 16% Two or more races 11% Hispanic / Latino 10% Asian 3%
- Hispanic origin (detail)
- Mexican 6%
- Common ancestry
- Serbian 2% Italian 2% Lithuanian 2%
- Foreign-born
- 8% · Canada, China
- Languages at home
- 88% English-only · Spanish 8% Other Indo-European 1% Chinese 1%
Political lean MEDSL · Lexington
- 2024 margin
- Solid R (+33.5) · D 32.5% · R 66.0% · Other 1.4%
- 2008→2024 swing
- +4.6pp toward D · 2008: -38.0pp · 2024: -33.5pp
- All cycles
- 2024: R+33.5 2020: R+30.1 2016: R+36.7 2012: R+37.8 2008: R+38.0
Not yet ingested
- Civics
- —
Market trends
- HPI YoY
- ▼ -53.87%
- Current HPI
- 287.4791
- Rent YoY
- ▲ 3.48%
- Metro
- Columbia, SC
- State GDP YoY
- ▲ 4.51%
- F500 in state
- 2
Industry mix (Fortune 500 HQ in SC)
| Industry | F500 HQs | Revenue |
|---|---|---|
| Packaging | 1 | $7B |
|
||
Price history
+7.5% since first listed24 events — show timeline
- 2026-06-11 Listed $244,000 Consolidated MLS
- 2025-07-24 Sold (Public Records) $234,550 Public Records
- 2025-07-03 Pending — Consolidated MLS
- 2025-06-18 Contingent — Consolidated MLS
- 2025-05-22 Price Changed $242,000 Consolidated MLS
- 2025-05-08 Relisted — Consolidated MLS
- 2025-04-27 Contingent — Consolidated MLS
- 2025-04-10 Price Changed $245,000 Consolidated MLS
- 2025-03-13 Price Changed $248,000 Consolidated MLS
- 2025-02-27 Price Changed $250,000 Consolidated MLS
- 2025-02-13 Price Changed $256,000 Consolidated MLS
- 2025-01-30 Price Changed $258,000 Consolidated MLS
- 2025-01-16 Price Changed $260,000 Consolidated MLS
- 2024-12-03 Rental Removed $1,200 REDFIN
- 2024-12-03 Listed for Rent $1,200 REDFIN
- 2024-11-13 Rental Removed $1,200 REDFIN
- 2024-11-10 Price Changed $1,200 REDFIN
- 2024-11-10 Price Changed $1,300 REDFIN
- 2024-11-10 Listed for Rent $3,000 REDFIN
- 2024-11-06 Rental Removed $1,300 REDFIN
- 2024-10-21 Listed for Rent $1,300 REDFIN
- 2024-09-26 Price Changed $261,000 Consolidated MLS
- 2024-08-19 Listed $265,000 Consolidated MLS
- 2024-07-29 Sold (Public Records) $226,900 Public Records
Property tax history
-7.6%/yrLatest (2024): $816 · +2.4% YoY. Source: county tax records.
Cash-flow waterfall
monthlySold comps — $/sqft
last 12 mo · ≤1 miLoading sold comps…