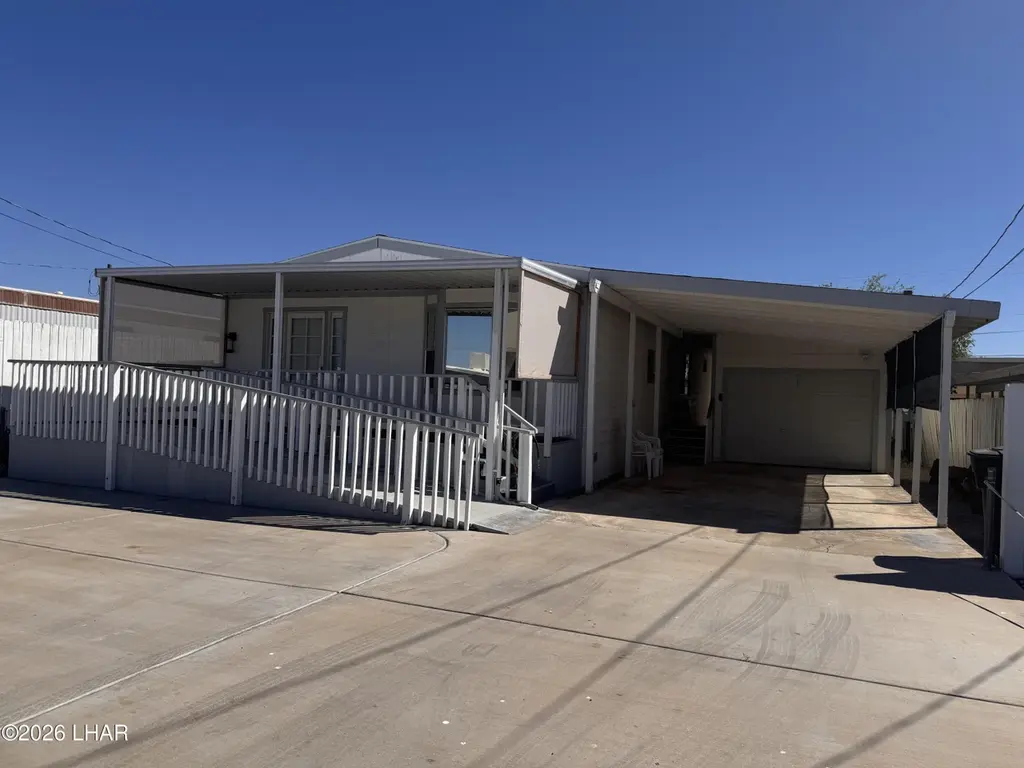
405 N Moonlight Dr · Bluewater, AZ
Flood risk No data
- FEMA flood zone
- —
- Chance of flooding over 30 yrs
- —
- Est. flood insurance / yr
- —
Fire risk No data
- Est. fire insurance / yr
- —
Heat risk No data
- Hot days now (above threshold)
- —
- Hot days in 30 yrs
- —
Wind risk No data
- Chance of severe wind over 30 yrs
- —
Air-quality risk No data
- Unhealthy air days now
- —
- Unhealthy air days in 30 yrs
- —
Risk factors via First Street. Map © Google.
Why this score? — see what drove the B- grade
The composite is a weighted blend of 9 inputs, each scored 0–100. Each bar is that input's sub-score; the figure is the points it added to the 100-point composite (weight × sub-score).
- Cash flow +30.0/30.0
- ARV discount +10.1/15.0
- 1% rule +10.0/10.0
- DSCR +10.0/10.0
- Livability +3.2/5.0
- Rent growth +2.5/5.0
- Condition / age +2.2/5.0
- Schools +1.5/10.0
- Appreciation +0.0/10.0
$136,000
🖨 Deal sheet 📄 Offer letter ✓ Due diligence
Listing remarks MLS
ON LEASED LAND * * Well-maintained 2 bedroom, 1¾ bath doublewide manufactured home located in the desirable Bluewater Lagoon community in Parker. Spacious living room features French doors opening to a covered front deck. Dining room includes a built-in hutch and bay window. Updated kitchen offers upgraded cabinetry, new wood laminate flooring, attractive backsplash, double stainless sink, and appliances including double-door refrigerator, wall oven, gas cooktop, microwave vent hood, and dishwasher. Bonus family room provides additional living space and a convenient laundry closet. Guest bedroom is generously sized with a large closet. Primary suite features his and hers closets, sliding door access to the rear patio, and an ensuite bath with updated vanity and tub/shower combo. Exterior amenities include a 15x25 garage with automatic door, carport parking, covered front deck, covered rear patio, storage shed, and easy-care landscaping. Bluewater Lagoon is a leased-land subdivision offering riverfront access, boat launch, swimming pool, and secure gated entry. * *
Key facts
- Bonus family room
- Boat launch
- Riverfront access
Tags
Neighborhood map
What this means for you Summary
Snapshot
- This is a 2-bed/2.0-bath manufactured listed at $136k. Condition is rated fair.
Deal economics
- At list price, monthly cash flow is $672 ($8k/yr) — positive.
- The deal already cash-flows at list — no discount required.
- Meets the 1% rule at list price ($2k rent vs $136k).
- Recommended offer: $128k (6.0% below list) — sets the bar for market timing.
- Cap rate 12.2% vs local median 9.9% in Bluewater — meaningfully above typical; check what's discounted (condition, days-on-market, listing class) to confirm the premium yield is real.
Location & tenants
- Location reads 65/100 on livability (#81 in AZ) — a middle-class / working-renter tenant base. Strengths: cost of living A+, housing A+, crime A-; Watch: health & safety C-, employment D+, schools F.
- Parker Unified School District (4510) (town): math 18% / reading 18% proficiency, ranked #200 of 249 in AZ (top 80%) — low school quality limits family demand, transient renter base, plan for 1-2y turnover; 69% free/reduced lunch — lower-income household profile, screen leases tightly.
- Market conditions: 147 active listings in the ZIP; 92 units permitted in La Paz County in 2024 (0 in 5+ unit buildings).
Forward outlook
- Local home prices are declining (-3.0%/yr); year-one equity from $940 of loan paydown is wiped out by about $4k of value loss. Plan a longer hold.
- La Paz County population projected at -11% by 2050 — secular population decline; favor cash flow + early exit over multi-decade hold.
- At projected returns (-3.0% appreciation + 3.0% rent growth), your $38k cash investment doubles in ~6 years — after that, you're playing with house money.
Negotiation context
- It's been on market 87 days — a 6% lower offer ($128k) is reasonable based on typical stale-listing flexibility.
Questions for the listing agent
- It's been on market 87 days. Have you received any prior offers? Is the seller open to a 6% concession, seller financing, or rate buy-down credit?
- Have any recent inspections been done? Can we get a copy of the seller's disclosures and any deferred-maintenance estimates?
- Built in 1970 — when were the roof, HVAC, electrical panel, plumbing, and water heater last replaced?
- Why hasn't it sold? Are there any deal-killer items the seller is aware of (foundation, flood, title, zoning, code violations)?
- Is there a deadline driving the sale (1031 exchange, divorce, estate, relocation)? That informs how much negotiation room exists.
- Schools are F-rated, which usually means shorter tenancies and higher turnover. Who's the typical renter profile here, and what's been the actual vacancy rate?
- What's the average days-on-market for RENTAL listings here right now (not sales)? A rising rental-DOM trend means longer vacancies and softer asking-rent achievability than the comps imply.
- What's the recent tenant-quality profile in this submarket — average credit score on applications, eviction rate, late-payment / NSF rate, and stable-employment percentage? A property-management company in the area should have these aggregated.
- How much new for-sale + rental construction is in the pipeline within 1–3 miles? Heavy new supply typically softens prices + rents 12–24 months out; constrained supply supports both.
Investment metrics
- 1% rule
- 1.50% ✓
- Cap rate
- 12.22%
- Cash-on-cash
- 21.17%
- DSCR
- 1.94
- GRM
- 5.6
CMA / ARV
- ARV (median comp)
- $144,451
- List price
- $136,000
- Delta
- -5.85%
- Verdict
- FAIR
- Comps
- 13 within 1.0 mi
Show comp detail 12 sales within ~0.75 mi
| Address | Dist | Beds/Ba | Sqft | Sold | Price | $/sf | Match |
|---|---|---|---|---|---|---|---|
| 338 N Moonlight Dr | 0.06mi | 2/2.0 | 1,296 (-4%) | 6mo | $132,000 | $102 | 86 |
| 405 N Stardust Ln | 0.04mi | 3/2.0 (+1) | 1,372 (+2%) | 10mo | $130,000 | $95 | 81 |
| 337 N Moonlight Dr | 0.06mi | 3/2.0 (+1) | 1,440 (+7%) | 1mo | $190,000 | $132 | 80 |
| 245 E Riverfront Dr | 0.25mi | 2/2.0 | 1,344 (0%) | 13mo | $275,000 | $205 | 78 |
| 471 Bluewater Dr | 0.12mi | 3/2.0 (+1) | 1,216 (-10%) | 0mo | $124,900 | $103 | 73 |
| 409 N Misty Ln | 0.09mi | 3/2.0 (+1) | 1,500 (+12%) | 5mo | $122,000 | $81 | 68 |
| 452 E Riverfront Dr | 0.22mi | 3/2.0 (+1) | 1,248 (-7%) | 8mo | $289,000 | $232 | 67 |
| 236 N Moonlight Dr | 0.22mi | 2/2.0 | 1,152 (-14%) | 1mo | $134,000 | $116 | 65 |
| 473 Bluewater Dr | 0.30mi | 2/2.0 | 1,440 (+7%) | 13mo | $143,500 | $100 | 63 |
| 484 E Riverfront Dr | 0.35mi | 3/2.0 (+1) | 1,392 (+4%) | 15mo | $415,000 | $298 | 60 |
| 324 N Misty Lane Ln | 0.08mi | 3/2.0 (+1) | 1,152 (-14%) | 11mo | $105,000 | $91 | 58 |
| 516 Bluewater Dr | 0.47mi | 3/2.0 (+1) | 1,440 (+7%) | 12mo | $265,000 | $184 | 51 |
Match score weights: distance 35% · size 25% · config 20% · recency 20%. Top-matched comps best support the ARV.
Projected returns pro-forma
-3.0% appreciation · 3.0% rent growth · sell at horizon
- IRR
- 13.7%
- Equity multiple
- 1.55×
- Total profit
- $20,774
- Equity at exit
- $20,278
- IRR
- 22.5%
- Equity multiple
- 2.92×
- Total profit
- $73,302
- Equity at exit
- $11,759
Cash invested: $38,080 (down + closing). Projections, not guarantees.
Landlord ↔ Tenant lean methodology
- Overall (STATE)
- 87 Strongly Landlord-Friendly
- State Arizona
- 87 Strongly Landlord-Friendly · R+3
- County
- — inherits STATE
- City
- — inherits STATE
ZIP-level market 85344
- Active inventory
- 147
- Price-to-rent
- 5.6×
Monthly cashflow live
- Estimated rent
- $2,040 medium interval (Pro) →
- Mortgage (P&I)
- −$713
- Tax est. 1.5%
- −$170 /mo · $2,040/yr
- Insurance
- −$57
- HOA
- −$0
- Vacancy / Maint / Mgmt
- −$428
- Net cashflow
- $672
Break-even live
UW: 25.0% down · 7.5% · 30yr · 1.5% tax · 5.0% vac · 8.0% maint · 8.0% mgmt
Financing live
Cash to close
- Down payment
- $34,000
- Closing costs
- $4,080
- Reserves months
- —
- Total cash needed
- —
Loan-product check · same deal, 3 products live
Conventional
25% down · 7.5% · 30yr
- Down + closing
- —
- Monthly P&I
- —
- Monthly cashflow
- —
- DSCR
- —
- Eligible?
- —
Personal DTI + credit; lowest rate.
DSCR
20% down · 8.5% · 30yr
- Down + closing
- —
- Monthly P&I
- —
- Monthly cashflow
- —
- DSCR
- —
- Eligible?
- —
No personal income docs; deal must DSCR.
Hard money
10% down · 12.0% · 12mo
- Down + closing
- —
- Monthly P&I
- —
- Monthly cashflow
- —
- DSCR
- —
- Eligible?
- —
Short-term bridge; refi at stabilization.
Listing history 17 events
-
2026-06-18days on market $136,000 Active 87 DOM
-
2026-06-17days on market $136,000 Active 86 DOM
-
2026-06-16days on market $136,000 Active 85 DOM
-
2026-06-15days on market $136,000 Active 84 DOM
-
2026-06-14days on market $136,000 Active 82 DOM
-
2026-06-13days on market $136,000 Active 81 DOM
-
2026-06-10days on market $136,000 Active 79 DOM
-
2026-06-09days on market $136,000 Active 78 DOM
-
2026-06-08days on market $136,000 Active 77 DOM
-
2026-06-07days on market $136,000 Active 76 DOM
-
2026-06-05days on market $136,000 Active 73 DOM
-
2026-06-03days on market $136,000 Active 72 DOM
-
2026-06-02days on market $136,000 Active 71 DOM
-
2026-06-01days on market $136,000 Active 70 DOM
-
2026-05-31days on market $136,000 Active 69 DOM
-
2026-05-30days on market $136,000 Active 68 DOM
-
2026-03-24$136,000 Active 1090-char remark
Show marketing remark (1090 chars)
ON LEASED LAND * * Well-maintained 2 bedroom, 1¾ bath doublewide manufactured home located in the desirable Bluewater Lagoon community in Parker. Spacious living room features French doors opening to a covered front deck. Dining room includes a built-in hutch and bay window. Updated kitchen offers upgraded cabinetry, new wood laminate flooring, attractive backsplash, double stainless sink, and appliances including double-door refrigerator, wall oven, gas cooktop, microwave vent hood, and dishwasher. Bonus family room provides additional living space and a convenient laundry closet. Guest bedroom is generously sized with a large closet. Primary suite features his and hers closets, sliding door access to the rear patio, and an ensuite bath with updated vanity and tub/shower combo. Exterior amenities include a 15x25 garage with automatic door, carport parking, covered front deck, covered rear patio, storage shed, and easy-care landscaping. Bluewater Lagoon is a leased-land subdivision offering riverfront access, boat launch, swimming pool, and secure gated entry. * *
ⓘ Source: listings_history table (triggers on properties + properties_extension) + one-shot
backfill from property_details.listing_events for pre-trigger history.
Nearby sold comps map
Loading sold comps map…
Walkable amenities ~0.75 mi
Loading nearby amenities…
Taxation est. · year 1
- Rental income
- $24,480
- − Mortgage interest
- −$7,618
- − Property taxes
- −$2,040
- − Insurance
- −$680
- − Repairs & maintenance
- −$1,958
- − Management
- −$1,958
- − Depreciation
- −$3,956
- Taxable income
- $6,268
- Est. tax owed @ 24.0%
- −$1,504
- After-tax cash flow
- $6,556/yr
For passive investors: Depreciation is non-cash, so a rental often shows a tax loss while cash-flowing — sheltering income. Rental losses are passive: they offset passive income freely, and up to $25,000/yr can offset ordinary (W-2) income if you actively participate and your MAGI is under $100k (phasing out to $0 by $150k); unused losses carry forward. On sale, claimed depreciation is recaptured at up to 25%, and gains may owe capital-gains tax (a 1031 exchange can defer both). Figures are a year-1 estimate at your 24.0% rate — not tax advice; consult a CPA.
Condition & rehab AI · 14 photos
The home requires moderate repairs and maintenance, with potential for significant value increase through painting and landscaping.
Repairs flagged
- Moderate Exposed framing — Exposed framing indicates potential structural issues or lack of finish.
- Minor Landscaping — No visible landscaping or curb appeal.
Value-add opportunities
- Both Paint touch-ups — Fresh paint can improve the home's appearance and curb appeal.
- Both Landscaping — Landscaping can enhance the home's curb appeal and add value.
Renovation cost estimate screening
| Repair item | Severity | Est. cost |
|---|---|---|
| Exposed framing · Exposed framing indicates potential structural issues or lack of finish. | Moderate | $3,000–15,000 |
| Landscaping · No visible landscaping or curb appeal. | Minor | $500–3,000 |
| Total estimated repair cost · 2 items | $3,500–18,000 |
Value-add ROI direction
- Both Paint touch-ups — Fresh paint can improve the home's appearance and curb appeal. ↑
- Both Landscaping — Landscaping can enhance the home's curb appeal and add value. ↑
ⓘ Cost ranges are severity-bucket heuristics (US national rule-of-thumb). Get contractor quotes + a written scope before underwriting a rehab budget.
Schools (NCES district)
- District
- Parker Unified School District (4510)
- NCES district ID
- 0405980
- Math proficiency
- 18% ▼ -10.00%
- Reading proficiency
- 18% ▼ -7.00%
- Median HH income
- $34,354
- Composite
- 14.76/100
- National rank
- #9392
- State rank
- #200 of 249 in AZ
Livability — Bluewater
- Score
- 65/100
- State rank
- #81
- US rank
- #12872
Category grades
Schools grade is shown separately in the Schools card above.
Census & demographics
- Census place
- Bluewater, AZ
- Population (ZIP)
- 9,069
Population outlook (La Paz County) Hauer SSP2
- Today (2025)
- 18,409 people
- By 2030
- 17,592 · -4.4%
- By 2040
- 16,600 · -9.8%
- By 2050
- 16,328 · -11.3%
- By 2075
- 17,075 · -7.2%
- By 2100
- 17,042 · -7.4%
Race, ethnicity, and origin ACS 2023
- Neighborhood character
- Highly diverse neighborhood (Simpson 0.72)
- Race & ethnicity
- White 40% Hispanic / Latino 34% Native American 23% Two or more races 19% Asian 2%
- Hispanic origin (detail)
- Mexican 32%
- Common ancestry
- Slovak 1% Lithuanian 1% Portuguese 1%
- Foreign-born
- 10% · Canada
- Languages at home
- 74% English-only · Spanish 21% Other Indo-European 1% Tagalog/Filipino 1%
Political lean MEDSL · La Paz
- 2024 margin
- Solid R (+44.2) · D 27.6% · R 71.8%
- 2008→2024 swing
- -15.7pp toward R · 2008: -28.5pp · 2024: -44.2pp
- All cycles
- 2024: R+44.2 2020: R+38.8 2016: R+41.8 2012: R+32.2 2008: R+28.5
Not yet ingested
- Civics
- —
Market trends
- HPI YoY
- ▼ -155.38%
- Current HPI
- 198.2271
- Rent YoY
- —
- Metro
- —
- State GDP YoY
- ▲ 4.54%
- F500 in state
- 20
Industry mix (Fortune 500 HQ in AZ)
| Industry | F500 HQs | Revenue |
|---|---|---|
| Technology | 2 | $13B |
|
||
| Mining / Metals | 1 | $23B |
|
||
| Environmental Services | 1 | $16B |
|
||
| Metals / Steel | 1 | $14B |
|
||
| Technology Distribution | 1 | $9B |
|
||
| Homebuilding | 1 | $8B |
|
||
Price history
1 event — show timeline
- 2026-03-24 Listed $136,000 LHAR
Cash-flow waterfall
monthlySold comps — $/sqft
last 12 mo · ≤1 miLoading sold comps…