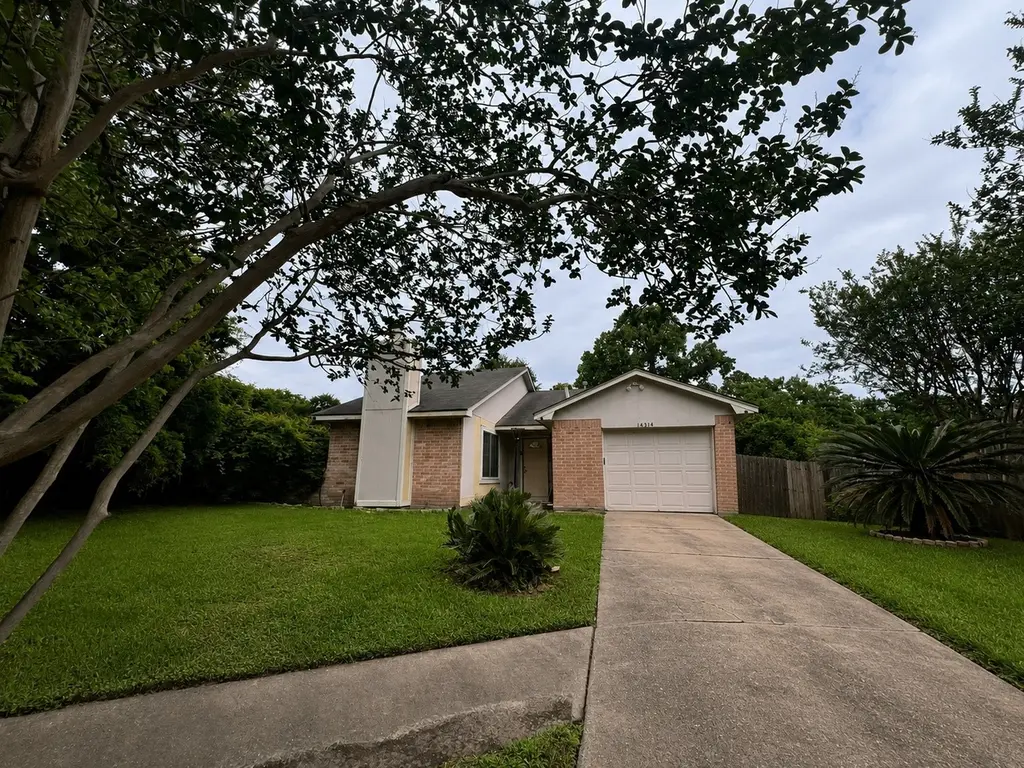
14314 River Glen Dr · Sugar Land, TX
Flood risk 3/10 · Minor
- FEMA flood zone
- X (unshaded)
- Chance of flooding over 30 yrs
- 0.2%
- Est. flood insurance / yr
- $507 – $1,088
Fire risk 1/10 · Minimal
- Est. fire insurance / yr
- $1,222 – $2,270
Heat risk 9/10 · Severe
- Hot days now (above 110°F)
- 7 days/yr
- Hot days in 30 yrs
- 23 days/yr
Wind risk 9/10 · Severe
- Chance of severe wind over 30 yrs
- 99.0%
Air-quality risk 2/10 · Minimal
- Unhealthy air days now
- 2 days/yr
- Unhealthy air days in 30 yrs
- 2 days/yr
Risk factors via First Street. Map © Google.
Why this score? — see what drove the D grade
The composite is a weighted blend of 9 inputs, each scored 0–100. Each bar is that input's sub-score; the figure is the points it added to the 100-point composite (weight × sub-score).
- Cash flow +10.3/30.0
- ARV discount +9.5/15.0
- Schools +4.5/10.0
- Livability +4.0/5.0
- 1% rule +3.7/10.0
- DSCR +3.0/10.0
- Rent growth +2.7/5.0
- Condition / age +2.5/5.0
- Appreciation +0.0/10.0
$205,000
🖨 Deal sheet 📄 Offer letter ✓ Due diligence
Key facts
- 0.33 acre lot
- Garage
- Built 1983
Property features AI
Finance
- HOA & community: Homeowners association with an annual fee of $300; Community curbs
Exterior
- Parking: Attached garage (1 car)
- Utilities: Public water; Public sewer
- Home design: Residential property; Single-story entry (all main rooms listed on first floor)
- Construction: Built in 1983; Cement siding; Composition roof; Slab foundation
- Exterior features: Private yard; Property on a cul-de-sac
Interior
- Kitchen: Dishwasher; Gas cooktop; Oven
- Bedrooms: Primary bedroom on the first floor (approx. 12 x 14); Two additional bedrooms on the first floor (each approx. 10 x 11)
- Flooring: Tile
- Bathrooms: 2 full bathrooms
- Heating & cooling: Central heating (gas); Central electric air conditioning
- Interior features: Free-standing fireplace (1 total); Washer hookup and gas dryer hookup
- Laundry & utility: Washer hookup; Gas dryer hookup
Neighborhood map
What this means for you Summary
Snapshot
- This is a 3-bed/2.0-bath single-family listed at $205k.
Deal economics
- At list price, monthly cash flow is $-112 ($-1k/yr) — negative.
- To cash-flow at today's rent, offer at most $185k (9.6% below list).
- To meet the 1% rule (rent ≥ 1% of price), the offer needs to be $179k (12.6% below list).
- Recommended offer: $179k (12.6% below list) — sets the bar for 1% rule.
- Cap rate 5.6% vs local median 2.6% in Sugar Land — top-decile yield for the area; either an underpriced asset or a hidden risk that comps aren't pricing in. Stress-test before assuming the spread holds.
Location & tenants
- Location reads 80/100 on livability (#38 in TX, #1,758 nationally) — a professional / high-income tenant draw. Strengths: crime A+, employment A+, housing A+; Watch: cost of living D, commute F.
- Fort Bend ISD (suburban): math 44% / reading 53% proficiency, ranked #140 of 826 in TX (top 17%) — families likely to look elsewhere, expect single-tenant / working-renter base with shorter leases.
- Zoned schools: Sugar Mill El (math 47% / reading 51%, grade D, #926 of 4,322 statewide, top 22%, 640 students, 56% FRL); Sugar Land Middle (math 30% / reading 40%, grade F, #842 of 1,662 statewide, top 51%, 1,050 students, 65% FRL); Kempner H S (math 35% / reading 56%, grade D-, #634 of 1,632 statewide, top 39%, 1,945 students, 62% FRL) — zoned schools average 61% FRL vs 35% district-wide (26 pts higher); higher-poverty schools than district average — tighter screening recommended.
- Market conditions: Rents flat; 277 active listings in the ZIP; 26 comparable units currently listed for rent nearby; rentals leasing fast (median 12d on market — plan ~1-2 weeks tenant-placement turnaround); solid renter incomes; 12,093 units permitted in Fort Bend County in 2024 (815 in 5+ unit buildings).
Forward outlook
- Local home prices are declining (-3.0%/yr); year-one equity from $1k of loan paydown is wiped out by about $6k of value loss. Plan a longer hold.
- Fort Bend County population projected at +75% by 2050 — long-run rental-demand tailwind backs the buy-and-hold thesis.
Negotiation context
- It's been on market 33 days — a 3% lower offer ($199k) is reasonable based on typical stale-listing flexibility.
- 3 sale attempts since 20y ago with the ask held roughly flat each time — persistent listings suggest the price (not the market) is what's stuck; bring a comps-based counter.
Risks & watch-outs
- Climate carrying-cost: severe wind risk, 99% chance of damaging wind over 30y; extreme-heat days projected 7→23/yr by 2055 (HVAC capex compounding) — expect insurance premiums to compound above CPI over the hold.
Questions for the listing agent
- What do current leases actually rent for vs. the listed asking? Can we see a recent rent roll and the last 12 months of T-12 income?
- It's been on market 33 days. Have you received any prior offers? Is the seller open to a 13% concession, seller financing, or rate buy-down credit?
- What does the HOA fee cover, when was the last increase, and are there any pending special assessments or reserve-fund shortfalls?
- Is there a deadline driving the sale (1031 exchange, divorce, estate, relocation)? That informs how much negotiation room exists.
- Schools are A-rated — typically a magnet for longer-tenancy family renters. What's the average tenant stay here, and is there a school-zone premium baked into asking?
- The area grade is low — what's the realistic commute time and amenity access for the typical tenant pool here? Any planned neighborhood developments (good or bad) we should know about?
- What's the average days-on-market for RENTAL listings here right now (not sales)? A rising rental-DOM trend means longer vacancies and softer asking-rent achievability than the comps imply.
- What's the recent tenant-quality profile in this submarket — average credit score on applications, eviction rate, late-payment / NSF rate, and stable-employment percentage? A property-management company in the area should have these aggregated.
- How much new for-sale + rental construction is in the pipeline within 1–3 miles? Heavy new supply typically softens prices + rents 12–24 months out; constrained supply supports both.
Investment metrics
- 1% rule
- 0.87% ✗
- Cap rate
- 5.64%
- Cash-on-cash
- -2.33%
- DSCR
- 0.90
- GRM
- 9.5
CMA / ARV
- ARV (median comp)
- $214,314
- List price
- $205,000
- Delta
- -4.35%
- Verdict
- FAIR
- Comps
- 20 within 1.0 mi
Show comp detail 12 sales within ~0.75 mi
| Address | Dist | Beds/Ba | Sqft | Sold | Price | $/sf | Match |
|---|---|---|---|---|---|---|---|
| 10918 Spanish Grant Dr | 0.19mi | 3/2.0 | 1,138 (+1%) | 4mo | $189,000 | $166 | 86 |
| 14151 Clover Point Dr | 0.18mi | 3/2.0 | 1,122 (0%) | 12mo | $227,000 | $202 | 82 |
| 10707 Spanish Grant Dr | 0.28mi | 3/2.0 | 1,138 (+1%) | 13mo | $235,900 | $207 | 74 |
| 10734 Parkland Woods | 0.40mi | 3/2.0 | 1,059 (-6%) | 2mo | $189,000 | $178 | 71 |
| 10730 Lakewood Oaks Dr | 0.35mi | 3/1.5 | 1,122 (0%) | 13mo | $205,000 | $183 | 71 |
| 10311 Westedge Dr | 0.58mi | 3/2.0 | 1,175 (+5%) | 1mo | $185,000 | $157 | 64 |
| 10327 Hollow Canyon Ct | 0.56mi | 3/2.0 | 1,171 (+4%) | 9mo | $250,000 | $213 | 59 |
| 10323 Gulfstream Ln | 0.58mi | 2/2.0 (-1) | 1,118 (-0%) | 11mo | $235,000 | $210 | 58 |
| 10930 Spanish Grant Dr | 0.18mi | 2/2.0 (-1) | 999 (-11%) | 13mo | $212,000 | $212 | 58 |
| 13911 Clear Forest Dr | 0.40mi | 3/2.0 | 1,274 (+14%) | 4mo | $220,000 | $173 | 56 |
| 10018 King Ranch Ln | 0.69mi | 3/2.0 | 1,171 (+4%) | 6mo | $215,000 | $184 | 55 |
| 14003 Clear Forest Dr | 0.35mi | 2/2.0 (-1) | 999 (-11%) | 9mo | $224,990 | $225 | 53 |
Match score weights: distance 35% · size 25% · config 20% · recency 20%. Top-matched comps best support the ARV.
Projected returns pro-forma
-3.0% appreciation · 0.61% rent growth · sell at horizon
- IRR
- -23.1%
- Equity multiple
- 0.23×
- Total profit
- $-44,443
- Equity at exit
- $30,566
- IRR
- -26.1%
- Equity multiple
- -0.11×
- Total profit
- $-63,929
- Equity at exit
- $17,725
Cash invested: $57,400 (down + closing). Projections, not guarantees.
Landlord ↔ Tenant lean methodology
- Overall (STATE)
- 87 Strongly Landlord-Friendly
- State Texas
- 87 Strongly Landlord-Friendly · R+5
- County
- — inherits STATE
- City
- — inherits STATE
ZIP-level market 77498
- Home prices YoY
- -10.6%
- Rents YoY
- 0.6%
- Active inventory
- 277
- Price-to-rent
- 9.5×
Monthly cashflow live
- Estimated rent
- $1,791 high interval (Pro) →
- Mortgage (P&I)
- −$1,075
- Tax from tax record
- −$341 /mo · $4,096/yr
- Insurance
- −$85
- HOA
- −$25
- Vacancy / Maint / Mgmt
- −$376
- Net cashflow
- $-112
Break-even live
UW: 25.0% down · 7.5% · 30yr · 1.5% tax · 5.0% vac · 8.0% maint · 8.0% mgmt
Financing live
Cash to close
- Down payment
- $51,250
- Closing costs
- $6,150
- Reserves months
- —
- Total cash needed
- —
Loan-product check · same deal, 3 products live
Conventional
25% down · 7.5% · 30yr
- Down + closing
- —
- Monthly P&I
- —
- Monthly cashflow
- —
- DSCR
- —
- Eligible?
- —
Personal DTI + credit; lowest rate.
DSCR
20% down · 8.5% · 30yr
- Down + closing
- —
- Monthly P&I
- —
- Monthly cashflow
- —
- DSCR
- —
- Eligible?
- —
No personal income docs; deal must DSCR.
Hard money
10% down · 12.0% · 12mo
- Down + closing
- —
- Monthly P&I
- —
- Monthly cashflow
- —
- DSCR
- —
- Eligible?
- —
Short-term bridge; refi at stabilization.
Rent comps 26 comps
| Address | Beds | Baths | Sqft | Rent | $/sqft | DOM | Units | Dist |
|---|---|---|---|---|---|---|---|---|
| 10723 Forest Leaf Dr Sugar Land, TX | 3.0 | 2.0 | 1171 | $1,800 | $1.54 | 43d | 1 | 0.09mi |
| 10811 Forest Leaf Dr Sugar Land, TX | 3.0 | 2.0 | 1383 | $1,766 | $1.28 | 43d | 1 | 0.14mi |
| 14402 W Bellfort Apt 424 Sugar Land, TX | 2.0 | 2.0 | 1053 | $1,619 | $1.54 | 5d | 1 | 0.21mi |
| 14402 W Bellfort Unit 14439 Sugar Land, TX | 2.0 | 2.0 | 1053 | $1,654 | $1.57 | 43d | 1 | 0.27mi |
| 14402 W Bellfort Unit 2148 Sugar Land, TX | 2.0 | 2.0 | 1053 | $1,611 | $1.53 | 2d | 1 | 0.27mi |
| 14402 W Bellfort St Sugar Land, TX | 2.0 | 2.0 | 1053 | $1,577 | $1.50 | 22d | 1 | 0.27mi |
| 14402 W Bellfort Unit 2174 Sugar Land, TX | 2.0 | 2.0 | 1053 | $1,643 | $1.56 | 10d | 1 | 0.27mi |
| 10810 Lakewood Oaks Dr Sugar Land, TX | 3.0 | 2.0 | 1059 | $1,641 | $1.55 | 43d | 1 | 0.35mi |
| 14402 W Bellfort Ave Unit 22258 Sugar Land, TX | 2.0 | 2.0 | 1358 | $1,475 | $1.09 | 43d | 1 | 0.40mi |
| 14402 W Bellfort Ave Unit 28654 Sugar Land, TX | 2.0 | 2.0 | 1360 | $1,488 | $1.09 | 43d | 1 | 0.40mi |
| 14007 Florence Rd Sugar Land, TX | 2.0 | 2.0 | 1053 | $1,577 | $1.50 | 11d | 1 | 0.49mi |
| 10111 King Ranch Ln Sugar Land, TX | 3.0 | 2.0 | 1419 | $1,850 | $1.30 | 20d | 1 | 0.65mi |
| 10411 Cedartowne Ln Sugar Land, TX | 3.0 | 2.0 | 1296 | $1,756 | $1.35 | 22d | 1 | 0.77mi |
| 15000 W Airport Blvd Sugar Land, TX | 1.0–3.0 | 1.0–2.0 | 1001 | $1,885 | $1.88 | 1d | 14 | 0.86mi |
| 15006 W Airport Blvd Sugar Land, TX | 2.0 | 1.0 | 941 | $1,500 | $1.59 | 43d | 1 | 0.97mi |
| 15015 W Airport Blvd Sugar Land, TX | 1.0–3.0 | 1.0–2.0 | 1001 | $1,897 | $1.90 | 1d | 34 | 1.09mi |
| 15928 Old Richmond Rd Unit 3047 Sugar Land, TX | 3.0 | 2.0 | 1190 | $1,572 | $1.32 | 11d | 1 | 1.23mi |
| 15928 Old Richmond Rd Unit 2047 Sugar Land, TX | 2.0 | 2.0 | 980 | $1,397 | $1.43 | 11d | 1 | 1.23mi |
| 15928 Old Richmond Rd Unit 425 Sugar Land, TX | 2.0 | 2.0 | 980 | $1,354 | $1.38 | 2d | 1 | 1.23mi |
| 15928 Old Richmond Rd Unit 15961 Sugar Land, TX | 3.0 | 2.0 | 1190 | $1,572 | $1.32 | 43d | 1 | 1.23mi |
| 15928 Old Richmond Rd Unit 15985 Sugar Land, TX | 2.0 | 2.0 | 980 | $1,387 | $1.42 | 43d | 1 | 1.23mi |
| 15928 Old Richmond Rd Unit 424 Sugar Land, TX | 2.0 | 2.0 | 980 | $1,362 | $1.39 | 5d | 1 | 1.23mi |
| 15928 Old Richmond Rd Unit 3148 Sugar Land, TX | 3.0 | 2.0 | 1190 | $1,529 | $1.28 | 2d | 1 | 1.23mi |
| 15928 Old Richmond Rd Unit 3174 Sugar Land, TX | 3.0 | 2.0 | 1190 | $1,561 | $1.31 | 10d | 1 | 1.23mi |
| 15928 Old Richmond Rd Unit 2174 Sugar Land, TX | 2.0 | 2.0 | 980 | $1,386 | $1.41 | 10d | 1 | 1.23mi |
| 15270 Voss Rd Sugar Land, TX | 1.0–3.0 | 1.0–2.0 | 1093 | $2,062 | $1.89 | 1d | 19 | 1.27mi |
HOA detail
- Monthly dues
- $25 · $300/yr
Listing history 20 events
-
2026-06-18days on market $205,000 Active 33 DOM
-
2026-06-17days on market $205,000 Active 32 DOM
-
2026-06-16days on market $205,000 Active 31 DOM
-
2026-06-15days on market $205,000 Active 30 DOM
-
2026-06-13days on market $205,000 Active 28 DOM
-
2026-06-09days on market $205,000 Active 24 DOM
-
2026-06-08days on market $205,000 Active 23 DOM
-
2026-06-07days on market $205,000 Active 22 DOM
-
2026-06-04days on market $205,000 Active 19 DOM
-
2026-06-03days on market $205,000 Active 18 DOM
-
2026-06-02days on market $205,000 Active 17 DOM
-
2026-06-01days on market $205,000 Active 16 DOM
-
2026-05-31days on market $205,000 Active 15 DOM
-
2026-05-16$205,000 Active 709-char remark
-
2026-05-11historical $205,000 709-char remark
-
2010-08-06historical
-
2010-02-05$86,000
-
2007-04-10historical
-
2006-10-06$94,500
-
2005-01-18soldstatus
ⓘ Source: listings_history table (triggers on properties + properties_extension) + one-shot
backfill from property_details.listing_events for pre-trigger history.
Tax reassessment forecast TX · Resets to sale price
- Current annual tax
- $4,096 · $341/mo
- Projected year-2 tax
- $4,096 · $341/mo
- Expected delta
- $0/yr ($0/mo · 0.0%)
ⓘ Screening estimate from a state-policy table — verify with the county assessor before closing.
Climate risk First Street
- Flood 3/10 Moderate FEMA zone X (unshaded) · 20% chance over 30 yrs
- Wildfire 1/10 Low
- Heat 9/10 Extreme 7 d/yr ≥110°F today · 23 d/yr by 30 yrs out
- Wind 9/10 Extreme 99% chance of damaging wind over 30 yrs
- Air quality 2/10 Low 2 unhealthy d/yr today · 2 by 30 yrs out
Nearby sold comps map
Loading sold comps map…
Walkable amenities ~0.75 mi
Loading nearby amenities…
Taxation est. · year 1
- Rental income
- $21,495
- − Mortgage interest
- −$11,483
- − Property taxes
- −$4,096
- − Insurance
- −$1,025
- − Repairs & maintenance
- −$1,720
- − Management
- −$1,720
- − HOA
- −$300
- − Depreciation
- −$5,964
- Taxable loss
- −$4,811
- Est. tax savings @ 24.0%
- +$1,155
- After-tax cash flow
- $-185/yr
For passive investors: Depreciation is non-cash, so a rental often shows a tax loss while cash-flowing — sheltering income. Rental losses are passive: they offset passive income freely, and up to $25,000/yr can offset ordinary (W-2) income if you actively participate and your MAGI is under $100k (phasing out to $0 by $150k); unused losses carry forward. On sale, claimed depreciation is recaptured at up to 25%, and gains may owe capital-gains tax (a 1031 exchange can defer both). Figures are a year-1 estimate at your 24.0% rate — not tax advice; consult a CPA.
Schools (NCES district)
- District
- Fort Bend ISD
- NCES district ID
- 4819650
- Math proficiency
- 44% ▼ -15.00%
- Reading proficiency
- 53% ▼ -4.00%
- Median HH income
- $82,360
- Composite
- 44.61/100
- National rank
- #2779
- State rank
- #140 of 826 in TX
Livability — Sugar Land
- Score
- 80/100
- State rank
- #38
- US rank
- #1758
Category grades
Schools grade is shown separately in the Schools card above.
Census & demographics
- County
- Fort Bend County · 836,777 people
- City population
- 168,209
- Metro
- Houston-The Woodlands-Sugar Land, TX
- Population (ZIP)
- 52,806
- Household income
- $100,950
- Rent vs Own
- Severe rent burden
- 1252.0
Population outlook (Fort Bend County) Hauer SSP2
- Today (2025)
- 1,004,526 people
- By 2030
- 1,153,104 · +14.8%
- By 2040
- 1,453,718 · +44.7%
- By 2050
- 1,753,781 · +74.6%
- By 2075
- 2,455,772 · +144.5%
- By 2100
- 2,930,528 · +191.7%
Race, ethnicity, and origin ACS 2023
- Neighborhood character
- Highly diverse neighborhood (Simpson 0.76)
- Race & ethnicity
- Asian 28% White 27% Hispanic / Latino 22% Black 20% Two or more races 9%
- Hispanic origin (detail)
- Mexican 14%
- Common ancestry
- Italian 1% Ukrainian 1% Arab 1%
- Foreign-born
- 33% · Canada, Vietnam, China
- Languages at home
- 47% English-only · Spanish 18% Other Indo-European 10% Vietnamese 7%
Political lean MEDSL · Fort Bend
- 2024 margin
- Toss-up / Even · D 49.5% · R 47.9% · Other 2.6%
- 2008→2024 swing
- +4.0pp toward D · 2008: -2.4pp · 2024: 1.6pp
- All cycles
- 2024: D+1.6 2020: D+10.6 2016: D+6.6 2012: R+6.8 2008: R+2.4
Not yet ingested
- Civics
- —
Market trends
- HPI YoY
- ▼ -29.01%
- Current HPI
- 245.1437
- Rent YoY
- ▲ 0.61%
- Metro
- Houston-The Woodlands-Sugar Land, TX
- State GDP YoY
- ▲ 3.95%
- F500 in state
- 110
Industry mix (Fortune 500 HQ in TX)
| Industry | F500 HQs | Revenue |
|---|---|---|
| Energy | 16 | $1,198B |
|
||
| Technology | 5 | $198B |
|
||
| Engineering / Construction | 4 | $72B |
|
||
| Energy Services | 3 | $60B |
|
||
| Utilities | 3 | $41B |
|
||
| Healthcare | 2 | $330B |
|
||
Price history
+116.9% since first listed7 events — show timeline
- 2026-05-16 Listed $205,000 HARMLS
- 2026-05-11 Coming Soon $205,000 HARMLS
- 2010-08-06 Listing Removed — HARMLS
- 2010-02-05 Listed $86,000 HARMLS
- 2007-04-10 Listing Removed — HARMLS
- 2006-10-06 Listed $94,500 HARMLS
- 2005-01-18 Sold (Public Records) — Public Records
Property tax history
+4.3%/yrLatest (2025): $4,096 · +10.7% YoY. Source: county tax records.
Cash-flow waterfall
monthlySold comps — $/sqft
last 12 mo · ≤1 miLoading sold comps…