445 Fedscreek Rd · Big Rock, VA
Flood risk 10/10 · Severe
- FEMA flood zone
- A
- Chance of flooding over 30 yrs
- 0.99%
- Est. flood insurance / yr
- $1,009 – $1,996
Fire risk 6/10 · Moderate
- Est. fire insurance / yr
- $839 – $1,559
Heat risk 4/10 · Minor
- Hot days now (above 98°F)
- 8 days/yr
- Hot days in 30 yrs
- 22 days/yr
Wind risk 2/10 · Minimal
- Chance of severe wind over 30 yrs
- 1.0%
Air-quality risk 1/10 · Minimal
- Unhealthy air days now
- 0 days/yr
- Unhealthy air days in 30 yrs
- 0 days/yr
Risk factors via First Street. Map © Google.
Why this score? — see what drove the D+ grade
The composite is a weighted blend of 9 inputs, each scored 0–100. Each bar is that input's sub-score; the figure is the points it added to the 100-point composite (weight × sub-score).
- Cash flow +15.0/30.0
- ARV discount +7.5/15.0
- 1% rule +5.0/10.0
- DSCR +5.0/10.0
- Appreciation +5.0/10.0
- Schools +2.6/10.0
- Rent growth +2.5/5.0
- Livability +2.5/5.0
- Condition / age +2.5/5.0
$20,000
🖨 Deal sheet (PDF) 📄 Offer letter ✓ Due diligence
Listing remarks
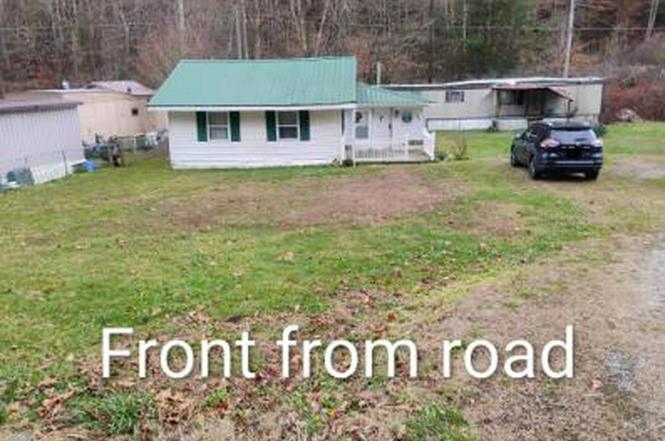
Fixer upper. Great starter home located near schools, post office, stores, fire dept. , medical and a pharmacy. Good size front yard. Storage building in rear. Has its own driveway. Quiet neighborhood. Part of an estate. Priced to sell.
Key facts
- Storage building
- Front yard
- Own driveway
Tags
Property features AI
Exterior
- Home design: House
- Construction: Living area approximately 1,600 square feet
- Exterior features: Lot of approximately 21,780 square feet
Neighborhood map
What this means for you Summary
Snapshot
- This is a 3-bed/1.0-bath manufactured listed at $20k.
Deal economics
- At list price, monthly cash flow is $652 ($8k/yr) — positive.
- The deal already cash-flows at list — no discount required.
- Meets the 1% rule at list price ($1k rent vs $20k).
- Recommended offer: $19k (3.0% below list) — sets the bar for market timing.
Location & tenants
- Location reads: area grade D — affects rentability + tenant quality, not the cash-flow math above.
- Pike County (rural): math 24% / reading 40% proficiency, ranked #98 of 165 in KY (top 59%) — families likely to look elsewhere, expect single-tenant / working-renter base with shorter leases.
- Zoned schools: Belfry Middle School (math 27% / reading 44%, grade F, #94 of 217 statewide, top 44%, 349 students, 75% FRL) — zoned schools average 75% FRL vs 54% district-wide (21 pts higher); higher-poverty schools than district average — tighter screening recommended.
- Market conditions: 4 units permitted in Pike County in 2024 (0 in 5+ unit buildings).
Forward outlook
- In year one you build about $738 of equity ($138 loan paydown + $600 appreciation (3.0% local appreciation)).
- Pike County population projected at -33% by 2050 — secular population decline; favor cash flow + early exit over multi-decade hold.
- At projected returns (3.0% appreciation + 3.0% rent growth), your $6k cash investment doubles in ~1 year — after that, you're playing with house money.
Negotiation context
- It's been on market 54 days — a 3% lower offer ($19k) is reasonable based on typical stale-listing flexibility.
- 2 sale attempts with the ask held roughly flat each time — persistent listings suggest the price (not the market) is what's stuck; bring a comps-based counter.
Risks & watch-outs
- Watch-outs: flood insurance adds $125/mo.
- Climate carrying-cost: in FEMA flood zone A (mandatory federal flood insurance); major wildfire risk — expect insurance premiums to compound above CPI over the hold.
Questions for the listing agent
- It's been on market 54 days. Have you received any prior offers? Is the seller open to a 3% concession, seller financing, or rate buy-down credit?
- Built in 1970 — when were the roof, HVAC, electrical panel, plumbing, and water heater last replaced?
- What's the actual annual flood-insurance premium (NFIP or private), and is the property in a SFHA with mandatory coverage?
- Is there a deadline driving the sale (1031 exchange, divorce, estate, relocation)? That informs how much negotiation room exists.
- The area grade is low — what's the realistic commute time and amenity access for the typical tenant pool here? Any planned neighborhood developments (good or bad) we should know about?
- What's the average days-on-market for RENTAL listings here right now (not sales)? A rising rental-DOM trend means longer vacancies and softer asking-rent achievability than the comps imply.
- What's the recent tenant-quality profile in this submarket — average credit score on applications, eviction rate, late-payment / NSF rate, and stable-employment percentage? A property-management company in the area should have these aggregated.
- How much new for-sale + rental construction is in the pipeline within 1–3 miles? Heavy new supply typically softens prices + rents 12–24 months out; constrained supply supports both.
Investment metrics
- 1% rule
- 5.71% ✓
- Cap rate
- 52.95%
- Cash-on-cash
- 166.64%
- DSCR
- 8.41
- GRM
- 1.5
CMA / ARV
No comps found within radius.
Projected returns pro-forma
3.0% appreciation · 3.0% rent growth · sell at horizon
- IRR
- —
- Equity multiple
- 8.87×
- Total profit
- $44,049
- Equity at exit
- $8,993
- IRR
- —
- Equity multiple
- 18.62×
- Total profit
- $98,696
- Equity at exit
- $13,859
Cash invested: $5,600 (down + closing). Projections, not guarantees.
Monthly cashflow live
- Estimated rent
- $1,143 medium interval (Pro) →
- Mortgage (P&I)
- −$105
- Tax from tax record
- −$12 /mo · $142/yr
- Insurance
- −$8
- Flood insurance flood zone
- −$125 /mo · $1,502/yr
- HOA
- −$0
- Vacancy / Maint / Mgmt
- −$240
- Net cashflow
- $652
Break-even live
Sensitivity live
| Price | -10% $664 | -5% $658 | +0% $652 | +5% $647 | +10% $641 |
|---|---|---|---|---|---|
| Rent | -10% $562 | -5% $607 | +0% $652 | +5% $698 | +10% $743 |
| Rate | -1.0pp $663 | -0.5pp $658 | base $652 | +0.5pp $647 | +1.0pp $642 |
UW: 25.0% down · 7.5% · 30yr · 1.5% tax · 5.0% vac · 8.0% maint · 8.0% mgmt
Financing live
Cash to close
- Down payment
- $5,000
- Closing costs
- $600
- Reserves months
- —
- Total cash needed
- —
Loan-product check · same deal, 3 products live
Conventional
25% down · 7.5% · 30yr
- Down + closing
- —
- Monthly P&I
- —
- Monthly cashflow
- —
- DSCR
- —
- Eligible?
- —
Personal DTI + credit; lowest rate.
DSCR
20% down · 8.5% · 30yr
- Down + closing
- —
- Monthly P&I
- —
- Monthly cashflow
- —
- DSCR
- —
- Eligible?
- —
No personal income docs; deal must DSCR.
Hard money
10% down · 12.0% · 12mo
- Down + closing
- —
- Monthly P&I
- —
- Monthly cashflow
- —
- DSCR
- —
- Eligible?
- —
Short-term bridge; refi at stabilization.
Listing history 4 events
-
2026-03-10historical Under Contract
-
2026-01-15$20,000 Active
-
2025-05-28price $35,000
-
2025-04-10$45,000 Active
ⓘ Source: listings_history table (triggers on properties + properties_extension) + one-shot
backfill from property_details.listing_events for pre-trigger history.
Tax reassessment forecast VA · Resets to sale price
- Current annual tax
- $142 · $12/mo
- Projected year-2 tax
- $164 · $14/mo
- Expected delta
- +$22/yr (+$2/mo · 15.4%)
ⓘ Screening estimate from a state-policy table — verify with the county assessor before closing.
Climate risk First Street
- Flood 10/10 Extreme FEMA zone A · 99% chance over 30 yrs
- Wildfire 6/10 Major
- Heat 4/10 Moderate 8 d/yr ≥98°F today · 22 d/yr by 30 yrs out
- Wind 2/10 Low 100% chance of damaging wind over 30 yrs
- Air quality 1/10 Low 0 unhealthy d/yr today · 0 by 30 yrs out
Nearby sold comps map
Loading sold comps map…
Walkable amenities ~0.75 mi
Loading nearby amenities…
Taxation est. · year 1
- Rental income
- $13,712
- − Mortgage interest
- −$1,120
- − Property taxes
- −$142
- − Insurance
- −$1,602
- − Repairs & maintenance
- −$1,097
- − Management
- −$1,097
- − Depreciation
- −$582
- Taxable income
- $8,071
- Est. tax owed @ 24.0%
- −$1,937
- After-tax cash flow
- $5,892/yr
For passive investors: Depreciation is non-cash, so a rental often shows a tax loss while cash-flowing — sheltering income. Rental losses are passive: they offset passive income freely, and up to $25,000/yr can offset ordinary (W-2) income if you actively participate and your MAGI is under $100k (phasing out to $0 by $150k); unused losses carry forward. On sale, claimed depreciation is recaptured at up to 25%, and gains may owe capital-gains tax (a 1031 exchange can defer both). Figures are a year-1 estimate at your 24.0% rate — not tax advice; consult a CPA.
Schools (NCES district)
- District
- Pike County
- NCES district ID
- 2104800
- Math proficiency
- 24% ▼ -24.00%
- Reading proficiency
- 40% ▼ -20.00%
- Median HH income
- $32,601
- Composite
- 26.14/100
- National rank
- #7276
- State rank
- #98 of 165 in KY
Livability — Big Rock
No livability data for this city. (Only ~50 U.S. cities are tracked.)
Census & demographics
- Population (ZIP)
- 252
Population outlook (Pike County) Hauer SSP2
- Today (2025)
- 55,108 people
- By 2030
- 51,235 · -7.0%
- By 2040
- 43,573 · -20.9%
- By 2050
- 36,797 · -33.2%
- By 2075
- 24,330 · -55.9%
- By 2100
- 15,611 · -71.7%
Race, ethnicity, and origin ACS 2023
- Neighborhood character
- Predominantly White (100%)
- Race & ethnicity
- White 100%
- Common ancestry
- Slovak 3%
- Languages at home
- 94% English-only · Spanish 6%
Political lean MEDSL · Pike
- 2024 margin
- Solid R (+65.4) · D 16.8% · R 82.2%
- 2008→2024 swing
- -51.6pp toward R · 2008: -13.8pp · 2024: -65.4pp
- All cycles
- 2024: R+65.4 2020: R+60.7 2016: R+62.8 2012: R+50.5 2008: R+13.8
Not yet ingested
- Civics
- —
Market trends
- HPI YoY
- —
- Current HPI
- —
- Rent YoY
- —
- Metro
- —
- State GDP YoY
- ▲ 2.40%
- F500 in state
- 50
Industry mix (Fortune 500 HQ in VA)
| Industry | F500 HQs | Revenue |
|---|---|---|
| Aerospace / Defense | 4 | $236B |
|
||
| Technology / Defense | 3 | $32B |
|
||
| Financial Services | 2 | $176B |
|
||
| Utilities | 2 | $27B |
|
||
| Insurance | 2 | $25B |
|
||
| Technology | 2 | $15B |
|
||
Price history
-55.6% since first listed4 events — show timeline
- 2026-03-10 Contingent — ForSaleByOwner.com
- 2026-01-15 Listed $20,000 ForSaleByOwner.com
- 2025-05-28 Price Changed $35,000 EKAR
- 2025-04-10 Listed $45,000 EKAR
Property tax history
+48.1%/yrLatest (2025): $142 · +48.1% YoY. Source: county tax records.
Cash-flow waterfall
monthlySold comps — $/sqft
last 12 mo · ≤1 miLoading sold comps…