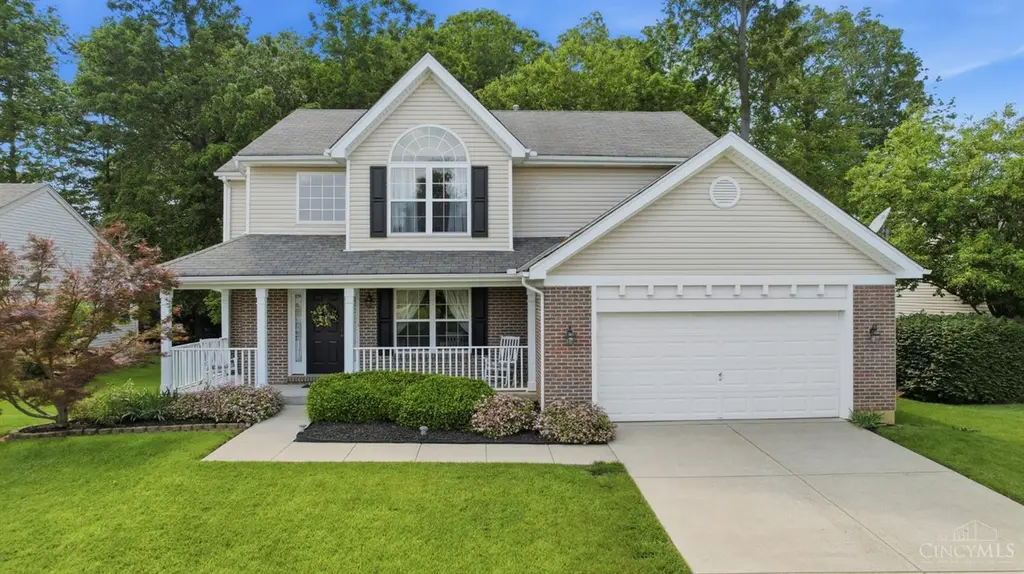
8777 Woolstone Ct · Loveland Park, OH
Flood risk 1/10 · Minimal
- FEMA flood zone
- X (unshaded)
- Chance of flooding over 30 yrs
- 0.0%
- Est. flood insurance / yr
- $473 – $860
Fire risk 1/10 · Minimal
- Est. fire insurance / yr
- $713 – $1,323
Heat risk 4/10 · Minor
- Hot days now (above 102°F)
- 7 days/yr
- Hot days in 30 yrs
- 19 days/yr
Wind risk 2/10 · Minimal
- Chance of severe wind over 30 yrs
- 1.0%
Air-quality risk 4/10 · Minor
- Unhealthy air days now
- 4 days/yr
- Unhealthy air days in 30 yrs
- 6 days/yr
Risk factors via First Street. Map © Google.
Why this score? — see what drove the D grade
The composite is a weighted blend of 9 inputs, each scored 0–100. Each bar is that input's sub-score; the figure is the points it added to the 100-point composite (weight × sub-score).
- Appreciation +10.0/10.0
- ARV discount +6.5/15.0
- Schools +6.1/10.0
- Cash flow +5.8/30.0
- Rent growth +4.4/5.0
- Livability +3.7/5.0
- Condition / age +2.5/5.0
- 1% rule +1.1/10.0
- DSCR +0.2/10.0
$409,900
🖨 Deal sheet (PDF) 📄 Offer letter ✓ Due diligence
Listing remarks
Welcome home to this beautiful, freshly painted, move in ready home on amazing wooded lot! The heart of the home features a bright, open kitchen equipped with a center island and a seating area, perfectly complemented by a charming bay window that floods the space with natural light. Convenience is key with a dedicated first-floor laundry room, while the spacious primary suite serves as a peaceful retreat, complete with a large walk-in closet. Downstairs, the partially finished walk-out basement offers fantastic flexible space for a rec room, gym, or home office. Step outside onto the deck to enjoy your private yard, perfect for weekend BBQs or quiet morning coffee. Complete with a 2-car ga
Key facts
- Wooded lot
- Seating area
- Bay window
Tags
Property features AI
Finance
- Other: Residential zoning
- HOA & community: HOA: Eclipse; Annual association fee of $300 (covers association dues and professional management)
Exterior
- Parking: Attached front garage with 2 garage spaces; Driveway parking; Street parking available
- Utilities: Public water; Public sewer; Natural gas; Gas water heater; Garage door opener
- Home design: Traditional single-family home; Two levels; Poured foundation
- Construction: Brick and vinyl siding exterior; Shingle roof
- Exterior features: Deck; Porch; Less than 0.5 acre lot
Interior
- Kitchen: Eat-in kitchen with island; Wood cabinets; Laminate floor in kitchen; Dishwasher, Garbage disposal, Microwave, Oven/Range, Refrigerator
- Bedrooms: 4 bedrooms total; Primary bedroom on second floor (15 x 16); Bedroom 2 on second floor (13 x 10); Bedroom 3 on second floor (13 x 11); Bedroom 4 on second floor (10 x 12)
- Flooring: Laminate flooring in kitchen, dining room and foyer
- Bathrooms: Two full bathrooms (both on second floor); One half bathroom on first floor
- Heating & cooling: Forced air gas heating; Central air conditioning
- Interior features: 9 total rooms; Full basement, part finished with bath rough-in and walkout; Closet in entry/foyer; Laminate flooring in foyer and dining room
- Laundry & utility: First-floor laundry room (7 x 5)
Neighborhood map
What this means for you Summary
Snapshot
- This is a 4-bed/2.5-bath single-family listed at $410k.
Deal economics
- At list price, monthly cash flow is $-811 ($-10k/yr) — negative.
- To cash-flow at today's rent, offer at most $267k (34.9% below list).
- To meet the 1% rule (rent ≥ 1% of price), the offer needs to be $249k (39.2% below list).
- Recommended offer: $249k (39.2% below list) — sets the bar for 1% rule.
Location & tenants
- Location reads 74/100 on livability (#285 in OH, #4,658 nationally) — a middle-class / working-renter tenant base. Strengths: crime A+, employment A+, cost of living A+; Watch: amenities F, commute F, health & safety F.
- Little Miami Local (rural): math 67% / reading 70% proficiency, ranked #140 of 656 in OH (top 21%) — acceptable for families but not a draw, mixed tenant base, ~2y average lease; only 17% free/reduced lunch — higher-income household profile.
- Zoned schools: Little Miami Primary School (math 76% / reading 65%, grade A-, #376 of 1,584 statewide, top 24%, 855 students, 18% FRL); Little Miami Middle School (math 67% / reading 72%, grade A, #143 of 654 statewide, top 23%, 1,279 students, 16% FRL); Little Miami High School (math 52% / reading 81%, grade B, #150 of 781 statewide, top 20%, 1,445 students, 14% FRL) — zoned schools at 16% FRL track the district average.
- Market conditions: Rents rising fast (+7.4%/yr); 130 active listings in the ZIP; 3 comparable units currently listed for rent nearby; rentals at typical pace (median 19d on market — plan ~3-4 weeks tenant-placement turnaround); solid renter incomes; 1,224 units permitted in Warren County in 2024 (474 in 5+ unit buildings).
Forward outlook
- In year one you build about $44k of equity ($3k loan paydown + $41k appreciation (10.0% local appreciation)).
- Warren County population projected at +16% by 2050 — long-run rental-demand tailwind backs the buy-and-hold thesis.
- By year 2, paydown + projected appreciation supports a ~$70k cash-out refi (75% LTV) — recoverable capital for the next deal without selling this one.
Negotiation context
- Only 5 days on market — expect competitive offers; lowballing is unlikely to land.
- Current owner paid $118k; list at $410k implies a 246% gain — meaningful room to come down on a strong offer.
Questions for the listing agent
- What do current leases actually rent for vs. the listed asking? Can we see a recent rent roll and the last 12 months of T-12 income?
- What does the HOA fee cover, when was the last increase, and are there any pending special assessments or reserve-fund shortfalls?
- Is there a deadline driving the sale (1031 exchange, divorce, estate, relocation)? That informs how much negotiation room exists.
- Schools are D-rated, which usually means shorter tenancies and higher turnover. Who's the typical renter profile here, and what's been the actual vacancy rate?
- The area grade is low — what's the realistic commute time and amenity access for the typical tenant pool here? Any planned neighborhood developments (good or bad) we should know about?
- What's the average days-on-market for RENTAL listings here right now (not sales)? A rising rental-DOM trend means longer vacancies and softer asking-rent achievability than the comps imply.
- What's the recent tenant-quality profile in this submarket — average credit score on applications, eviction rate, late-payment / NSF rate, and stable-employment percentage? A property-management company in the area should have these aggregated.
- How much new for-sale + rental construction is in the pipeline within 1–3 miles? Heavy new supply typically softens prices + rents 12–24 months out; constrained supply supports both.
Investment metrics
- 1% rule
- 0.61% ✗
- Cap rate
- 3.92%
- Cash-on-cash
- -8.48%
- DSCR
- 0.62
- GRM
- 13.7
CMA / ARV
- ARV (on-the-fly)
- $400,768
- Comps found
- 9
Show comp detail 9 sales within ~0.75 mi
| Address | Dist | Beds/Ba | Sqft | Sold | Price | $/sf | Match |
|---|---|---|---|---|---|---|---|
| 1207 Durbin Ter | 0.12mi | 4/2.5 | 2,076 (+5%) | 1mo | $412,000 | $198 | 86 |
| 1162 Linford Cir | 0.14mi | 3/2.5 (-1) | 1,880 (-5%) | 10mo | $380,000 | $202 | 71 |
| 910 Hamlin Dr | 0.37mi | 4/2.5 | 1,828 (-8%) | 1mo | $350,000 | $191 | 69 |
| 8765 Woolstone Ct | 0.01mi | 3/2.5 (-1) | 1,791 (-10%) | 11mo | $445,900 | $249 | 69 |
| 967 Hamlin Dr | 0.31mi | 4/3.0 | 2,222 (+12%) | 1mo | $465,000 | $209 | 63 |
| 1117 Stableview Cir | 0.26mi | 3/2.5 (-1) | 2,240 (+13%) | 2mo | $425,000 | $190 | 60 |
| 763 Bamburgh Dr | 0.51mi | 4/3.0 | 2,101 (+6%) | 8mo | $425,000 | $202 | 58 |
| 8724 Galecrest Dr | 0.44mi | 3/3.5 (-1) | 1,838 (-7%) | 2mo | $400,000 | $218 | 57 |
| 1191 Durbin Ter | 0.14mi | 3/2.5 (-1) | 2,256 (+14%) | 21mo | $379,900 | $168 | 48 |
Match score weights: distance 35% · size 25% · config 20% · recency 20%. Top-matched comps best support the ARV.
Projected returns pro-forma
10.0% appreciation · 7.42% rent growth · sell at horizon
- IRR
- 19.4%
- Equity multiple
- 2.60×
- Total profit
- $183,188
- Equity at exit
- $369,270
- IRR
- 18.7%
- Equity multiple
- 6.30×
- Total profit
- $608,118
- Equity at exit
- $796,346
Cash invested: $114,772 (down + closing). Projections, not guarantees.
Landlord ↔ Tenant lean methodology
- Overall (STATE)
- 73 Landlord-Friendly
- State Ohio
- 73 Landlord-Friendly · R+6
- County
- — inherits STATE
- City
- — inherits STATE
ZIP-level market 45039
- Home prices YoY
- 7.3%
- Rents YoY
- 7.4%
- Active inventory
- 130
- Price-to-rent
- 13.7×
Monthly cashflow live
- Estimated rent
- $2,492 medium interval (Pro) →
- Mortgage (P&I)
- −$2,150
- Tax from tax record
- −$434 /mo · $5,213/yr
- Insurance
- −$171
- HOA
- −$25
- Vacancy / Maint / Mgmt
- −$523
- Net cashflow
- $-811
Break-even live
Sensitivity live
| Price | -10% $-579 | -5% $-695 | +0% $-811 | +5% $-927 | +10% $-1,043 |
|---|---|---|---|---|---|
| Rent | -10% $-1,008 | -5% $-909 | +0% $-811 | +5% $-712 | +10% $-614 |
| Rate | -1.0pp $-604 | -0.5pp $-706 | base $-811 | +0.5pp $-917 | +1.0pp $-1,025 |
UW: 25.0% down · 7.5% · 30yr · 1.5% tax · 5.0% vac · 8.0% maint · 8.0% mgmt
Financing live
Cash to close
- Down payment
- $102,475
- Closing costs
- $12,297
- Reserves months
- —
- Total cash needed
- —
Loan-product check · same deal, 3 products live
Conventional
25% down · 7.5% · 30yr
- Down + closing
- —
- Monthly P&I
- —
- Monthly cashflow
- —
- DSCR
- —
- Eligible?
- —
Personal DTI + credit; lowest rate.
DSCR
20% down · 8.5% · 30yr
- Down + closing
- —
- Monthly P&I
- —
- Monthly cashflow
- —
- DSCR
- —
- Eligible?
- —
No personal income docs; deal must DSCR.
Hard money
10% down · 12.0% · 12mo
- Down + closing
- —
- Monthly P&I
- —
- Monthly cashflow
- —
- DSCR
- —
- Eligible?
- —
Short-term bridge; refi at stabilization.
Rent comps 3 comps
| Address | Beds | Baths | Sqft | Rent | $/sqft | DOM | Units | Dist |
|---|---|---|---|---|---|---|---|---|
| 2313 Rose Rd Loveland, OH | 3.0 | 2.0 | 1496 | $2,331 | $1.56 | 45d | 1 | 1.00mi |
| 8218 Melrose Ln Maineville, OH | 3.0 | 2.5 | 1458 | $2,066 | $1.42 | 18d | 1 | 1.10mi |
| 8224 Rollinghitch Ct Maineville, OH | 3.0 | 1.5 | 1261 | $1,900 | $1.51 | 18d | 1 | 1.43mi |
HOA detail
- Monthly dues
- $25 · $300/yr
- Likely covers
- gym
Listing history 15 events
-
2026-06-21days on market $409,900 Active 5 DOM
-
2026-06-18days on market $409,900 Active 2 DOM
-
2026-06-17pricedays on market $409,900 Active 1 DOM
-
2026-06-16days on market $415,000 Active 22 DOM
-
2026-06-15days on market $415,000 Active 21 DOM
-
2026-06-13days on market $415,000 Active 19 DOM
-
2026-06-09days on market $415,000 Active 15 DOM
-
2026-06-08days on market $415,000 Active 14 DOM
-
2026-06-07pricedays on market $415,000 Active 13 DOM
-
2026-06-03days on market $425,000 Active 9 DOM
-
2026-06-02days on market $425,000 Active 8 DOM
-
2026-06-01days on market $425,000 Active 7 DOM
-
2026-05-31days on market $425,000 Active 6 DOM
-
2026-05-26$425,000 Active
-
2003-01-31soldstatus $118,500
ⓘ Source: listings_history table (triggers on properties + properties_extension) + one-shot
backfill from property_details.listing_events for pre-trigger history.
Tax reassessment forecast OH · Partial reset (capped growth)
- Current annual tax
- $5,213 · $434/mo
- Projected year-2 tax
- $5,804 · $484/mo
- Expected delta
- +$591/yr (+$49/mo · 11.3%)
ⓘ Screening estimate from a state-policy table — verify with the county assessor before closing.
Climate risk First Street
- Flood 1/10 Low FEMA zone X (unshaded) · 0% chance over 30 yrs
- Wildfire 1/10 Low
- Heat 4/10 Moderate 7 d/yr ≥102°F today · 19 d/yr by 30 yrs out
- Wind 2/10 Low 100% chance of damaging wind over 30 yrs
- Air quality 4/10 Moderate 4 unhealthy d/yr today · 6 by 30 yrs out
Nearby sold comps map
Loading sold comps map…
Walkable amenities ~0.75 mi
Loading nearby amenities…
Taxation est. · year 1
- Rental income
- $29,910
- − Mortgage interest
- −$22,961
- − Property taxes
- −$5,213
- − Insurance
- −$2,050
- − Repairs & maintenance
- −$2,393
- − Management
- −$2,393
- − HOA
- −$300
- − Depreciation
- −$11,924
- Taxable loss
- −$17,324
- Est. tax savings @ 24.0%
- +$4,158
- After-tax cash flow
- $-5,571/yr
For passive investors: Depreciation is non-cash, so a rental often shows a tax loss while cash-flowing — sheltering income. Rental losses are passive: they offset passive income freely, and up to $25,000/yr can offset ordinary (W-2) income if you actively participate and your MAGI is under $100k (phasing out to $0 by $150k); unused losses carry forward. On sale, claimed depreciation is recaptured at up to 25%, and gains may owe capital-gains tax (a 1031 exchange can defer both). Figures are a year-1 estimate at your 24.0% rate — not tax advice; consult a CPA.
Schools (NCES district)
- District
- Little Miami Local
- NCES district ID
- 3905044
- Math proficiency
- 67% ▼ -11.00%
- Reading proficiency
- 70% ▼ -6.00%
- Median HH income
- $74,949
- Composite
- 60.5/100
- National rank
- #844
- State rank
- #140 of 656 in OH
Livability — Loveland Park
- Score
- 74/100
- State rank
- #285
- US rank
- #4658
Category grades
Schools grade is shown separately in the Schools card above.
Census & demographics
- County
- Warren County · 196,906 people
- Metro
- Cincinnati, OH-KY-IN
- Population (ZIP)
- 28,335
- Household income
- $108,794
- Rent vs Own
- Severe rent burden
- 307.0
Population outlook (Warren County) Hauer SSP2
- Today (2025)
- 248,603 people
- By 2030
- 259,345 · +4.3%
- By 2040
- 277,666 · +11.7%
- By 2050
- 289,599 · +16.5%
- By 2075
- 311,681 · +25.4%
- By 2100
- 302,738 · +21.8%
Race, ethnicity, and origin ACS 2023
- Neighborhood character
- Predominantly White (88%)
- Race & ethnicity
- White 88% Hispanic / Latino 5% Two or more races 5% Asian 3% Black 2%
- Common ancestry
- Romanian 2% Scotch-Irish 2% Lithuanian 2%
- Foreign-born
- 8% · Canada, Jamaica
- Languages at home
- 92% English-only · Spanish 3% Russian/Polish/Slavic 2% Other Indo-European 1%
Political lean MEDSL · Warren
- 2024 margin
- Solid R (+31.5) · D 33.8% · R 65.3%
- 2008→2024 swing
- +4.5pp toward D · 2008: -36.1pp · 2024: -31.5pp
- All cycles
- 2024: R+31.5 2020: R+30.8 2016: R+37.6 2012: R+39.5 2008: R+36.1
Not yet ingested
- Civics
- —
Market trends
- HPI YoY
- ▲ 38.63%
- Current HPI
- 568.09
- Rent YoY
- ▲ 7.42%
- Metro
- Cincinnati, OH-KY-IN
- State GDP YoY
- ▲ 1.98%
- F500 in state
- 48
Industry mix (Fortune 500 HQ in OH)
| Industry | F500 HQs | Revenue |
|---|---|---|
| Insurance | 3 | $145B |
|
||
| Industrial Machinery | 3 | $49B |
|
||
| Financial Services | 3 | $24B |
|
||
| Consumer Goods | 2 | $93B |
|
||
| Aerospace / Defense | 2 | $47B |
|
||
| Utilities | 2 | $33B |
|
||
Price history
+258.6% since first listed2 events — show timeline
- 2026-05-26 Listed $425,000 Cincy MLS
- 2003-01-31 Sold (Public Records) $118,500 Public Records
Property tax history
+3.4%/yrLatest (2025): $5,213 · -0.0% YoY. Source: county tax records.
Cash-flow waterfall
monthlySold comps — $/sqft
last 12 mo · ≤1 miLoading sold comps…