16129 W Patrick Henry Rd · Wyndham, VA
Flood risk 1/10 · Minimal
- FEMA flood zone
- X (unshaded)
- Chance of flooding over 30 yrs
- 0.0%
- Est. flood insurance / yr
- $507 – $1,088
Fire risk 4/10 · Minor
- Est. fire insurance / yr
- $666 – $1,236
Heat risk 6/10 · Moderate
- Hot days now (above 104°F)
- 7 days/yr
- Hot days in 30 yrs
- 17 days/yr
Wind risk 5/10 · Moderate
- Chance of severe wind over 30 yrs
- 20.0%
Air-quality risk 1/10 · Minimal
- Unhealthy air days now
- 0 days/yr
- Unhealthy air days in 30 yrs
- 0 days/yr
Risk factors via First Street. Map © Google.
Why this score? — see what drove the C- grade
The composite is a weighted blend of 9 inputs, each scored 0–100. Each bar is that input's sub-score; the figure is the points it added to the 100-point composite (weight × sub-score).
- Cash flow +20.3/30.0
- ARV discount +7.5/15.0
- Schools +7.0/10.0
- DSCR +6.5/10.0
- 1% rule +4.6/10.0
- Livability +3.4/5.0
- Rent growth +2.5/5.0
- Condition / age +2.5/5.0
- Appreciation +0.0/10.0
$260,000
🖨 Deal sheet 📄 Offer letter ✓ Due diligence
Listing remarks
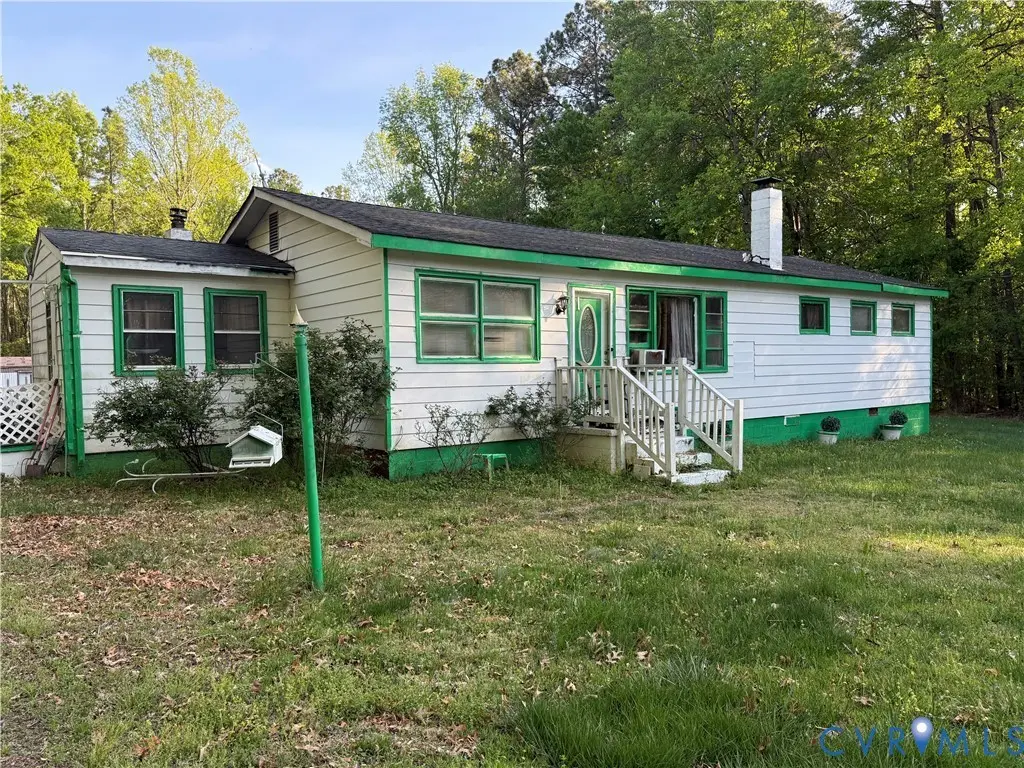
Welcome to this 3-bedroom, 1-bath ranch-style home nestled on a peaceful 2-acre rural lot offering privacy and endless potential. This property presents a great opportunity for investors or buyers looking to add their personal touch through renovation. Features include a detached 2-car garage and additional carports, providing ample parking and storage space. Property is being sold strictly AS-IS, WHERE-IS; seller will make no repairs. Cash or conventional renovation financing is likely best suited for this property. Property is unlikely to qualify for traditional FHA, VA, or USDA financing.
Key facts
- 2 acre lot
- 2 garage spots
- Built 1955
Property features AI
Exterior
- Parking: Detached garage; Two garage spaces
- Utilities: Well water; Septic tank
- Home design: Single-story home; Resale property; Has attached property
- Construction: Aluminum siding and frame construction; Shingle roof
- Exterior features: Approximately 2-acre lot; Zoned A1 (agricultural)
Interior
- Kitchen: Electric cooking
- Bathrooms: One full bathroom (first level) with tub and shower
- Heating & cooling: Forced air heating; Oil heating; Wood stove; Wall unit cooling
- Interior features: Six total rooms; Full bathroom with tub and shower
- Laundry & utility: Electric water heater
Neighborhood map
What this means for you Summary
Snapshot
- This is a 3-bed/1.0-bath single-family listed at $260k.
Deal economics
- At list price, monthly cash flow is $335 ($4k/yr) — positive.
- The deal already cash-flows at list — no discount required.
- To meet the 1% rule (rent ≥ 1% of price), the offer needs to be $249k (4.3% below list).
- Recommended offer: $249k (4.3% below list) — sets the bar for 1% rule.
- Cap rate 7.8% vs local median 1.7% in Wyndham — top-decile yield for the area; either an underpriced asset or a hidden risk that comps aren't pricing in. Stress-test before assuming the spread holds.
Location & tenants
- Location reads 67/100 on livability (#285 in VA) — a middle-class / working-renter tenant base. Strengths: crime A+, employment A+, housing A+; Watch: amenities F, commute F, cost of living F.
- Hanover County Public School District (suburban): math 79% / reading 81% proficiency, ranked #5 of 131 in VA (top 4%) — strong family-tenant draw, lease renewals of 3-5y typical; only 15% free/reduced lunch — higher-income household profile.
- Market conditions: 96 active listings in the ZIP; 447 units permitted in Hanover County in 2024 (0 in 5+ unit buildings).
Forward outlook
- Local home prices are declining (-3.0%/yr); year-one equity from $2k of loan paydown is wiped out by about $8k of value loss. Plan a longer hold.
- Hanover County population projected at +11% by 2050 — modest demand growth; plan on rents tracking national, not racing it.
Negotiation context
- It's been on market 30 days — a 2% lower offer ($256k) is reasonable based on typical stale-listing flexibility.
- Current owner paid $66k; list at $260k implies a 297% gain — meaningful room to come down on a strong offer.
Risks & watch-outs
- Watch-outs: built in 1955 — expect roof / HVAC / electrical / plumbing capex.
- Climate carrying-cost: moderate wind risk, 20% chance of damaging wind over 30y; extreme-heat days projected 7→17/yr by 2055 (HVAC capex compounding) — expect insurance premiums to compound above CPI over the hold.
Questions for the listing agent
- Built in 1955 — when were the roof, HVAC, electrical panel, plumbing, and water heater last replaced?
- Is there a deadline driving the sale (1031 exchange, divorce, estate, relocation)? That informs how much negotiation room exists.
- Schools are A-rated — typically a magnet for longer-tenancy family renters. What's the average tenant stay here, and is there a school-zone premium baked into asking?
- What's the average days-on-market for RENTAL listings here right now (not sales)? A rising rental-DOM trend means longer vacancies and softer asking-rent achievability than the comps imply.
- What's the recent tenant-quality profile in this submarket — average credit score on applications, eviction rate, late-payment / NSF rate, and stable-employment percentage? A property-management company in the area should have these aggregated.
- How much new for-sale + rental construction is in the pipeline within 1–3 miles? Heavy new supply typically softens prices + rents 12–24 months out; constrained supply supports both.
Investment metrics
- 1% rule
- 0.96% ✗
- Cap rate
- 7.84%
- Cash-on-cash
- 5.53%
- DSCR
- 1.25
- GRM
- 8.7
CMA / ARV
No comps found within radius.
Projected returns pro-forma
-3.0% appreciation · 3.0% rent growth · sell at horizon
- IRR
- -7.8%
- Equity multiple
- 0.71×
- Total profit
- $-20,843
- Equity at exit
- $38,767
- IRR
- 1.8%
- Equity multiple
- 1.12×
- Total profit
- $9,081
- Equity at exit
- $22,480
Cash invested: $72,800 (down + closing). Projections, not guarantees.
Landlord ↔ Tenant lean methodology
- Overall (STATE)
- 55 Moderately Landlord-Leaning
- State Virginia
- 55 Moderately Landlord-Leaning · D+2
- County
- — inherits STATE
- City
- — inherits STATE
ZIP-level market 23192
- Home prices YoY
- -7.4%
- Active inventory
- 96
- Price-to-rent
- 8.7×
Monthly cashflow live
- Estimated rent
- $2,487 medium interval (Pro) →
- Mortgage (P&I)
- −$1,363
- Tax from tax record
- −$158 /mo · $1,891/yr
- Insurance
- −$108
- HOA
- −$0
- Vacancy / Maint / Mgmt
- −$522
- Net cashflow
- $335
Break-even live
UW: 25.0% down · 7.5% · 30yr · 1.5% tax · 5.0% vac · 8.0% maint · 8.0% mgmt
Financing live
Cash to close
- Down payment
- $65,000
- Closing costs
- $7,800
- Reserves months
- —
- Total cash needed
- —
Loan-product check · same deal, 3 products live
Conventional
25% down · 7.5% · 30yr
- Down + closing
- —
- Monthly P&I
- —
- Monthly cashflow
- —
- DSCR
- —
- Eligible?
- —
Personal DTI + credit; lowest rate.
DSCR
20% down · 8.5% · 30yr
- Down + closing
- —
- Monthly P&I
- —
- Monthly cashflow
- —
- DSCR
- —
- Eligible?
- —
No personal income docs; deal must DSCR.
Hard money
10% down · 12.0% · 12mo
- Down + closing
- —
- Monthly P&I
- —
- Monthly cashflow
- —
- DSCR
- —
- Eligible?
- —
Short-term bridge; refi at stabilization.
Listing history 16 events
-
2026-06-18days on market $260,000 Active 30 DOM
-
2026-06-17days on market $260,000 Active 29 DOM
-
2026-06-16days on market $260,000 Active 28 DOM
-
2026-06-15days on market $260,000 Active 27 DOM
-
2026-06-13days on market $260,000 Active 25 DOM
-
2026-06-13days on market $260,000 Active 24 DOM
-
2026-06-09days on market $260,000 Active 21 DOM
-
2026-06-08days on market $260,000 Active 20 DOM
-
2026-06-07days on market $260,000 Active 19 DOM
-
2026-06-05days on market $260,000 Active 16 DOM
-
2026-06-03days on market $260,000 Active 15 DOM
-
2026-06-02days on market $260,000 Active 14 DOM
-
2026-06-01days on market $260,000 Active 13 DOM
-
2026-05-31days on market $260,000 Active 12 DOM
-
2026-05-19$260,000 Active
-
1997-10-06soldstatus $65,500
ⓘ Source: listings_history table (triggers on properties + properties_extension) + one-shot
backfill from property_details.listing_events for pre-trigger history.
Tax reassessment forecast VA · Resets to sale price
- Current annual tax
- $1,891 · $158/mo
- Projected year-2 tax
- $2,132 · $178/mo
- Expected delta
- +$241/yr (+$20/mo · 12.7%)
ⓘ Screening estimate from a state-policy table — verify with the county assessor before closing.
Climate risk First Street
- Flood 1/10 Low FEMA zone X (unshaded) · 0% chance over 30 yrs
- Wildfire 4/10 Moderate
- Heat 6/10 Major 7 d/yr ≥104°F today · 17 d/yr by 30 yrs out
- Wind 5/10 Major 20% chance of damaging wind over 30 yrs
- Air quality 1/10 Low 0 unhealthy d/yr today · 0 by 30 yrs out
Nearby sold comps map
Loading sold comps map…
Walkable amenities ~0.75 mi
Loading nearby amenities…
Taxation est. · year 1
- Rental income
- $29,843
- − Mortgage interest
- −$14,564
- − Property taxes
- −$1,891
- − Insurance
- −$1,300
- − Repairs & maintenance
- −$2,387
- − Management
- −$2,387
- − Depreciation
- −$7,564
- Taxable loss
- −$251
- Est. tax savings @ 24.0%
- +$60
- After-tax cash flow
- $4,083/yr
For passive investors: Depreciation is non-cash, so a rental often shows a tax loss while cash-flowing — sheltering income. Rental losses are passive: they offset passive income freely, and up to $25,000/yr can offset ordinary (W-2) income if you actively participate and your MAGI is under $100k (phasing out to $0 by $150k); unused losses carry forward. On sale, claimed depreciation is recaptured at up to 25%, and gains may owe capital-gains tax (a 1031 exchange can defer both). Figures are a year-1 estimate at your 24.0% rate — not tax advice; consult a CPA.
Schools (NCES district)
- District
- Hanover County Public School District
- NCES district ID
- 5101830
- Math proficiency
- 79% ▼ -11.00%
- Reading proficiency
- 81% ▼ -3.00%
- Median HH income
- $78,386
- Composite
- 70.37/100
- National rank
- #268
- State rank
- #5 of 131 in VA
Livability — Wyndham
- Score
- 67/100
- State rank
- #285
- US rank
- #10202
Category grades
Schools grade is shown separately in the Schools card above.
Census & demographics
- Population (ZIP)
- 6,445
Population outlook (Hanover County) Hauer SSP2
- Today (2025)
- 111,687 people
- By 2030
- 115,373 · +3.3%
- By 2040
- 120,828 · +8.2%
- By 2050
- 123,591 · +10.7%
- By 2075
- 132,168 · +18.3%
- By 2100
- 130,105 · +16.5%
Race, ethnicity, and origin ACS 2023
- Neighborhood character
- Predominantly White (81%)
- Race & ethnicity
- White 81% Black 10% Hispanic / Latino 6% Two or more races 5%
- Hispanic origin (detail)
- Mexican 2%
- Common ancestry
- Scotch-Irish 3% Lithuanian 3% Italian 2%
- Foreign-born
- 7% · Canada, Jamaica
- Languages at home
- 92% English-only · Russian/Polish/Slavic 4% Spanish 4% Other Indo-European 1%
Political lean MEDSL · Hanover
- 2024 margin
- Strong R (+25.8) · D 36.6% · R 62.4% · Other 1.1%
- 2008→2024 swing
- +7.8pp toward D · 2008: -33.6pp · 2024: -25.8pp
- All cycles
- 2024: R+25.8 2020: R+26.8 2016: R+32.5 2012: R+36.7 2008: R+33.6
Not yet ingested
- Civics
- —
Market trends
- HPI YoY
- ▼ -19.98%
- Current HPI
- 248.7102
- Rent YoY
- —
- Metro
- —
- State GDP YoY
- ▲ 2.40%
- F500 in state
- 50
Industry mix (Fortune 500 HQ in VA)
| Industry | F500 HQs | Revenue |
|---|---|---|
| Aerospace / Defense | 4 | $236B |
|
||
| Technology / Defense | 3 | $32B |
|
||
| Financial Services | 2 | $176B |
|
||
| Utilities | 2 | $27B |
|
||
| Insurance | 2 | $25B |
|
||
| Technology | 2 | $15B |
|
||
Price history
+296.9% since first listed2 events — show timeline
- 2026-05-19 Listed $260,000 CVRMLS
- 1997-10-06 Sold (Public Records) $65,500 Public Records
Property tax history
+5.6%/yrLatest (2026): $1,891 · +567.5% YoY. Source: county tax records.
Cash-flow waterfall
monthlySold comps — $/sqft
last 12 mo · ≤1 miLoading sold comps…