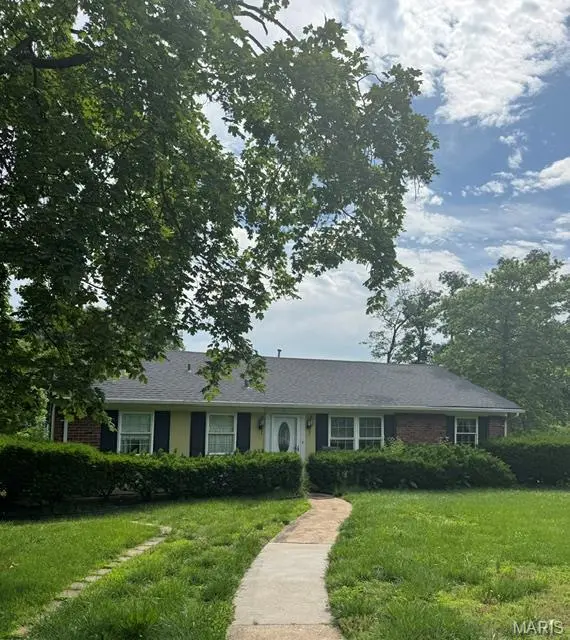
928 S Gore Ave · Webster Groves, MO
Flood risk 1/10 · Minimal
- FEMA flood zone
- X (unshaded)
- Chance of flooding over 30 yrs
- 0.0%
- Est. flood insurance / yr
- $507 – $1,088
Fire risk 1/10 · Minimal
- Est. fire insurance / yr
- $1,054 – $1,958
Heat risk 5/10 · Moderate
- Hot days now (above 107°F)
- 6 days/yr
- Hot days in 30 yrs
- 18 days/yr
Wind risk 2/10 · Minimal
- Chance of severe wind over 30 yrs
- 1.0%
Air-quality risk 3/10 · Minor
- Unhealthy air days now
- 2 days/yr
- Unhealthy air days in 30 yrs
- 4 days/yr
Risk factors via First Street. Map © Google.
Why this score? — see what drove the C+ grade
The composite is a weighted blend of 9 inputs, each scored 0–100. Each bar is that input's sub-score; the figure is the points it added to the 100-point composite (weight × sub-score).
- Cash flow +20.3/30.0
- ARV discount +15.0/15.0
- DSCR +6.4/10.0
- Schools +5.5/10.0
- 1% rule +5.0/10.0
- Rent growth +4.5/5.0
- Livability +3.9/5.0
- Condition / age +2.5/5.0
- Appreciation +0.0/10.0
$225,000
🖨 Deal sheet (PDF) 📄 Offer letter ✓ Due diligence
Listing remarks
This charming home sits on a nice lot along beautiful Gore Avenue. Approximately 1,250 square feet of living space in this well-maintained three-bedroom, one-bathroom house. The home features a newer roof and newer HVAC system, providing energy efficiency and comfort. Thermal windows throughout the home help regulate indoor temperatures year-round. The generous living room and separate family room offer ample space for relaxation and entertaining. The bright kitchen includes good cabinetry and countertop space, complemented by a dedicated dining room for meals. This home's layout and features provide versatility to meet a variety of living needs. With classic curb appeal, walkability, and a
Key facts
- 9,465 sq ft lot
- Built 1952
- Listed 16 days
Property features AI
Finance
- Financial info: Lease not considered; No second mortgage indicated
- HOA & community: Sidewalks in the community
Exterior
- Parking: Additional parking and off-street parking; Driveway and parking pad; Outside private parking (no garage)
- Utilities: Public water; Public sewer; Electric service (Ameren); Cable available; Electricity connected; Sewer connected; Water available
- Home design: Single-family residence (manufactured house); One story
- Construction: Aluminum siding; Manufactured house construction
- Exterior features: Covered, screened and enclosed rear porch with deck; Private entrance and private yard; Storage shed / equipment shed on site; Fenced front and back yard with wood fencing and gate; Landscaped, level lot with some trees and few trees; Corner lot; Near public transit; Asphalt paved road access; Storm door(s)
Interior
- Kitchen: Kitchen (appliances not specified)
- Bedrooms: 3 bedrooms, all on the main level; One bedroom with double closets
- Flooring: Ceramic tile; Laminate; Other flooring types
- Bathrooms: 1 full bathroom (main level)
- Heating & cooling: Natural gas heating; Central air conditioning; Electric and gas utilities for cooling; Ceiling fans
- Interior features: Beamed ceilings; Vaulted ceilings; Laminate countertops; Ceiling fans throughout; Blinds and window coverings; Insulated and storm windows
- Laundry & utility: Main-level laundry room with washer hookup; Laundry located in hall
Neighborhood map
What this means for you Summary
Snapshot
- This is a 3-bed/1.0-bath single-family listed at $225k.
Deal economics
- At list price, monthly cash flow is $288 ($3k/yr) — positive.
- The deal already cash-flows at list — no discount required.
- Meets the 1% rule at list price ($2k rent vs $225k).
- Recommended offer: $222k (1.5% below list) — sets the bar for market timing.
- Cap rate 7.8% vs local median 2.9% in Webster Groves — top-decile yield for the area; either an underpriced asset or a hidden risk that comps aren't pricing in. Stress-test before assuming the spread holds.
Location & tenants
- Location reads 77/100 on livability (#37 in MO, #3,184 nationally) — a middle-class / working-renter tenant base. Strengths: crime A+, employment A+, housing A+; Watch: cost of living C-, amenities F, commute F.
- Webster Groves (suburban): math 56% / reading 67% proficiency, ranked #7 of 324 in MO (top 2%) — acceptable for families but not a draw, mixed tenant base, ~2y average lease; only 13% free/reduced lunch — higher-income household profile.
- Zoned schools: Bristol Elem. (math 58% / reading 72%, grade B+, #68 of 1,115 statewide, top 6%, 388 students, 6% FRL); Hixson Middle (math 54% / reading 62%, grade B, #26 of 391 statewide, top 7%, 981 students, 12% FRL); Webster Groves High (math 50% / reading 73%, grade B-, #31 of 521 statewide, top 6%, 1,315 students, 12% FRL) — zoned schools at 10% FRL track the district average.
- Market conditions: Rents rising fast (+8.2%/yr); 157 active listings in the ZIP; 11 comparable units currently listed for rent nearby; rentals leasing fast (median 0d on market — plan ~1-2 weeks tenant-placement turnaround); solid renter incomes; 920 units permitted in St. Louis County in 2024 (250 in 5+ unit buildings).
Forward outlook
- Local home prices are declining (-3.0%/yr); year-one equity from $2k of loan paydown is wiped out by about $7k of value loss. Plan a longer hold.
- At projected returns (-3.0% appreciation + 8.0% rent growth), your $63k cash investment doubles in ~9 years — after that, you're playing with house money.
Negotiation context
- It's been on market 17 days — a 2% lower offer ($222k) is reasonable based on typical stale-listing flexibility.
Risks & watch-outs
- Watch-outs: built in 1952 — expect roof / HVAC / electrical / plumbing capex.
- Climate carrying-cost: extreme-heat days projected 6→18/yr by 2055 (HVAC capex compounding) — expect insurance premiums to compound above CPI over the hold.
Questions for the listing agent
- Built in 1952 — when were the roof, HVAC, electrical panel, plumbing, and water heater last replaced?
- Is there a deadline driving the sale (1031 exchange, divorce, estate, relocation)? That informs how much negotiation room exists.
- Schools are A-rated — typically a magnet for longer-tenancy family renters. What's the average tenant stay here, and is there a school-zone premium baked into asking?
- What's the average days-on-market for RENTAL listings here right now (not sales)? A rising rental-DOM trend means longer vacancies and softer asking-rent achievability than the comps imply.
- What's the recent tenant-quality profile in this submarket — average credit score on applications, eviction rate, late-payment / NSF rate, and stable-employment percentage? A property-management company in the area should have these aggregated.
- How much new for-sale + rental construction is in the pipeline within 1–3 miles? Heavy new supply typically softens prices + rents 12–24 months out; constrained supply supports both.
Investment metrics
- 1% rule
- 1.00% ✓
- Cap rate
- 7.83%
- Cash-on-cash
- 5.49%
- DSCR
- 1.24
- GRM
- 8.3
CMA / ARV
- ARV (on-the-fly)
- $337,500
- Comps found
- 12
Show comp detail 12 sales within ~0.75 mi
| Address | Dist | Beds/Ba | Sqft | Sold | Price | $/sf | Match |
|---|---|---|---|---|---|---|---|
| 220 Chestnut Ave | 0.54mi | 3/2.0 | 1,292 (+3%) | 2mo | $349,500 | $271 | 64 |
| 640 Lanvale Dr | 0.57mi | 2/1.0 (-1) | 1,211 (-3%) | 6mo | $295,000 | $244 | 58 |
| 55 W Drake Ave | 0.38mi | 3/1.0 | 1,081 (-14%) | 2mo | $289,900 | $268 | 58 |
| 429 Forest Green Dr | 0.57mi | 3/1.0 | 1,136 (-9%) | 2mo | $339,000 | $298 | 56 |
| 1519 Jonquil Dr | 0.56mi | 2/2.0 (-1) | 1,213 (-3%) | 5mo | $199,000 | $164 | 56 |
| 330 Oak Tree Dr | 0.56mi | 3/2.0 | 1,344 (+8%) | 5mo | $360,000 | $268 | 53 |
| 450 Forest Green Dr | 0.63mi | 3/1.0 | 1,136 (-9%) | 4mo | $285,000 | $251 | 52 |
| 1527 S Rock Hill Rd | 0.60mi | 3/1.0 | 1,413 (+13%) | 2mo | $395,000 | $280 | 49 |
| 1412 Wells Ave | 0.59mi | 2/1.0 (-1) | 1,100 (-12%) | 2mo | $299,000 | $272 | 46 |
| 719 Selma Ave | 0.55mi | 2/1.5 (-1) | 1,413 (+13%) | 5mo | $335,000 | $237 | 41 |
| 1515 Bridle Rd | 0.64mi | 3/2.0 | 1,422 (+14%) | 6mo | $435,000 | $306 | 38 |
| 203 E Jackson Rd | 0.73mi | 2/1.5 (-1) | 1,406 (+12%) | 6mo | $379,900 | $270 | 33 |
Match score weights: distance 35% · size 25% · config 20% · recency 20%. Top-matched comps best support the ARV.
Projected returns pro-forma
-3.0% appreciation · 8.0% rent growth · sell at horizon
- IRR
- -2.5%
- Equity multiple
- 0.90×
- Total profit
- $-6,170
- Equity at exit
- $33,548
- IRR
- 11.9%
- Equity multiple
- 2.15×
- Total profit
- $72,548
- Equity at exit
- $19,454
Cash invested: $63,000 (down + closing). Projections, not guarantees.
Landlord ↔ Tenant lean methodology
- Overall (STATE)
- 81 Strongly Landlord-Friendly
- State Missouri
- 81 Strongly Landlord-Friendly · R+10
- County
- — inherits STATE
- City
- — inherits STATE
ZIP-level market 63119
- Rents YoY
- 8.2%
- Active inventory
- 157
- Price-to-rent
- 8.3×
Monthly cashflow live
- Estimated rent
- $2,257 high interval (Pro) →
- Mortgage (P&I)
- −$1,180
- Tax from tax record
- −$221 /mo · $2,651/yr
- Insurance
- −$94
- HOA
- −$0
- Vacancy / Maint / Mgmt
- −$474
- Net cashflow
- $288
Break-even live
Sensitivity live
| Price | -10% $416 | -5% $352 | +0% $288 | +5% $225 | +10% $161 |
|---|---|---|---|---|---|
| Rent | -10% $110 | -5% $199 | +0% $288 | +5% $378 | +10% $467 |
| Rate | -1.0pp $402 | -0.5pp $346 | base $288 | +0.5pp $230 | +1.0pp $171 |
UW: 25.0% down · 7.5% · 30yr · 1.5% tax · 5.0% vac · 8.0% maint · 8.0% mgmt
Financing live
Cash to close
- Down payment
- $56,250
- Closing costs
- $6,750
- Reserves months
- —
- Total cash needed
- —
Loan-product check · same deal, 3 products live
Conventional
25% down · 7.5% · 30yr
- Down + closing
- —
- Monthly P&I
- —
- Monthly cashflow
- —
- DSCR
- —
- Eligible?
- —
Personal DTI + credit; lowest rate.
DSCR
20% down · 8.5% · 30yr
- Down + closing
- —
- Monthly P&I
- —
- Monthly cashflow
- —
- DSCR
- —
- Eligible?
- —
No personal income docs; deal must DSCR.
Hard money
10% down · 12.0% · 12mo
- Down + closing
- —
- Monthly P&I
- —
- Monthly cashflow
- —
- DSCR
- —
- Eligible?
- —
Short-term bridge; refi at stabilization.
Rent comps 11 comps
| Address | Beds | Baths | Sqft | Rent | $/sqft | DOM | Units | Dist |
|---|---|---|---|---|---|---|---|---|
| 1020 S Rock Hill Rd Webster Groves, MO | 3.0 | 2.0 | 1575 | $2,550 | $1.62 | 0d | 1 | 0.35mi |
| 437 S Elm Ave Saint Louis, MO | 3.0 | 1.0 | 1242 | $2,100 | $1.69 | 0d | 1 | 0.52mi |
| 8501 Grantshire Ln Saint Louis, MO | 2.0 | 1.0 | 1212 | $1,995 | $1.65 | 0d | 1 | 0.86mi |
| 4 Girard Dr Saint Louis, MO | 3.0 | 2.0 | 1462 | $2,500 | $1.71 | 0d | 1 | 0.93mi |
| 4 Girard Dr Saint Louis, MO | 3.0 | 2.0 | 1462 | $2,650 | $1.81 | 9d | 1 | 0.93mi |
| 7482 Hardscrapple Dr St. Louis, MO | 1.0–2.0 | 1.0–1.5 | 812 | $1,695 | $2.09 | 0d | 32 | 1.13mi |
| 7508 General Sherman Ln Saint Louis, MO | 3.0 | 1.0 | 1576 | $1,865 | $1.18 | 20d | 1 | 1.21mi |
| 723 Landscape Ave Saint Louis, MO | 2.0 | 2.5 | 1800 | $2,350 | $1.31 | 20d | 1 | 1.25mi |
| 341 W Pacific Ave Saint Louis, MO | 2.0 | 1.5 | 1200 | $1,995 | $1.66 | 22d | 1 | 1.28mi |
| 7243 General Sherman Ln Saint Louis, MO | 3.0 | 1.5 | 1200 | $2,576 | $2.15 | 0d | 1 | 1.42mi |
| 139 W Kirkham Ave Saint Louis, MO | 2.0 | 2.5 | 1163 | $2,300 | $1.98 | 16d | 1 | 1.46mi |
Listing history 18 events
-
2026-06-21days on market $225,000 Active 17 DOM
-
2026-06-18pricestatus $225,000 Active 14 DOM
-
2026-06-18days on market $250,000 Active Under Contract 14 DOM
-
2026-06-17days on market $250,000 Active Under Contract 13 DOM
-
2026-06-16days on market $250,000 Active Under Contract 12 DOM
-
2026-06-15days on market $250,000 Active Under Contract 11 DOM
-
2026-06-13days on market $250,000 Active Under Contract 9 DOM
-
2026-06-13statusdays on market $250,000 Active Under Contract 8 DOM
-
2026-06-09days on market $250,000 Active 5 DOM
-
2026-06-08days on market $250,000 Active 4 DOM
-
2026-06-07statusdays on market $250,000 Active 3 DOM
-
2026-06-05remarks 699-char remark
-
2026-06-05days on market $250,000 Coming Soon 6 DOM
-
2026-06-03days on market $250,000 Coming Soon 5 DOM
-
2026-06-02days on market $250,000 Coming Soon 4 DOM
-
2026-06-01days on market $250,000 Coming Soon 3 DOM
-
2026-05-31days on market $250,000 Coming Soon 2 DOM
-
2026-05-29historical $250,000
ⓘ Source: listings_history table (triggers on properties + properties_extension) + one-shot
backfill from property_details.listing_events for pre-trigger history.
Tax reassessment forecast MO · Resets to sale price
- Current annual tax
- $2,651 · $221/mo
- Projected year-2 tax
- $2,651 · $221/mo
- Expected delta
- $0/yr ($0/mo · 0.0%)
ⓘ Screening estimate from a state-policy table — verify with the county assessor before closing.
Climate risk First Street
- Flood 1/10 Low FEMA zone X (unshaded) · 0% chance over 30 yrs
- Wildfire 1/10 Low
- Heat 5/10 Major 6 d/yr ≥107°F today · 18 d/yr by 30 yrs out
- Wind 2/10 Low 100% chance of damaging wind over 30 yrs
- Air quality 3/10 Moderate 2 unhealthy d/yr today · 4 by 30 yrs out
Nearby sold comps map
Loading sold comps map…
Walkable amenities ~0.75 mi
Loading nearby amenities…
Taxation est. · year 1
- Rental income
- $27,083
- − Mortgage interest
- −$12,603
- − Property taxes
- −$2,651
- − Insurance
- −$1,125
- − Repairs & maintenance
- −$2,167
- − Management
- −$2,167
- − Depreciation
- −$6,545
- Taxable loss
- −$175
- Est. tax savings @ 24.0%
- +$42
- After-tax cash flow
- $3,502/yr
For passive investors: Depreciation is non-cash, so a rental often shows a tax loss while cash-flowing — sheltering income. Rental losses are passive: they offset passive income freely, and up to $25,000/yr can offset ordinary (W-2) income if you actively participate and your MAGI is under $100k (phasing out to $0 by $150k); unused losses carry forward. On sale, claimed depreciation is recaptured at up to 25%, and gains may owe capital-gains tax (a 1031 exchange can defer both). Figures are a year-1 estimate at your 24.0% rate — not tax advice; consult a CPA.
Schools (NCES district)
- District
- Webster Groves
- NCES district ID
- 2931530
- Math proficiency
- 56% ▼ -3.00%
- Reading proficiency
- 67% ▲ 3.00%
- Median HH income
- $78,389
- Composite
- 54.99/100
- National rank
- #1298
- State rank
- #7 of 324 in MO
Livability — Webster Groves
- Score
- 77/100
- State rank
- #37
- US rank
- #3184
Category grades
Schools grade is shown separately in the Schools card above.
Census & demographics
- Census place
- Webster Groves, MO
- County
- Saint Louis County · 888,823 people
- City population
- 34,181
- Metro
- St. Louis, MO-IL
- Population (ZIP)
- 34,181
- Household income
- $106,183
- Rent vs Own
- Severe rent burden
- 1320.0
Population outlook (St. Louis County) Hauer SSP2
- Today (2025)
- 1,025,227 people
- By 2030
- 1,028,023 · +0.3%
- By 2040
- 1,020,940 · -0.4%
- By 2050
- 1,007,280 · -1.8%
- By 2075
- 987,277 · -3.7%
- By 2100
- 921,984 · -10.1%
Race, ethnicity, and origin ACS 2023
- Neighborhood character
- Predominantly White (77%)
- Race & ethnicity
- White 77% Black 10% Two or more races 9% Hispanic / Latino 3% Asian 2%
- Common ancestry
- Lithuanian 4% Slovak 3% Romanian 3%
- Foreign-born
- 6% · Canada
- Languages at home
- 93% English-only · Spanish 1% Other Indo-European 1% German/W. Germanic 1%
Political lean MEDSL · St. Louis
- 2024 margin
- Strong D (+23.4) · D 60.8% · R 37.4% · Other 1.7%
- 2008→2024 swing
- +3.5pp toward D · 2008: 19.9pp · 2024: 23.4pp
- All cycles
- 2024: D+23.4 2020: D+24.0 2016: D+16.2 2012: D+13.7 2008: D+19.9
Not yet ingested
- Civics
- —
Market trends
- HPI YoY
- ▼ -463.48%
- Current HPI
- 221.7655
- Rent YoY
- ▲ 8.19%
- Metro
- St. Louis, MO-IL
- State GDP YoY
- ▲ 1.84%
- F500 in state
- 20
Industry mix (Fortune 500 HQ in MO)
| Industry | F500 HQs | Revenue |
|---|---|---|
| Healthcare | 1 | $163B |
|
||
| Insurance | 1 | $21B |
|
||
| Industrial Technology | 1 | $17B |
|
||
| Retail | 1 | $16B |
|
||
| Industrial Distribution | 1 | $10B |
|
||
| Utilities | 1 | $9B |
|
||
Price history
1 event — show timeline
- 2026-05-29 Coming Soon $250,000 MARIS as Distributed by MLS Grid
Property tax history
+0.3%/yrLatest (2022): $2,651 · +0.3% YoY. Source: county tax records.
Cash-flow waterfall
monthlySold comps — $/sqft
last 12 mo · ≤1 miLoading sold comps…