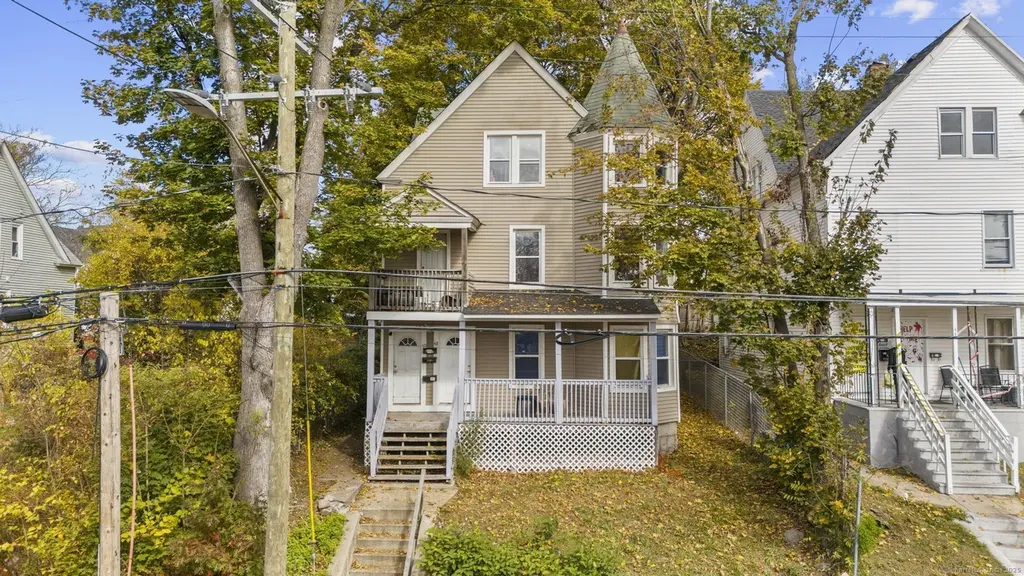
 Triplex
48 Dikeman St · Waterbury, CT
Flood risk 1/10 · Minimal
- FEMA flood zone
- X (unshaded)
- Chance of flooding over 30 yrs
- 0.0%
- Est. flood insurance / yr
- $473 – $860
Fire risk 1/10 · Minimal
- Est. fire insurance / yr
- $829 – $1,539
Heat risk 5/10 · Moderate
- Hot days now (above 96°F)
- 7 days/yr
- Hot days in 30 yrs
- 15 days/yr
Wind risk 6/10 · Moderate
- Chance of severe wind over 30 yrs
- 27.0%
Air-quality risk 3/10 · Minor
- Unhealthy air days now
- 2 days/yr
- Unhealthy air days in 30 yrs
- 3 days/yr
Risk factors via First Street. Map © Google.
Why this score? — see what drove the C grade
The composite is a weighted blend of 9 inputs, each scored 0–100. Each bar is that input's sub-score; the figure is the points it added to the 100-point composite (weight × sub-score).
- Cash flow +26.6/30.0
- DSCR +9.1/10.0
- 1% rule +7.0/10.0
- Rent growth +4.5/5.0
- Livability +4.0/5.0
- Condition / age +2.5/5.0
- Appreciation +1.5/10.0
- Schools +1.5/10.0
- ARV discount +0.0/15.0
$445,500
🖨 Deal sheet 📄 Offer letter ✓ Due diligence
Multi-family units
County records classify this as Multi-Family (2-4 Unit). Listing-text estimate: 3 units. confirmed
Listing remarks MLS
Cash-flowing, well-maintained 3-family in the desirable W.O.W. neighborhood of Waterbury, offering a strong opportunity for both investors and owner-occupants. Ideal setup to live in one unit while collecting rent from the others. 1st and 2nd floors feature approx. 1,000 SF with 3 bedrooms, living room, full bath, and eat-in kitchen. 3rd floor is approx. 1,000 SF with 2 bedrooms, living room, full bath, and eat-in kitchen. Hardwood floors throughout with some kitchen and bath updates across the units. Separate utilities for each unit-1st floor is gas, 2nd and 3rd floors are electric. All units include laundry hookups. On-street parking only, keeping expenses low for ownership. Turn-key, low-maintenance asset with solid income potential. PROPERTY WILL HAVE AN ENTIRELY NEW ROOF BEFORE CLOSING. Conveniently located near public transportation, major highways, downtown, shopping, hospitals, and other amenities.
Key facts
- Separate utilities
- Downtown
- Laundry hookups
Tags
Neighborhood map
What this means for you Summary
Snapshot
- This is a 3 × 3-bed/1.0-bath units multifamily listed at $446k.
Deal economics
- At list price, monthly cash flow is $1k ($14k/yr) — positive. Per door: $398/mo.
- The deal already cash-flows at list — no discount required.
- Meets the 1% rule at list price ($5k rent vs $446k).
- Recommended offer: $432k (3.0% below list) — sets the bar for market timing.
- Cap rate 9.5% vs local median 3.6% in Waterbury — top-decile yield for the area; either an underpriced asset or a hidden risk that comps aren't pricing in. Stress-test before assuming the spread holds.
Location & tenants
- Location reads 79/100 on livability (#32 in CT, #2,205 nationally) — a middle-class / working-renter tenant base. Strengths: commute A+, cost of living A+, housing A+; Watch: schools D+, crime D, employment D.
- Waterbury School District (suburban): math 12% / reading 23% proficiency, ranked #148 of 153 in CT (top 97%) — low school quality limits family demand, transient renter base, plan for 1-2y turnover; 73% free/reduced lunch — lower-income household profile, screen leases tightly.
- Market conditions: Rents rising fast (+8.0%/yr); 100 active listings in the ZIP; 1 comparable units currently listed for rent nearby; 502 units permitted in Naugatuck Valley Planning Region in 2024 (171 in 5+ unit buildings).
- At $5,326/mo this rent would consume 131% of the median local household income ($49k/yr) (locally 1981% of renters already pay >50% of income on rent) — very limited rent-growth headroom before tenants either downsize or default.
Forward outlook
- Local home prices are declining (-3.0%/yr); year-one equity from $3k of loan paydown is wiped out by about $13k of value loss. Plan a longer hold.
- At projected returns (-3.0% appreciation + 8.0% rent growth), your $125k cash investment doubles in ~7 years — after that, you're playing with house money.
Negotiation context
- It's been on market 51 days — a 3% lower offer ($432k) is reasonable based on typical stale-listing flexibility.
- 7 sale attempts since 18y ago with the ask held roughly flat each time — persistent listings suggest the price (not the market) is what's stuck; bring a comps-based counter.
- Current owner paid $25k; list at $446k implies a 1682% gain — meaningful room to come down on a strong offer.
Risks & watch-outs
- Watch-outs: built in 1898 — expect roof / HVAC / electrical / plumbing capex.
- Climate carrying-cost: major wind risk, 27% chance of damaging wind over 30y; extreme-heat days projected 7→15/yr by 2055 (HVAC capex compounding) — expect insurance premiums to compound above CPI over the hold.
Questions for the listing agent
- It's been on market 51 days. Have you received any prior offers? Is the seller open to a 3% concession, seller financing, or rate buy-down credit?
- Can we see the unit-by-unit rent roll, current vacancy, and any below-market leases? What's the average tenancy length?
- What capital expenditures (roof, boiler, parking lot, exteriors) have been made in the last 5 years, and what's planned in the next 2?
- Built in 1898 — when were the roof, HVAC, electrical panel, plumbing, and water heater last replaced?
- Is there a deadline driving the sale (1031 exchange, divorce, estate, relocation)? That informs how much negotiation room exists.
- Schools are D-rated, which usually means shorter tenancies and higher turnover. Who's the typical renter profile here, and what's been the actual vacancy rate?
- Crime grade is D in this area — have there been break-ins, vandalism, or insurance claims at this property in the last 3 years? What carrier currently insures it and at what premium?
- What's the average days-on-market for RENTAL listings here right now (not sales)? A rising rental-DOM trend means longer vacancies and softer asking-rent achievability than the comps imply.
- What's the recent tenant-quality profile in this submarket — average credit score on applications, eviction rate, late-payment / NSF rate, and stable-employment percentage? A property-management company in the area should have these aggregated.
- How much new apartment / multifamily construction is in the pipeline within 1–3 miles? Heavy new supply (>2% of stock underway) typically softens rents 12–24 months out; light construction supports rent growth.
Investment metrics
- 1% rule
- 1.20% ✓
- Cap rate
- 9.51%
- Cash-on-cash
- 11.48%
- DSCR
- 1.51
- GRM
- 7.0
CMA / ARV
- ARV (median comp)
- $379,486
- List price
- $445,500
- Delta
- 17.40%
- Verdict
- OVERPRICED
- Comps
- 20 within 1.0 mi
Show comp detail 12 sales within ~0.75 mi
| Address | Dist | Beds/Ba | Sqft | Sold | Price | $/sf | Match |
|---|---|---|---|---|---|---|---|
| 11 Putnam St | 0.02mi | 6/3.0 | 3,188 (-0%) | 11mo | $387,000 | $121 | 90 |
| 64 Wood St | 0.11mi | 7/3.0 (+1) | 3,393 (+6%) | 1mo | $495,000 | $146 | 79 |
| 245 Walnut St | 0.12mi | 7/3.0 (+1) | 2,970 (-7%) | 0mo | $210,000 | $71 | 78 |
| 290 Orange St | 0.22mi | 7/3.0 (+1) | 3,050 (-4%) | 7mo | $435,000 | $143 | 71 |
| 21 Violet St | 0.33mi | 6/3.0 | 2,941 (-8%) | 4mo | $270,000 | $92 | 68 |
| 28 Wall St | 0.32mi | 6/3.0 | 3,280 (+3%) | 15mo | $292,500 | $89 | 68 |
| 33 Albert Pl | 0.13mi | 7/3.0 (+1) | 3,584 (+12%) | 1mo | $385,000 | $107 | 67 |
| 78 Griggs St | 0.46mi | 7/3.0 (+1) | 3,456 (+8%) | 2mo | $470,000 | $136 | 58 |
| 205 Cooke St | 0.60mi | 6/3.0 | 3,439 (+8%) | 5mo | $380,000 | $110 | 55 |
| 133-135 Byrneside Ave | 0.74mi | 6/3.0 | 3,355 (+5%) | 14mo | $300,000 | $89 | 46 |
| 230 Hill St | 0.72mi | 6/3.0 | 3,582 (+12%) | 8mo | $435,000 | $121 | 40 |
| 36 Irving St | 0.71mi | 6/2.0 | 3,408 (+7%) | 16mo | $250,000 | $73 | 39 |
Match score weights: distance 35% · size 25% · config 20% · recency 20%. Top-matched comps best support the ARV.
Projected returns pro-forma
-3.0% appreciation · 8.0% rent growth · sell at horizon
- IRR
- 6.2%
- Equity multiple
- 1.26×
- Total profit
- $32,033
- Equity at exit
- $66,425
- IRR
- 19.6%
- Equity multiple
- 3.04×
- Total profit
- $254,073
- Equity at exit
- $38,519
Cash invested: $124,740 (down + closing). Projections, not guarantees.
Landlord ↔ Tenant lean methodology
- Overall (STATE)
- 27 Tenant-Leaning
- State Connecticut
- 27 Tenant-Leaning · D+7
- County
- — inherits STATE
- City
- — inherits STATE
ZIP-level market 06704
- Home prices YoY
- -2.0%
- Rents YoY
- 8.0%
- Active inventory
- 100
- Price-to-rent
- 20.9×
Monthly cashflow live
- Estimated rent
- $5,326 high interval (Pro) →
- Mortgage (P&I)
- −$2,336
- Tax from tax record
- −$492 /mo · $5,902/yr
- Insurance
- −$186
- HOA
- −$0
- Vacancy / Maint / Mgmt
- −$1,118
- Net cashflow
- $1,194
Break-even live
3-unit breakdown (identical units grouped — click to expand)
| Units | Beds | Baths | Est. rent |
|---|---|---|---|
| 3× units | 3 | 1 | $5,325 |
| #1 | 3 | 1 | $1,775 |
| #2 | 3 | 1 | $1,775 |
| #3 | 3 | 1 | $1,775 |
| Total (3 units) | $5,326 | ||
UW: 25.0% down · 7.5% · 30yr · 1.5% tax · 5.0% vac · 8.0% maint · 8.0% mgmt
Financing live
Cash to close
- Down payment
- $111,375
- Closing costs
- $13,365
- Reserves months
- —
- Total cash needed
- —
Loan-product check · same deal, 3 products live
Conventional
25% down · 7.5% · 30yr
- Down + closing
- —
- Monthly P&I
- —
- Monthly cashflow
- —
- DSCR
- —
- Eligible?
- —
Personal DTI + credit; lowest rate.
DSCR
20% down · 8.5% · 30yr
- Down + closing
- —
- Monthly P&I
- —
- Monthly cashflow
- —
- DSCR
- —
- Eligible?
- —
No personal income docs; deal must DSCR.
Hard money
10% down · 12.0% · 12mo
- Down + closing
- —
- Monthly P&I
- —
- Monthly cashflow
- —
- DSCR
- —
- Eligible?
- —
Short-term bridge; refi at stabilization.
Rent comps 1 comps
| Address | Beds | Baths | Sqft | Rent | $/sqft | DOM | Units | Dist |
|---|---|---|---|---|---|---|---|---|
| 14 Niagara St Waterbury, CT | 6.0 | 3.0 | 3156 | $1,700 | $0.54 | 3d | 1 | 0.88mi |
Listing history 21 events
-
2026-06-07days on market $445,500 Active 51 DOM
-
2026-06-05days on market $445,500 Active 48 DOM
-
2026-06-03days on market $445,500 Active 47 DOM
-
2026-06-03days on market $445,500 Active 46 DOM
-
2026-06-01days on market $445,500 Active 45 DOM
-
2026-05-31days on market $445,500 Active 44 DOM
-
2026-04-17$445,500 Active 919-char remark
Show marketing remark (919 chars)
Cash-flowing, well-maintained 3-family in the desirable W.O.W. neighborhood of Waterbury, offering a strong opportunity for both investors and owner-occupants. Ideal setup to live in one unit while collecting rent from the others. 1st and 2nd floors feature approx. 1,000 SF with 3 bedrooms, living room, full bath, and eat-in kitchen. 3rd floor is approx. 1,000 SF with 2 bedrooms, living room, full bath, and eat-in kitchen. Hardwood floors throughout with some kitchen and bath updates across the units. Separate utilities for each unit-1st floor is gas, 2nd and 3rd floors are electric. All units include laundry hookups. On-street parking only, keeping expenses low for ownership. Turn-key, low-maintenance asset with solid income potential. PROPERTY WILL HAVE AN ENTIRELY NEW ROOF BEFORE CLOSING. Conveniently located near public transportation, major highways, downtown, shopping, hospitals, and other amenities.
-
2026-04-14historical
-
2026-04-02$459,900 Active
-
2026-03-01historical
-
2026-01-20$449,900 Active
-
2025-12-15historical
-
2025-10-31price $449,900
-
2025-10-30$499,900 Active
-
2022-08-09historical
-
2022-05-25$270,000 Active
-
2009-01-28soldstatus $25,000
-
2008-12-08$28,900
-
2008-07-08historical
-
2008-04-09$146,000
-
2005-12-14soldstatus $61,000
ⓘ Source: listings_history table (triggers on properties + properties_extension) + one-shot
backfill from property_details.listing_events for pre-trigger history.
Tax reassessment forecast CT · Partial reset (capped growth)
- Current annual tax
- $5,902 · $492/mo
- Projected year-2 tax
- $7,718 · $643/mo
- Expected delta
- +$1,816/yr (+$151/mo · 30.8%)
ⓘ Screening estimate from a state-policy table — verify with the county assessor before closing.
Climate risk First Street
- Flood 1/10 Low FEMA zone X (unshaded) · 0% chance over 30 yrs
- Wildfire 1/10 Low
- Heat 5/10 Major 7 d/yr ≥96°F today · 15 d/yr by 30 yrs out
- Wind 6/10 Major 27% chance of damaging wind over 30 yrs
- Air quality 3/10 Moderate 2 unhealthy d/yr today · 3 by 30 yrs out
Nearby sold comps map
Loading sold comps map…
Walkable amenities ~0.75 mi
Loading nearby amenities…
Taxation est. · year 1
- Rental income
- $63,912
- − Mortgage interest
- −$24,955
- − Property taxes
- −$5,902
- − Insurance
- −$2,228
- − Repairs & maintenance
- −$5,113
- − Management
- −$5,113
- − Depreciation
- −$12,960
- Taxable income
- $7,642
- Est. tax owed @ 24.0%
- −$1,834
- After-tax cash flow
- $12,492/yr
For passive investors: Depreciation is non-cash, so a rental often shows a tax loss while cash-flowing — sheltering income. Rental losses are passive: they offset passive income freely, and up to $25,000/yr can offset ordinary (W-2) income if you actively participate and your MAGI is under $100k (phasing out to $0 by $150k); unused losses carry forward. On sale, claimed depreciation is recaptured at up to 25%, and gains may owe capital-gains tax (a 1031 exchange can defer both). Figures are a year-1 estimate at your 24.0% rate — not tax advice; consult a CPA.
Schools (NCES district)
- District
- Waterbury School District
- NCES district ID
- 0904830
- Math proficiency
- 12% ▼ -7.00%
- Reading proficiency
- 23% ▼ -8.00%
- Median HH income
- $40,040
- Composite
- 14.85/100
- National rank
- #9380
- State rank
- #148 of 153 in CT
Livability — Waterbury
- Score
- 79/100
- State rank
- #32
- US rank
- #2205
Category grades
Schools grade is shown separately in the Schools card above.
Census & demographics
- Census place
- Waterbury, CT
- County
- New Haven County · 688,236 people
- City population
- 115,012
- Metro
- New Haven-Milford, CT
- Population (ZIP)
- 31,713
- Household income
- $48,718
- Rent vs Own
- Severe rent burden
- 1981.0
Population outlook (Naugatuck Valley County) Hauer SSP2
- By 2040
- 496,846
Race, ethnicity, and origin ACS 2023
- Neighborhood character
- Diverse neighborhood (Simpson 0.66)
- Race & ethnicity
- Hispanic / Latino 48% Black 28% Two or more races 20% White 18% Asian 2%
- Hispanic origin (detail)
- Mexican 2% Puerto Rican 30% Dominican 8%
- Common ancestry
- Romanian 2% Lithuanian 1% Russian 1%
- Foreign-born
- 16% · Canada, South Korea
- Languages at home
- 56% English-only · Spanish 38% Other Indo-European 3% French/Haitian/Cajun 1%
Political lean MEDSL · Naugatuck Valley
- 2024 margin
- Lean R (+7.4) · D 45.6% · R 53.0% · Other 1.4%
- All cycles
- 2024: R+7.4
Not yet ingested
- Civics
- —
Market trends
- HPI YoY
- ▼ -7.05%
- Current HPI
- 340.0917
- Rent YoY
- ▲ 8.02%
- Metro
- New Haven-Milford, CT
- State GDP YoY
- ▲ 1.06%
- F500 in state
- 38
Industry mix (Fortune 500 HQ in CT)
| Industry | F500 HQs | Revenue |
|---|---|---|
| Industrial Machinery | 4 | $38B |
|
||
| Insurance | 3 | $71B |
|
||
| Financial Services | 2 | $25B |
|
||
| Transportation / Logistics | 2 | $18B |
|
||
| Healthcare | 1 | $247B |
|
||
| Telecommunications | 1 | $55B |
|
||
Price history
+630.3% since first listed15 events — show timeline
- 2026-04-17 Listed $445,500 Smart MLS
- 2026-04-14 Listing Removed — Smart MLS
- 2026-04-02 Listed $459,900 Smart MLS
- 2026-03-01 Listing Removed — Smart MLS
- 2026-01-20 Listed $449,900 Smart MLS
- 2025-12-15 Listing Removed — Smart MLS
- 2025-10-31 Price Changed $449,900 Smart MLS
- 2025-10-30 Listed $499,900 Smart MLS
- 2022-08-09 Listing Removed — Smart MLS
- 2022-05-25 Listed $270,000 Smart MLS
- 2009-01-28 Sold (MLS) $25,000 Smart MLS
- 2008-12-08 Listed $28,900 Smart MLS
- 2008-07-08 Listing Removed — Smart MLS
- 2008-04-09 Listed $146,000 Smart MLS
- 2005-12-14 Sold (Public Records) $61,000 Public Records
Property tax history
+5.3%/yrLatest (2023): $5,902 · +78.4% YoY. Source: county tax records.
Cash-flow waterfall
monthlySold comps — $/sqft
last 12 mo · ≤1 miLoading sold comps…