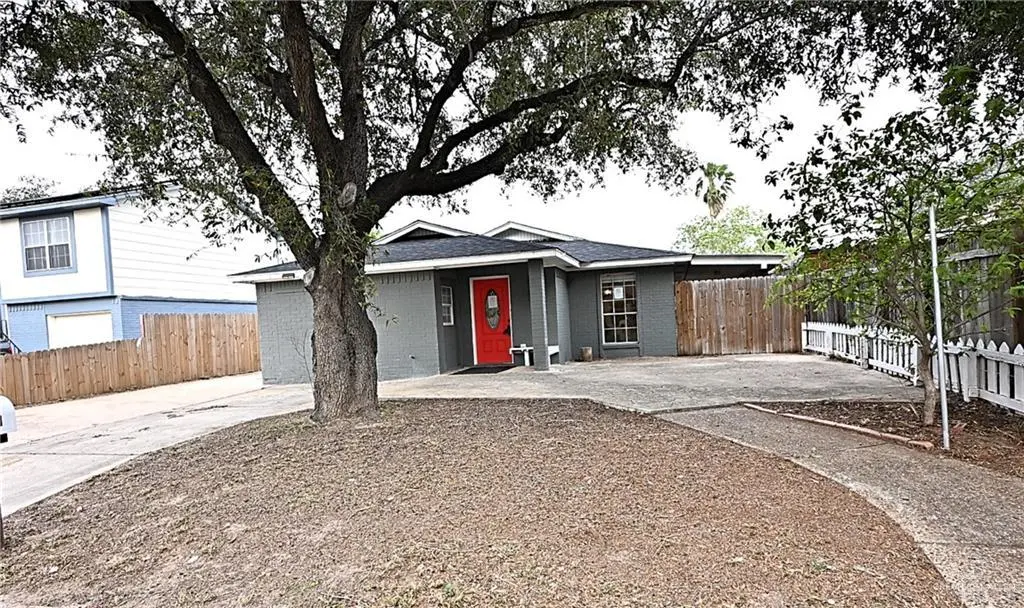
2721 N 26th St · McAllen, TX
Flood risk 1/10 · Minimal
- FEMA flood zone
- X (shaded)
- Chance of flooding over 30 yrs
- 0.0%
- Est. flood insurance / yr
- $507 – $1,088
Fire risk 1/10 · Minimal
- Est. fire insurance / yr
- $1,222 – $2,270
Heat risk 9/10 · Severe
- Hot days now (above 111°F)
- 7 days/yr
- Hot days in 30 yrs
- 22 days/yr
Wind risk 8/10 · Major
- Chance of severe wind over 30 yrs
- 99.0%
Air-quality risk 3/10 · Minor
- Unhealthy air days now
- 1 days/yr
- Unhealthy air days in 30 yrs
- 4 days/yr
Risk factors via First Street. Map © Google.
Why this score? — see what drove the F grade
The composite is a weighted blend of 9 inputs, each scored 0–100. Each bar is that input's sub-score; the figure is the points it added to the 100-point composite (weight × sub-score).
- ARV discount +8.4/15.0
- Cash flow +6.2/30.0
- Livability +3.8/5.0
- Schools +3.3/10.0
- Rent growth +2.9/5.0
- Condition / age +2.5/5.0
- 1% rule +2.2/10.0
- DSCR +0.5/10.0
- Appreciation +0.0/10.0
$169,900
🖨 Deal sheet 📄 Offer letter ✓ Due diligence
Listing remarks MLS
*FORECLOSURE* THIS ONE STORY BRICK HOME HAS LOT'S POTENTIAL. WITH A LITTLE TLC IT COULD BE A GREAT HOME! GARAGE HAS BEEN CONVERTED INTO A BEDROOM. SPACIOUS LIVING ROOM WITH SLIDING GLASS DOORS TO THE EXTERIOR. SOLD AS IS. DUE DILIGENCE TO BE DONE PRIOR TO BIDDING. BUYER OR BUYER S AGENT TO VERIFY ALL INFORMATION: SCHOOLS, TAXES, RESTRICTIONS AND ROOM SIZES, ETC.
Key facts
- Covered porch
- Shopping centers
- Garage converted
Tags
Property features AI
Finance
- Other: Lot area about 5,249 square feet (0.1205 acres)
- HOA & community: No association
Exterior
- Parking: No garage; No carport; No covered parking (0 total parking spaces)
- Utilities: Public water; City sewer; Electric service for heating and cooling
- Home design: Property information from HidalgoCAD
- Construction: Brick and stone construction; Shingle roof; Slab foundation; Building area approximately 1,489 square feet
- Exterior features: Privacy wood fence; Mature trees; Paved road access
Interior
- Kitchen: Electric water heater; No conveying appliances
- Flooring: Tile
- Bathrooms: 2 full bathrooms
- Heating & cooling: Central heating (electric); Central air conditioning (electric)
- Interior features: Granite countertops; Ceiling fans; No window coverings
- Laundry & utility: Laundry closet
Neighborhood map
What this means for you Summary
Snapshot
- This is a 3-bed/2.0-bath single-family listed at $170k.
Deal economics
- At list price, monthly cash flow is $-313 ($-4k/yr) — negative.
- To cash-flow at today's rent, offer at most $115k (32.5% below list).
- To meet the 1% rule (rent ≥ 1% of price), the offer needs to be $122k (28.5% below list).
- Recommended offer: $115k (32.5% below list) — sets the bar for cash-flow.
Location & tenants
- Location reads 76/100 on livability (#119 in TX, #3,771 nationally) — a middle-class / working-renter tenant base. Strengths: cost of living A+, housing A+, health & safety A+; Watch: employment D, amenities F, commute F.
- Mcallen ISD (urban): math 34% / reading 45% proficiency, ranked #440 of 826 in TX (top 53%) — families likely to look elsewhere, expect single-tenant / working-renter base with shorter leases.
- Zoned schools: Seguin El (math 22% / reading 27%, grade F, #3,052 of 4,322 statewide, top 74%, 577 students, 96% FRL); De Leon Middle (math 20% / reading 38%, grade F, #1,103 of 1,662 statewide, top 67%, 800 students, 86% FRL); Rowe H S (math 25% / reading 53%, grade F, #859 of 1,632 statewide, top 53%, 1,944 students, 74% FRL) — zoned schools average 85% FRL vs 50% district-wide (35 pts higher); higher-poverty schools than district average — tighter screening recommended.
- Market conditions: Rents rising (+1.8%/yr); 385 active listings in the ZIP; 40 comparable units currently listed for rent nearby; rentals lingering (median 44d on market — plan ~5-8 weeks vacancy on turnover, expect pricing pressure); 52% of comp listings sitting > 30 days — soft ceiling on asking rent; 7,378 units permitted in Hidalgo County in 2024 (641 in 5+ unit buildings).
- This rent runs 30% of the median local income ($48k/yr) — at the standard rent-burdened threshold; future hikes will face affordability resistance.
Forward outlook
- Local home prices are declining (-3.0%/yr); year-one equity from $1k of loan paydown is wiped out by about $5k of value loss. Plan a longer hold.
- Hidalgo County population projected at +28% by 2050 — long-run rental-demand tailwind backs the buy-and-hold thesis.
Negotiation context
- It's been on market 25 days — a 2% lower offer ($167k) is reasonable based on typical stale-listing flexibility.
- 3 sale attempts since 12y ago with the ask held roughly flat each time — persistent listings suggest the price (not the market) is what's stuck; bring a comps-based counter.
Risks & watch-outs
- Climate carrying-cost: severe wind risk, 99% chance of damaging wind over 30y; extreme-heat days projected 7→22/yr by 2055 (HVAC capex compounding) — expect insurance premiums to compound above CPI over the hold.
Questions for the listing agent
- What do current leases actually rent for vs. the listed asking? Can we see a recent rent roll and the last 12 months of T-12 income?
- Is there a deadline driving the sale (1031 exchange, divorce, estate, relocation)? That informs how much negotiation room exists.
- Schools are B-rated — typically a magnet for longer-tenancy family renters. What's the average tenant stay here, and is there a school-zone premium baked into asking?
- The area grade is low — what's the realistic commute time and amenity access for the typical tenant pool here? Any planned neighborhood developments (good or bad) we should know about?
- What's the average days-on-market for RENTAL listings here right now (not sales)? A rising rental-DOM trend means longer vacancies and softer asking-rent achievability than the comps imply.
- What's the recent tenant-quality profile in this submarket — average credit score on applications, eviction rate, late-payment / NSF rate, and stable-employment percentage? A property-management company in the area should have these aggregated.
- How much new for-sale + rental construction is in the pipeline within 1–3 miles? Heavy new supply typically softens prices + rents 12–24 months out; constrained supply supports both.
Investment metrics
- 1% rule
- 0.72% ✗
- Cap rate
- 4.08%
- Cash-on-cash
- -7.89%
- DSCR
- 0.65
- GRM
- 11.6
CMA / ARV
- ARV (median comp)
- $173,406
- List price
- $169,900
- Delta
- -2.02%
- Verdict
- FAIR
- Comps
- 20 within 1.0 mi
Show comp detail 12 sales within ~0.75 mi
| Address | Dist | Beds/Ba | Sqft | Sold | Price | $/sf | Match |
|---|---|---|---|---|---|---|---|
| 2908 N 26th St | 0.13mi | 3/2.0 | 1,063 (-6%) | 8mo | $175,000 | $165 | 77 |
| 2020 Camellia Ave | 0.50mi | 3/2.0 | 1,140 (+0%) | 10mo | $150,000 | $132 | 68 |
| 2921 N 24th St N | 0.24mi | 3/2.0 | 1,116 (-2%) | 22mo | $189,000 | $169 | 67 |
| 2409 N 25th 1/2 St | 0.18mi | 3/2.0 | 1,264 (+11%) | 12mo | $189,900 | $150 | 63 |
| 2436 Quince Ave | 0.63mi | 3/1.5 | 1,134 (-0%) | 7mo | $165,000 | $146 | 63 |
| 2317 N 31st St | 0.42mi | 3/2.0 | 1,106 (-3%) | 18mo | $195,000 | $176 | 61 |
| 2105 Harvey St | 0.46mi | 3/2.0 | 1,170 (+3%) | 22mo | $175,000 | $150 | 56 |
| 2904 Walnut Ave | 0.37mi | 3/2.0 | 1,195 (+5%) | 24mo | $195,000 | $163 | 54 |
| 3616 Westway Ave | 0.68mi | 3/2.0 | 1,188 (+4%) | 16mo | $159,000 | $134 | 47 |
| 2825 Sycamore Ave | 0.53mi | 3/1.5 | 1,204 (+6%) | 20mo | $140,000 | $116 | 47 |
| 2108 Camellia Ave | 0.46mi | 3/2.0 | 1,284 (+13%) | 15mo | $209,000 | $163 | 44 |
| 1901 Harvey Dr | 0.65mi | 3/2.0 | 1,292 (+14%) | 10mo | $255,500 | $198 | 39 |
Match score weights: distance 35% · size 25% · config 20% · recency 20%. Top-matched comps best support the ARV.
Projected returns pro-forma
-3.0% appreciation · 1.78% rent growth · sell at horizon
- IRR
- -31.6%
- Equity multiple
- -0.03×
- Total profit
- $-48,847
- Equity at exit
- $25,333
- IRR
- -43.2%
- Equity multiple
- -0.55×
- Total profit
- $-73,767
- Equity at exit
- $14,690
Cash invested: $47,572 (down + closing). Projections, not guarantees.
Landlord ↔ Tenant lean methodology
- Overall (STATE)
- 87 Strongly Landlord-Friendly
- State Texas
- 87 Strongly Landlord-Friendly · R+5
- County
- — inherits STATE
- City
- — inherits STATE
ZIP-level market 78501
- Home prices YoY
- -23.3%
- Rents YoY
- 1.8%
- Active inventory
- 385
- Price-to-rent
- 11.6×
Monthly cashflow live
- Estimated rent
- $1,215 high interval (Pro) →
- Mortgage (P&I)
- −$891
- Tax from tax record
- −$311 /mo · $3,734/yr
- Insurance
- −$71
- HOA
- −$0
- Vacancy / Maint / Mgmt
- −$255
- Net cashflow
- $-313
Break-even live
UW: 25.0% down · 7.5% · 30yr · 1.5% tax · 5.0% vac · 8.0% maint · 8.0% mgmt
Financing live
Cash to close
- Down payment
- $42,475
- Closing costs
- $5,097
- Reserves months
- —
- Total cash needed
- —
Loan-product check · same deal, 3 products live
Conventional
25% down · 7.5% · 30yr
- Down + closing
- —
- Monthly P&I
- —
- Monthly cashflow
- —
- DSCR
- —
- Eligible?
- —
Personal DTI + credit; lowest rate.
DSCR
20% down · 8.5% · 30yr
- Down + closing
- —
- Monthly P&I
- —
- Monthly cashflow
- —
- DSCR
- —
- Eligible?
- —
No personal income docs; deal must DSCR.
Hard money
10% down · 12.0% · 12mo
- Down + closing
- —
- Monthly P&I
- —
- Monthly cashflow
- —
- DSCR
- —
- Eligible?
- —
Short-term bridge; refi at stabilization.
Rent comps 40 comps
| Address | Beds | Baths | Sqft | Rent | $/sqft | DOM | Units | Dist |
|---|---|---|---|---|---|---|---|---|
| 2716 N 27th Ln McAllen, TX | 3.0 | 2.5 | 1458 | $1,750 | $1.20 | 14d | 1 | 0.11mi |
| 3101 N 25 1/2 St McAllen, TX | 3.0 | 2.0 | 1462 | $1,600 | $1.09 | 23d | 1 | 0.23mi |
| 2901 Whitewing Ave Unit 3 McAllen, TX | 2.0 | 2.0 | 1000 | $825 | $0.82 | 44d | 1 | 0.24mi |
| 3210 N 25 1/2 St McAllen, TX | 2.0 | 1.5 | 868 | $995 | $1.15 | 14d | 1 | 0.34mi |
| 2716 N 31st St #3 McAllen, TX | 3.0 | 1.5 | 940 | $900 | $0.96 | 23d | 1 | 0.34mi |
| 2716 N 31st St #4 McAllen, TX | 3.0 | 1.5 | 940 | $900 | $0.96 | 44d | 1 | 0.34mi |
| 2816 Gardenia Cir McAllen, TX | 3.0 | 2.0 | 1365 | $3,600 | $2.64 | 44d | 1 | 0.36mi |
| 2501 Hibiscus Ave McAllen, TX | 2.0 | 1.0 | 845 | $912 | $1.08 | 44d | 1 | 0.37mi |
| 2421 Vine Ave Unit C McAllen, TX | 2.0 | 1.0 | 1050 | $800 | $0.76 | 14d | 1 | 0.38mi |
| 3105 Highland Ave Unit 6 McAllen, TX | 3.0 | 1.0 | 987 | $750 | $0.76 | 19d | 1 | 0.38mi |
| 3105 Highland Ave Apt 5 McAllen, TX | 3.0 | 1.0 | 987 | $750 | $0.76 | 44d | 1 | 0.38mi |
| 2513 N 32nd St Unit 4 McAllen, TX | 2.0 | 1.0 | 789 | $650 | $0.82 | 14d | 1 | 0.43mi |
| 2425 Tamarack Ave Unit B McAllen, TX | 2.0 | 1.0 | 825 | $700 | $0.85 | 44d | 1 | 0.48mi |
| 2432 W Iris Ave McAllen, TX | 4.0 | 2.0 | 1397 | $1,700 | $1.22 | 44d | 1 | 0.50mi |
| 2433 Kerria Ave McAllen, TX | 3.0 | 2.0 | 1286 | $1,500 | $1.17 | 44d | 1 | 0.58mi |
| 3501 Westway Ave McAllen, TX | 3.0 | 2.0 | 1364 | $1,500 | $1.10 | 23d | 1 | 0.59mi |
| 2616 Quince Ave McAllen, TX | 3.0 | 2.0 | 1134 | $1,450 | $1.28 | 23d | 1 | 0.61mi |
| 1900 La Vista Ave McAllen, TX | 4.0 | 2.0 | 1410 | $2,400 | $1.70 | 44d | 1 | 0.68mi |
| 3616 Harvey St Unit 5 McAllen, TX | 2.0 | 1.0 | 783 | $695 | $0.89 | 44d | 1 | 0.69mi |
| 3616 Harvey Dr W Unit 2 McAllen, TX | 2.0 | 1.0 | 783 | $695 | $0.89 | 23d | 1 | 0.69mi |
| 4216 Walnut Ave Unit 4 McAllen, TX | 2.0 | 2.0 | 831 | $1,275 | $1.53 | 44d | 1 | 0.73mi |
| 4220 Walnut Ave Unit 2 McAllen, TX | 3.0 | 2.0 | 1020 | $1,375 | $1.35 | 44d | 1 | 0.73mi |
| 4208 La Vista Ave Unit 3 McAllen, TX | 2.0 | 2.0 | 826 | $1,075 | $1.30 | 23d | 1 | 0.73mi |
| 4105 La Vista Ave Unit 1 McAllen, TX | 2.0 | 2.0 | 841 | $1,100 | $1.31 | 44d | 1 | 0.73mi |
| 2109 Kerria Ave Unit 4 McAllen, TX | 2.0 | 2.0 | 950 | $900 | $0.95 | 23d | 1 | 0.75mi |
| 3800 Westway Ave McAllen, TX | 3.0 | 2.0 | 1443 | $1,775 | $1.23 | 44d | 1 | 0.78mi |
| 3800 Westway Ave McAllen, TX | 3.0 | 2.0 | 1443 | $1,950 | $1.35 | 14d | 1 | 0.78mi |
| 1901 Japonica Ave Unit 35 McAllen, TX | 2.0 | 2.0 | 965 | $795 | $0.82 | 23d | 1 | 0.79mi |
| 1901 Japonica Ave Unit 29 McAllen, TX | 2.0 | 2.0 | 965 | $745 | $0.77 | 23d | 1 | 0.82mi |
| 1901 Japonica Ave Unit 2 McAllen, TX | 2.0 | 2.0 | 965 | $850 | $0.88 | 44d | 1 | 0.82mi |
| 3812 Camellia Ave McAllen, TX | 3.0 | 1.0 | 1000 | $1,350 | $1.35 | 44d | 1 | 0.83mi |
| 1600 Tamarack Ave Apt 64 McAllen, TX | 2.0 | 1.0 | 820 | $800 | $0.98 | 44d | 1 | 0.94mi |
| 1600 Tamarack Ave Unit 88 McAllen, TX | 2.0 | 2.0 | 1000 | $850 | $0.85 | 44d | 1 | 0.94mi |
| 1600 Tamarack Ave Apt 64 McAllen, TX | 2.0 | 1.0 | 1000 | $790 | $0.79 | 23d | 1 | 0.94mi |
| 4104 Walnut Ave Unit 4 McAllen, TX | 2.0 | 2.0 | 950 | $1,125 | $1.18 | 14d | 1 | 1.00mi |
| 1601 Redwood Ave McAllen, TX | 2.0 | 1.0 | 1292 | $1,100 | $0.85 | 44d | 1 | 1.04mi |
| 4405 N 27th St McAllen, TX | 3.0 | 2.0 | 1382 | $1,695 | $1.23 | 44d | 1 | 1.04mi |
| 3908 Walnut Ave Unit 3 McAllen, TX | 2.0 | 2.0 | 850 | $1,195 | $1.41 | 44d | 1 | 1.05mi |
| 1715 W Nolana Ave Unit 3 McAllen, TX | 2.0 | 2.0 | 960 | $950 | $0.99 | 23d | 1 | 1.05mi |
| 4116 Walnut Ave Unit 1 McAllen, TX | 2.0 | 2.0 | 950 | $1,025 | $1.08 | 14d | 1 | 1.06mi |
Listing history 14 events
-
2026-06-01status $169,900 Pending 25 DOM
-
2026-05-31days on market $169,900 Option 25 DOM
-
2026-05-31days on market $169,900 Option 24 DOM
-
2026-05-06$169,900 Active 298-char remark
-
2025-08-15historical $1,500
-
2025-08-06price $1,500
-
2025-05-15$1,600
-
2022-07-01soldstatus
-
2018-06-05price $50,000 365-char remark
Show marketing remark (365 chars)
*FORECLOSURE* THIS ONE STORY BRICK HOME HAS LOT'S POTENTIAL. WITH A LITTLE TLC IT COULD BE A GREAT HOME! GARAGE HAS BEEN CONVERTED INTO A BEDROOM. SPACIOUS LIVING ROOM WITH SLIDING GLASS DOORS TO THE EXTERIOR. SOLD AS IS. DUE DILIGENCE TO BE DONE PRIOR TO BIDDING. BUYER OR BUYER S AGENT TO VERIFY ALL INFORMATION: SCHOOLS, TAXES, RESTRICTIONS AND ROOM SIZES, ETC.
-
2014-07-15soldstatus 365-char remark
Show marketing remark (365 chars)
*FORECLOSURE* THIS ONE STORY BRICK HOME HAS LOT'S POTENTIAL. WITH A LITTLE TLC IT COULD BE A GREAT HOME! GARAGE HAS BEEN CONVERTED INTO A BEDROOM. SPACIOUS LIVING ROOM WITH SLIDING GLASS DOORS TO THE EXTERIOR. SOLD AS IS. DUE DILIGENCE TO BE DONE PRIOR TO BIDDING. BUYER OR BUYER S AGENT TO VERIFY ALL INFORMATION: SCHOOLS, TAXES, RESTRICTIONS AND ROOM SIZES, ETC.
-
2014-06-11price $50,459 365-char remark
Show marketing remark (365 chars)
*FORECLOSURE* THIS ONE STORY BRICK HOME HAS LOT'S POTENTIAL. WITH A LITTLE TLC IT COULD BE A GREAT HOME! GARAGE HAS BEEN CONVERTED INTO A BEDROOM. SPACIOUS LIVING ROOM WITH SLIDING GLASS DOORS TO THE EXTERIOR. SOLD AS IS. DUE DILIGENCE TO BE DONE PRIOR TO BIDDING. BUYER OR BUYER S AGENT TO VERIFY ALL INFORMATION: SCHOOLS, TAXES, RESTRICTIONS AND ROOM SIZES, ETC.
-
2014-06-11historical 365-char remark
Show marketing remark (365 chars)
*FORECLOSURE* THIS ONE STORY BRICK HOME HAS LOT'S POTENTIAL. WITH A LITTLE TLC IT COULD BE A GREAT HOME! GARAGE HAS BEEN CONVERTED INTO A BEDROOM. SPACIOUS LIVING ROOM WITH SLIDING GLASS DOORS TO THE EXTERIOR. SOLD AS IS. DUE DILIGENCE TO BE DONE PRIOR TO BIDDING. BUYER OR BUYER S AGENT TO VERIFY ALL INFORMATION: SCHOOLS, TAXES, RESTRICTIONS AND ROOM SIZES, ETC.
-
2014-02-03$50,000 365-char remark
Show marketing remark (365 chars)
*FORECLOSURE* THIS ONE STORY BRICK HOME HAS LOT'S POTENTIAL. WITH A LITTLE TLC IT COULD BE A GREAT HOME! GARAGE HAS BEEN CONVERTED INTO A BEDROOM. SPACIOUS LIVING ROOM WITH SLIDING GLASS DOORS TO THE EXTERIOR. SOLD AS IS. DUE DILIGENCE TO BE DONE PRIOR TO BIDDING. BUYER OR BUYER S AGENT TO VERIFY ALL INFORMATION: SCHOOLS, TAXES, RESTRICTIONS AND ROOM SIZES, ETC.
-
2000-08-23soldstatus
ⓘ Source: listings_history table (triggers on properties + properties_extension) + one-shot
backfill from property_details.listing_events for pre-trigger history.
Tax reassessment forecast TX · Resets to sale price
- Current annual tax
- $3,734 · $311/mo
- Projected year-2 tax
- $3,734 · $311/mo
- Expected delta
- $0/yr ($0/mo · -0.0%)
ⓘ Screening estimate from a state-policy table — verify with the county assessor before closing.
Climate risk First Street
- Flood 1/10 Low FEMA zone X (shaded) · 0% chance over 30 yrs
- Wildfire 1/10 Low
- Heat 9/10 Extreme 7 d/yr ≥111°F today · 22 d/yr by 30 yrs out
- Wind 8/10 Severe 99% chance of damaging wind over 30 yrs
- Air quality 3/10 Moderate 1 unhealthy d/yr today · 4 by 30 yrs out
Nearby sold comps map
Loading sold comps map…
Walkable amenities ~0.75 mi
Loading nearby amenities…
Taxation est. · year 1
- Rental income
- $14,585
- − Mortgage interest
- −$9,517
- − Property taxes
- −$3,734
- − Insurance
- −$850
- − Repairs & maintenance
- −$1,167
- − Management
- −$1,167
- − Depreciation
- −$4,943
- Taxable loss
- −$6,792
- Est. tax savings @ 24.0%
- +$1,630
- After-tax cash flow
- $-2,123/yr
For passive investors: Depreciation is non-cash, so a rental often shows a tax loss while cash-flowing — sheltering income. Rental losses are passive: they offset passive income freely, and up to $25,000/yr can offset ordinary (W-2) income if you actively participate and your MAGI is under $100k (phasing out to $0 by $150k); unused losses carry forward. On sale, claimed depreciation is recaptured at up to 25%, and gains may owe capital-gains tax (a 1031 exchange can defer both). Figures are a year-1 estimate at your 24.0% rate — not tax advice; consult a CPA.
Schools (NCES district)
- District
- Mcallen ISD
- NCES district ID
- 4829670
- Math proficiency
- 34% ▼ -22.00%
- Reading proficiency
- 45% ▼ -5.00%
- Median HH income
- $40,805
- Composite
- 33.16/100
- National rank
- #5551
- State rank
- #440 of 826 in TX
Livability — McAllen
- Score
- 76/100
- State rank
- #119
- US rank
- #3771
Category grades
Schools grade is shown separately in the Schools card above.
Census & demographics
- Census place
- McAllen, TX
- County
- Hidalgo County · 623,128 people
- City population
- 144,650
- Metro
- McAllen-Edinburg-Mission, TX
- Population (ZIP)
- 58,935
- Household income
- $48,071
- Rent vs Own
- Severe rent burden
- 3043.0
Population outlook (Hidalgo County) Hauer SSP2
- Today (2025)
- 955,232 people
- By 2030
- 1,009,774 · +5.7%
- By 2040
- 1,120,332 · +17.3%
- By 2050
- 1,225,036 · +28.2%
- By 2075
- 1,439,189 · +50.7%
- By 2100
- 1,533,429 · +60.5%
Race, ethnicity, and origin ACS 2023
- Neighborhood character
- Predominantly Hispanic (89%)
- Race & ethnicity
- Hispanic / Latino 89% Two or more races 32% White 8% Asian 2%
- Hispanic origin (detail)
- Mexican 85%
- Foreign-born
- 28% · Canada, Vietnam
- Languages at home
- 22% English-only · Spanish 76%
Political lean MEDSL · Hidalgo
- 2024 margin
- Toss-up / Even · D 48.1% · R 51.0%
- 2008→2024 swing
- -41.6pp toward R · 2008: 38.7pp · 2024: -2.9pp
- All cycles
- 2024: R+2.9 2020: D+17.1 2016: D+40.5 2012: D+41.8 2008: D+38.7
Not yet ingested
- Civics
- —
Market trends
- HPI YoY
- ▼ -69.99%
- Current HPI
- 230.0213
- Rent YoY
- ▲ 1.78%
- Metro
- McAllen-Edinburg-Mission, TX
- State GDP YoY
- ▲ 3.95%
- F500 in state
- 110
Industry mix (Fortune 500 HQ in TX)
| Industry | F500 HQs | Revenue |
|---|---|---|
| Energy | 16 | $1,198B |
|
||
| Technology | 5 | $198B |
|
||
| Engineering / Construction | 4 | $72B |
|
||
| Energy Services | 3 | $60B |
|
||
| Utilities | 3 | $41B |
|
||
| Healthcare | 2 | $330B |
|
||
Price history
+239.8% since first listed13 events — show timeline
- 2026-06-01 Pending — MCALLENMLS
- 2026-05-21 Contingent — MCALLENMLS
- 2026-05-06 Listed $169,900 MCALLENMLS
- 2025-08-15 Rental Removed $1,500 MCALLENMLS
- 2025-08-06 Price Changed $1,500 MCALLENMLS
- 2025-05-15 Listed for Rent $1,600 MCALLENMLS
- 2022-07-01 Sold (Public Records) — Public Records
- 2018-06-05 Price Changed $50,000 MCALLENMLS
- 2014-07-15 Sold (MLS) — MCALLENMLS
- 2014-06-11 Delisted — MCALLENMLS
- 2014-06-11 Price Changed $50,459 MCALLENMLS
- 2014-02-03 Listed $50,000 MCALLENMLS
- 2000-08-23 Sold (Public Records) — Public Records
Property tax history
+7.8%/yrLatest (2025): $3,734 · -4.8% YoY. Source: county tax records.
Cash-flow waterfall
monthlySold comps — $/sqft
last 12 mo · ≤1 miLoading sold comps…