1765 Courtyard Way #103 · Naples, FL
Flood risk 8/10 · Major
- FEMA flood zone
- X (shaded)
- Chance of flooding over 30 yrs
- 0.93%
- Est. flood insurance / yr
- $507 – $1,088
Fire risk 1/10 · Minimal
- Est. fire insurance / yr
- $947 – $1,759
Heat risk 10/10 · Severe
- Hot days now (above 107°F)
- 7 days/yr
- Hot days in 30 yrs
- 28 days/yr
Wind risk 10/10 · Severe
- Chance of severe wind over 30 yrs
- 99.0%
Air-quality risk 2/10 · Minimal
- Unhealthy air days now
- 2 days/yr
- Unhealthy air days in 30 yrs
- 2 days/yr
Risk factors via First Street. Map © Google.
Why this score? — see what drove the D grade
The composite is a weighted blend of 9 inputs, each scored 0–100. Each bar is that input's sub-score; the figure is the points it added to the 100-point composite (weight × sub-score).
- Cash flow +8.8/30.0
- ARV discount +7.5/15.0
- 1% rule +5.1/10.0
- Appreciation +5.0/10.0
- Schools +5.0/10.0
- Livability +4.0/5.0
- Rent growth +2.5/5.0
- Condition / age +2.5/5.0
- DSCR +2.4/10.0
$280,000
🖨 Deal sheet (PDF) 📄 Offer letter ✓ Due diligence
Listing remarks
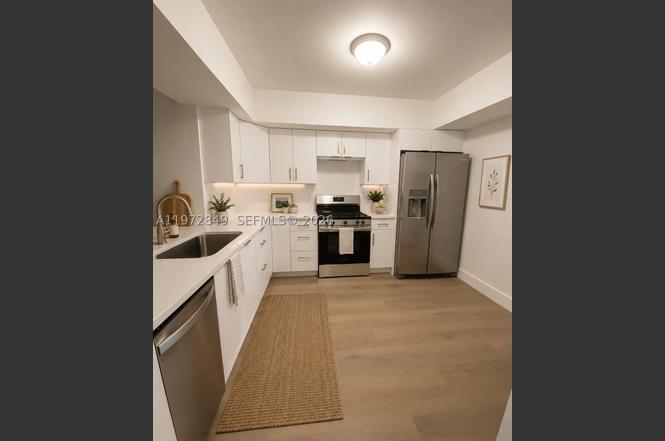
Spectacular renovated 2/2 condo ready to move-in, both bedrooms are spacious, including a comfortable walk-in closet, The A/C unit and water heater are almost new, offering efficiency and peace of mind, 12 minutes from the beach. Just bring your suitcases and start enjoying this beautiful, maintained home with excellent taste and style throughout. Best location, close to everything- shopping, dining, and close to the beach. one or more photos has been virtually staged.
Key facts
- $651 HOA
- Garage
- Community pool
Property features AI
Finance
- Financial info: Pets allowed with restrictions or possible restrictions (conditional)
- HOA & community: Monthly association fee; Association fee includes amenities; Community amenities include pool, spa/hot tub, tennis courts, pickleball and trails
Exterior
- Parking: 1 covered parking space; Garage with 1 space
- Security: Smoke detector(s)
- Utilities: Has cooling; Has heating
- Home design: Single-story; Entry on level 1; Effective year built
- Construction: Block construction
- Exterior features: Balcony; Porch; Open balcony/porch; Screened porch; Association pool
Interior
- Kitchen: Dishwasher; Electric range; Refrigerator
- Bedrooms: Primary bedroom located on the main level
- Flooring: Laminate flooring
- Bathrooms: 2 full bathrooms
- Heating & cooling: Central heating; Central air conditioning
- Interior features: First-floor entry; Main-level primary bedroom; Updated/remodeled condition; Other interior features
- Laundry & utility: Washer; Electric water heater
Neighborhood map
What this means for you Summary
Snapshot
- This is a 2-bed/2.0-bath condo listed at $280k.
Deal economics
- At list price, monthly cash flow is $-295 ($-4k/yr) — negative.
- To cash-flow at today's rent, offer at most $228k (18.6% below list).
- Meets the 1% rule at list price ($3k rent vs $280k).
- Recommended offer: $228k (18.6% below list) — sets the bar for cash-flow.
Location & tenants
- Location reads 80/100 on livability (#126 in FL, #1,903 nationally) — a professional / high-income tenant draw. Strengths: crime A+, amenities A+, employment A+; Watch: commute D+, cost of living F.
- Collier (suburban): math 60% / reading 56% proficiency, ranked #16 of 73 in FL (top 22%) — acceptable for families but not a draw, mixed tenant base, ~2y average lease.
- Zoned schools: Shadowlawn Elementary School (math 44% / reading 40%, grade F, #1,403 of 2,144 statewide, top 67%, 457 students, 72% FRL); East Naples Middle School (math 56% / reading 44%, grade C, #254 of 571 statewide, top 45%, 854 students, 63% FRL); Lely High School (math 40% / reading 39%, grade F, #304 of 667 statewide, top 47%, 1,504 students, 54% FRL).
- Zoned-school proficiency averages 44% at this address vs 58% district-wide (-14 pts) — the specific schools serving this property underperform the Collier average; the district grade overstates school quality for this exact location.
- Market conditions: 2 active listings in the ZIP; 40 comparable units currently listed for rent nearby; rentals at typical pace (median 24d on market — plan ~3-4 weeks tenant-placement turnaround); 3,520 units permitted in Collier County in 2024 (959 in 5+ unit buildings).
Forward outlook
- In year one you build about $10k of equity ($2k loan paydown + $8k appreciation (3.0% local appreciation)).
- Collier County population projected at +30% by 2050 — long-run rental-demand tailwind backs the buy-and-hold thesis.
- By year 4, paydown + projected appreciation supports a ~$35k cash-out refi (75% LTV) — recoverable capital for the next deal without selling this one.
Negotiation context
- It's been on market 115 days — a 9% lower offer ($255k) is reasonable based on typical stale-listing flexibility.
Risks & watch-outs
- Watch-outs: flood insurance adds $66/mo; HOA is 23% of rent.
- Climate carrying-cost: severe flood risk; severe wind risk, 99% chance of damaging wind over 30y; extreme-heat days projected 7→28/yr by 2055 (HVAC capex compounding) — expect insurance premiums to compound above CPI over the hold.
Questions for the listing agent
- What do current leases actually rent for vs. the listed asking? Can we see a recent rent roll and the last 12 months of T-12 income?
- It's been on market 115 days. Have you received any prior offers? Is the seller open to a 19% concession, seller financing, or rate buy-down credit?
- What's the actual annual flood-insurance premium (NFIP or private), and is the property in a SFHA with mandatory coverage?
- What does the HOA fee cover, when was the last increase, and are there any pending special assessments or reserve-fund shortfalls?
- Any open or pending special assessments — roof, HVAC, plumbing, elevator, façade? What's the per-unit balance and payoff schedule, and is the seller paying it off at close or rolling it to the buyer?
- Why hasn't it sold? Are there any deal-killer items the seller is aware of (foundation, flood, title, zoning, code violations)?
- Is there a deadline driving the sale (1031 exchange, divorce, estate, relocation)? That informs how much negotiation room exists.
- Schools are B-rated — typically a magnet for longer-tenancy family renters. What's the average tenant stay here, and is there a school-zone premium baked into asking?
- The area grade is low — what's the realistic commute time and amenity access for the typical tenant pool here? Any planned neighborhood developments (good or bad) we should know about?
- What's the average days-on-market for RENTAL listings here right now (not sales)? A rising rental-DOM trend means longer vacancies and softer asking-rent achievability than the comps imply.
- What's the recent tenant-quality profile in this submarket — average credit score on applications, eviction rate, late-payment / NSF rate, and stable-employment percentage? A property-management company in the area should have these aggregated.
- How much new apartment / multifamily construction is in the pipeline within 1–3 miles? Heavy new supply (>2% of stock underway) typically softens rents 12–24 months out; light construction supports rent growth.
Investment metrics
- 1% rule
- 1.01% ✓
- Cap rate
- 5.31%
- Cash-on-cash
- -3.50%
- DSCR
- 0.84
- GRM
- 8.3
CMA / ARV
No comps found within radius.
Projected returns pro-forma
3.0% appreciation · 3.0% rent growth · sell at horizon
- IRR
- 3.4%
- Equity multiple
- 1.20×
- Total profit
- $15,350
- Equity at exit
- $125,900
- IRR
- 6.8%
- Equity multiple
- 2.04×
- Total profit
- $81,567
- Equity at exit
- $194,027
Cash invested: $78,400 (down + closing). Projections, not guarantees.
Landlord ↔ Tenant lean methodology
- Overall (STATE)
- 87 Strongly Landlord-Friendly
- State Florida
- 87 Strongly Landlord-Friendly · R+3
- County
- — inherits STATE
- City
- — inherits STATE
ZIP-level market 33114
- Active inventory
- 2
- Price-to-rent
- 8.3×
Monthly cashflow live
- Estimated rent
- $2,820 high interval (Pro) →
- Mortgage (P&I)
- −$1,468
- Tax from tax record
- −$220 /mo · $2,642/yr
- Insurance
- −$117
- Flood insurance flood zone
- −$66 /mo · $798/yr
- HOA
- −$651
- Vacancy / Maint / Mgmt
- −$592
- Net cashflow
- $-295
Break-even live
Sensitivity live
| Price | -10% $-136 | -5% $-216 | +0% $-295 | +5% $-374 | +10% $-453 |
|---|---|---|---|---|---|
| Rent | -10% $-518 | -5% $-406 | +0% $-295 | +5% $-184 | +10% $-72 |
| Rate | -1.0pp $-154 | -0.5pp $-224 | base $-295 | +0.5pp $-367 | +1.0pp $-441 |
UW: 25.0% down · 7.5% · 30yr · 1.5% tax · 5.0% vac · 8.0% maint · 8.0% mgmt
Financing live
Cash to close
- Down payment
- $70,000
- Closing costs
- $8,400
- Reserves months
- —
- Total cash needed
- —
Loan-product check · same deal, 3 products live
Conventional
25% down · 7.5% · 30yr
- Down + closing
- —
- Monthly P&I
- —
- Monthly cashflow
- —
- DSCR
- —
- Eligible?
- —
Personal DTI + credit; lowest rate.
DSCR
20% down · 8.5% · 30yr
- Down + closing
- —
- Monthly P&I
- —
- Monthly cashflow
- —
- DSCR
- —
- Eligible?
- —
No personal income docs; deal must DSCR.
Hard money
10% down · 12.0% · 12mo
- Down + closing
- —
- Monthly P&I
- —
- Monthly cashflow
- —
- DSCR
- —
- Eligible?
- —
Short-term bridge; refi at stabilization.
Rent comps 40 comps
| Address | Beds | Baths | Sqft | Rent | $/sqft | DOM | Units | Dist |
|---|---|---|---|---|---|---|---|---|
| 1701 Courtyard Way Naples, FL | 2.0 | 2.0 | 1072 | $1,990 | $1.86 | 25d | 1 | 0.03mi |
| 1765 Courtyard Way Unit C-104 Naples, FL | 2.0 | 2.0 | 1132 | $2,700 | $2.39 | 16d | 1 | 0.04mi |
| 1765 Courtyard Way Unit C206 Naples, FL | 2.0 | 2.5 | 1150 | $1,650 | $1.43 | 16d | 1 | 0.04mi |
| 1933 Courtyard Way Unit D-103 Naples, FL | 2.0 | 2.0 | 947 | $1,850 | $1.95 | 16d | 1 | 0.04mi |
| 1895 Courtyard Way #103 Naples, FL | 3.0 | 2.0 | 1046 | $2,200 | $2.10 | 23d | 1 | 0.07mi |
| 1826 Kings Lake Blvd #101 Naples, FL | 3.0 | 2.0 | 1456 | $2,700 | $1.85 | 16d | 1 | 0.13mi |
| 1802 Kings Lake Blvd Unit 2-101 Naples, FL | 2.0 | 2.0 | 1465 | $5,500 | $3.75 | 25d | 1 | 0.14mi |
| 1808 Kings Lake Blvd #203 Naples, FL | 2.0 | 2.0 | 1312 | $1,775 | $1.35 | 16d | 1 | 0.16mi |
| 1814 Kings Lake Blvd #204 Naples, FL | 2.0 | 2.0 | 1400 | $2,450 | $1.75 | 25d | 1 | 0.23mi |
| 141 Bristol Ln Unit C21 Naples, FL | 2.0 | 2.0 | 1400 | $5,900 | $4.21 | 25d | 1 | 0.25mi |
| 153 Bristol Ln Unit F102 Naples, FL | 2.0 | 2.0 | 1009 | $4,900 | $4.86 | 25d | 1 | 0.27mi |
| 153 Bristol Ln Unit A Naples, FL | 2.0 | 2.0 | 1009 | $2,250 | $2.23 | 16d | 1 | 0.27mi |
| 2132 Tama Cir #102 Naples, FL | 2.0 | 2.0 | 1368 | $4,000 | $2.92 | 25d | 1 | 0.29mi |
| 2972 Kings Lake Blvd #2972 Naples, FL | 2.0 | 2.0 | 1100 | $3,000 | $2.73 | 25d | 1 | 0.29mi |
| 4210 Looking Glass Ln Unit 4210 Naples, FL | 2.0 | 2.0 | 1300 | $3,000 | $2.31 | 16d | 1 | 0.30mi |
| 4180 Looking Glass Ln Unit 4104 Naples, FL | 2.0 | 2.0 | 1246 | $4,000 | $3.21 | 16d | 1 | 0.32mi |
| 2103 Tama Cir Unit 2 Naples, FL | 2.0 | 2.0 | 1368 | $4,000 | $2.92 | 23d | 1 | 0.34mi |
| 2644 Kings Lake Blvd Unit 6-103 Naples, FL | 2.0 | 2.0 | 911 | $1,875 | $2.06 | 25d | 1 | 0.36mi |
| 2648 Kings Lake Blvd Unit 6-201 Naples, FL | 3.0 | 2.0 | 1060 | $2,200 | $2.08 | 23d | 1 | 0.36mi |
| 2712 Kings Lake Blvd #201 Naples, FL | 1.0 | 1.0 | 1076 | $2,850 | $2.65 | 25d | 1 | 0.39mi |
| 4472 Beechwood Lake Dr Naples, FL | 3.0 | 2.0 | 1352 | $3,050 | $2.26 | 25d | 1 | 0.44mi |
| 1950 W Crown Pointe Blvd Unit B207 Naples, FL | 2.0 | 2.0 | 1129 | $1,950 | $1.73 | 25d | 1 | 0.45mi |
| 2050 W Crown Pointe Blvd Unit C214 Naples, FL | 3.0 | 2.0 | 1267 | $4,200 | $3.31 | 25d | 1 | 0.45mi |
| 4060 Ice Castle Way #10 Naples, FL | 2.0 | 2.0 | 1246 | $3,600 | $2.89 | 16d | 1 | 0.48mi |
| 4040 Ice Castle Way Unit 2 Naples, FL | 2.0 | 2.0 | 1246 | $2,800 | $2.25 | 25d | 1 | 0.49mi |
| 1075 Foxfire Ln Naples, FL | 2.0 | 2.0 | 1092 | $3,300 | $3.02 | 25d | 3 | 0.49mi |
| 4021 Ice Castle Way #4 Naples, FL | 2.0 | 2.0 | 1246 | $2,600 | $2.09 | 16d | 1 | 0.54mi |
| 1787 Reuven Cir Unit 1001 Naples, FL | 2.0 | 2.0 | 1112 | $1,300 | $1.17 | 16d | 1 | 0.54mi |
| 4010 Ice Castle Way #7 Naples, FL | 2.0 | 2.0 | 1314 | $3,200 | $2.44 | 25d | 1 | 0.57mi |
| 4502 Parrot Ave Naples, FL | 3.0 | 2.0 | 1200 | $2,950 | $2.46 | 25d | 1 | 0.62mi |
| 581 Teryl Rd #5 Naples, FL | 2.0 | 2.0 | 1403 | $4,500 | $3.21 | 16d | 1 | 0.64mi |
| 882 Bluebird St Naples, FL | 3.0 | 2.0 | 1308 | $6,000 | $4.59 | 25d | 1 | 0.67mi |
| 4069 Northlight Dr #1805 Naples, FL | 2.0 | 2.0 | 1234 | $3,000 | $2.43 | 23d | 1 | 0.68mi |
| 1748 Royal Cir Naples, FL | 3.0 | 2.0 | 1451 | $3,200 | $2.21 | 25d | 1 | 0.69mi |
| 5257 Whitten Dr Naples, FL | 2.0 | 2.0 | 1500 | $2,500 | $1.67 | 16d | 1 | 0.73mi |
| 432 Teryl Rd Unit 1546319P Naples, FL | 2.0 | 2.0 | 1496 | $1,561 | $1.04 | 16d | 1 | 0.74mi |
| 5301 Whitten Dr #81 Naples, FL | 3.0 | 2.0 | 1386 | $2,700 | $1.95 | 25d | 1 | 0.75mi |
| 202 Peppermint Ln #2 Naples, FL | 2.0 | 2.0 | 1335 | $5,000 | $3.75 | 16d | 1 | 0.76mi |
| 195 Peppermint Ln Unit 881 Naples, FL | 2.0 | 2.0 | 1335 | $5,000 | $3.75 | 16d | 1 | 0.76mi |
| 195 Peppermint Ln #2 Naples, FL | 2.0 | 2.0 | 1198 | $2,600 | $2.17 | 16d | 1 | 0.76mi |
HOA detail condo
- Monthly dues
- $651 · $7,812/yr
- Likely covers
- water
- Assessments
- None detected in remarks — confirm with the listing agent.
Listing history 17 events
-
2026-06-21days on market $280,000 Active 115 DOM
-
2026-06-18days on market $280,000 Active 112 DOM
-
2026-06-17days on market $280,000 Active 111 DOM
-
2026-06-16days on market $280,000 Active 110 DOM
-
2026-06-15days on market $280,000 Active 109 DOM
-
2026-06-14days on market $280,000 Active 107 DOM
-
2026-06-10days on market $280,000 Active 104 DOM
-
2026-06-09remarks 473-char remark
-
2026-06-09days on market $280,000 Active 103 DOM
-
2026-06-08days on market $280,000 Active 102 DOM
-
2026-06-07days on market $280,000 Active 101 DOM
-
2026-06-03days on market $280,000 Active 97 DOM
-
2026-06-02days on market $280,000 Active 96 DOM
-
2026-06-01days on market $280,000 Active 95 DOM
-
2026-05-31days on market $280,000 Active 94 DOM
-
2026-05-30remarks 427-char remark
-
2026-05-30$280,000 Active 93 DOM
ⓘ Source: listings_history table (triggers on properties + properties_extension) + one-shot
backfill from property_details.listing_events for pre-trigger history.
Tax reassessment forecast FL · Resets to sale price
- Current annual tax
- $2,642 · $220/mo
- Projected year-2 tax
- $2,642 · $220/mo
- Expected delta
- $0/yr ($0/mo · 0.0%)
ⓘ Screening estimate from a state-policy table — verify with the county assessor before closing.
Climate risk First Street
- Flood 8/10 Severe FEMA zone X (shaded) · 93% chance over 30 yrs
- Wildfire 1/10 Low
- Heat 10/10 Extreme 7 d/yr ≥107°F today · 28 d/yr by 30 yrs out
- Wind 10/10 Extreme 99% chance of damaging wind over 30 yrs
- Air quality 2/10 Low 2 unhealthy d/yr today · 2 by 30 yrs out
Nearby sold comps map
Loading sold comps map…
Walkable amenities ~0.75 mi
Loading nearby amenities…
Taxation est. · year 1
- Rental income
- $33,839
- − Mortgage interest
- −$15,684
- − Property taxes
- −$2,642
- − Insurance
- −$2,198
- − Repairs & maintenance
- −$2,707
- − Management
- −$2,707
- − HOA
- −$7,812
- − Depreciation
- −$8,145
- Taxable loss
- −$8,057
- Est. tax savings @ 24.0%
- +$1,934
- After-tax cash flow
- $-1,606/yr
For passive investors: Depreciation is non-cash, so a rental often shows a tax loss while cash-flowing — sheltering income. Rental losses are passive: they offset passive income freely, and up to $25,000/yr can offset ordinary (W-2) income if you actively participate and your MAGI is under $100k (phasing out to $0 by $150k); unused losses carry forward. On sale, claimed depreciation is recaptured at up to 25%, and gains may owe capital-gains tax (a 1031 exchange can defer both). Figures are a year-1 estimate at your 24.0% rate — not tax advice; consult a CPA.
Schools (NCES district)
- District
- Collier
- NCES district ID
- 1200330
- Math proficiency
- 60% ▼ -4.00%
- Reading proficiency
- 56% ▼ -2.00%
- Median HH income
- $58,275
- Composite
- 50.23/100
- National rank
- #1892
- State rank
- #16 of 73 in FL
Livability — Naples
- Score
- 80/100
- State rank
- #126
- US rank
- #1903
Category grades
Schools grade is shown separately in the Schools card above.
Census & demographics
No demographic data for this ZIP.
Market trends
- HPI YoY
- —
- Current HPI
- —
- Rent YoY
- —
- Metro
- —
- State GDP YoY
- ▲ 3.28%
- F500 in state
- 36
Industry mix (Fortune 500 HQ in FL)
| Industry | F500 HQs | Revenue |
|---|---|---|
| Industrial Technology | 2 | $29B |
|
||
| Insurance | 2 | $17B |
|
||
| Retail | 1 | $60B |
|
||
| Technology Distribution | 1 | $58B |
|
||
| Homebuilding | 1 | $35B |
|
||
| Technology Manufacturing | 1 | $35B |
|
||
Price history
+384.4% since first listed6 events — show timeline
- 2026-03-25 Price Changed $280,000 MARMLS
- 2026-02-26 Listed $310,000 MARMLS
- 2023-10-23 Sold (Public Records) $263,000 Public Records
- 2022-02-14 Sold (Public Records) $175,000 Public Records
- 2001-10-09 Sold (Public Records) $77,000 Public Records
- 1994-09-27 Sold (Public Records) $57,800 Public Records
Property tax history
+11.2%/yrLatest (2025): $2,642 · +0.2% YoY. Source: county tax records.
Cash-flow waterfall
monthlySold comps — $/sqft
last 12 mo · ≤1 miLoading sold comps…