 🏗️ New Construction
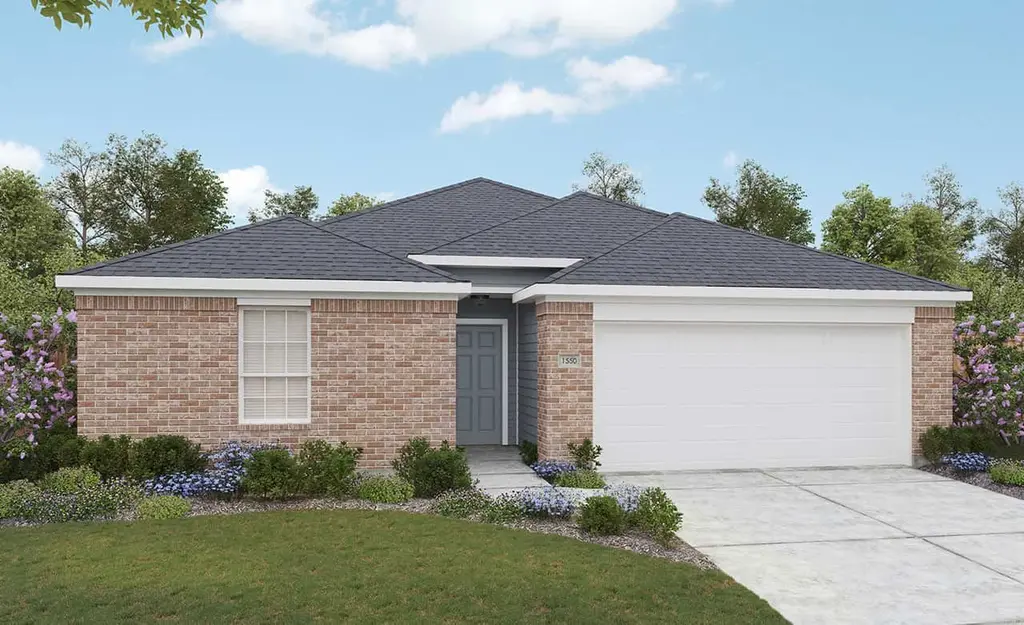
Avalon Plan · Venus, TX
Flood risk No data
- FEMA flood zone
- —
- Chance of flooding over 30 yrs
- —
- Est. flood insurance / yr
- —
Fire risk No data
- Est. fire insurance / yr
- —
Heat risk No data
- Hot days now (above threshold)
- —
- Hot days in 30 yrs
- —
Wind risk No data
- Chance of severe wind over 30 yrs
- —
Air-quality risk No data
- Unhealthy air days now
- —
- Unhealthy air days in 30 yrs
- —
Risk factors via First Street. Map © Google.
Why this score? — see what drove the D grade
The composite is a weighted blend of 9 inputs, each scored 0–100. Each bar is that input's sub-score; the figure is the points it added to the 100-point composite (weight × sub-score).
- Cash flow +9.2/30.0
- Appreciation +8.7/10.0
- ARV discount +7.5/15.0
- Livability +3.5/5.0
- Rent growth +3.1/5.0
- 1% rule +2.8/10.0
- DSCR +2.6/10.0
- Schools +2.5/10.0
- Condition / age +2.5/5.0
$299,990
🖨 Deal sheet (PDF) 📄 Offer letter ✓ Due diligence
Listing remarks MLS
Bright, welcoming, and effortlessly livable, the one-story Avalon proves that great design lives in the details. From the to the open-concept living spaces and covered patio, this home is thoughtfully crafted for the way you live today. The kitchen is the heart of the home, with a spacious island and seamless flow into the dining and family rooms - perfect for casual mornings, festive dinners, and everything in between. A private primary suite at the back of the home creates a relaxing retreat, complete with a spacious bath and an expansive closet with the choice to add laundry room access for the ultimate convenience. Three additional bedrooms surround a shared bath, offering comfort, privacy, and space for everyone in the household. With its graceful layout and natural sense of flow, the Avalon offers more than comfort - it offers possibility. Whether you're just starting out or simply looking for a place that feels like it was made for you, the Avalon adapts with ease. This is a home where lasting memories are made, and everyday moments feel extraordinary.
Key facts
- 2 garage spots
- Listed 234 days
Neighborhood map
What this means for you Summary
Snapshot
- This is a 4-bed/2.0-bath single-family listed at $300k.
Deal economics
- At list price, monthly cash flow is $-227 ($-3k/yr) — negative.
- To cash-flow at today's rent, offer at most $269k (10.3% below list).
- To meet the 1% rule (rent ≥ 1% of price), the offer needs to be $235k (21.6% below list).
- Recommended offer: $235k (21.6% below list) — sets the bar for 1% rule.
- Cap rate 5.4% vs local median 3.0% in Venus — top-decile yield for the area; either an underpriced asset or a hidden risk that comps aren't pricing in. Stress-test before assuming the spread holds.
Location & tenants
- Location reads 70/100 on livability (#356 in TX) — a middle-class / working-renter tenant base. Strengths: crime A+, employment A+, cost of living A+; Watch: amenities F, commute F, health & safety F.
- Venus ISD (town): math 25% / reading 32% proficiency, ranked #646 of 826 in TX (top 78%) — low school quality limits family demand, transient renter base, plan for 1-2y turnover; 60% free/reduced lunch — lower-income household profile, screen leases tightly.
- Zoned schools: Venus El (math 27% / reading 30%, grade F, #2,706 of 4,322 statewide, top 63%, 658 students, 82% FRL); Venus Middle (math 20% / reading 32%, grade F, #1,222 of 1,662 statewide, top 74%, 491 students, 80% FRL); Venus H S (math 32% / reading 35%, grade F, #1,011 of 1,632 statewide, top 63%, 725 students, 76% FRL) — zoned schools average 79% FRL vs 60% district-wide (19 pts higher); higher-poverty schools than district average — tighter screening recommended.
- Market conditions: Rents rising (+2.4%/yr); 427 active listings in the ZIP; 40 comparable units currently listed for rent nearby; rentals at typical pace (median 18d on market — plan ~3-4 weeks tenant-placement turnaround); solid renter incomes; 2,152 units permitted in Johnson County in 2024 (76 in 5+ unit buildings).
Forward outlook
- In year one you build about $24k of equity ($2k loan paydown + $22k appreciation (7.3% local appreciation)).
- Johnson County population projected at +24% by 2050 — long-run rental-demand tailwind backs the buy-and-hold thesis.
- By year 2, paydown + projected appreciation supports a ~$39k cash-out refi (75% LTV) — recoverable capital for the next deal without selling this one.
Negotiation context
- It's been on market 234 days — a 12% lower offer ($264k) is reasonable based on typical stale-listing flexibility.
Questions for the listing agent
- What do current leases actually rent for vs. the listed asking? Can we see a recent rent roll and the last 12 months of T-12 income?
- It's been on market 234 days. Have you received any prior offers? Is the seller open to a 22% concession, seller financing, or rate buy-down credit?
- Why hasn't it sold? Are there any deal-killer items the seller is aware of (foundation, flood, title, zoning, code violations)?
- Is there a deadline driving the sale (1031 exchange, divorce, estate, relocation)? That informs how much negotiation room exists.
- Schools are D-rated, which usually means shorter tenancies and higher turnover. Who's the typical renter profile here, and what's been the actual vacancy rate?
- The area grade is low — what's the realistic commute time and amenity access for the typical tenant pool here? Any planned neighborhood developments (good or bad) we should know about?
- What's the average days-on-market for RENTAL listings here right now (not sales)? A rising rental-DOM trend means longer vacancies and softer asking-rent achievability than the comps imply.
- What's the recent tenant-quality profile in this submarket — average credit score on applications, eviction rate, late-payment / NSF rate, and stable-employment percentage? A property-management company in the area should have these aggregated.
- How much new for-sale + rental construction is in the pipeline within 1–3 miles? Heavy new supply typically softens prices + rents 12–24 months out; constrained supply supports both.
Investment metrics
- 1% rule
- 0.78% ✗
- Cap rate
- 5.39%
- Cash-on-cash
- -3.22%
- DSCR
- 0.86
- GRM
- 10.7
CMA / ARV
- ARV (median comp)
- $301,755
- List price
- $299,990
- Delta
- -0.58%
- Verdict
- FAIR
- Comps
- 20 within 1.0 mi
Show comp detail 12 sales within ~0.75 mi
| Address | Dist | Beds/Ba | Sqft | Sold | Price | $/sf | Match |
|---|---|---|---|---|---|---|---|
| 128 Patrick Henry Dr | 0.07mi | 4/2.0 | 1,553 (+0%) | 0mo | $314,890 | $203 | 96 |
| 104 John Laurens Dr | 0.20mi | 4/2.0 | 1,553 (+0%) | 2mo | $289,990 | $187 | 88 |
| 126 Patrick Henry Dr | 0.07mi | 3/2.0 (-1) | 1,606 (+4%) | 2mo | $324,890 | $202 | 84 |
| 134 Yorktown Ct | 0.23mi | 3/2.0 (-1) | 1,605 (+4%) | 1mo | $275,000 | $171 | 78 |
| 223 Patton Ln | 0.24mi | 3/2.0 (-1) | 1,658 (+7%) | 1mo | $325,900 | $197 | 71 |
| 311 Patton Ln | 0.27mi | 3/2.0 (-1) | 1,658 (+7%) | 1mo | $325,900 | $197 | 70 |
| 136 Kennedy Dr | 0.42mi | 3/2.0 (-1) | 1,597 (+3%) | 1mo | $270,000 | $169 | 70 |
| 523 Bennie Leonard St | 0.39mi | 4/2.0 | 1,690 (+9%) | 2mo | $279,000 | $165 | 65 |
| 319 Julian Davis Dr | 0.48mi | 3/2.0 (-1) | 1,658 (+7%) | 2mo | $320,900 | $194 | 59 |
| 210 Julian Davis Dr | 0.39mi | 3/2.0 (-1) | 1,379 (-11%) | 1mo | $307,900 | $223 | 58 |
| 320 Julian Davis Dr | 0.46mi | 3/2.0 (-1) | 1,379 (-11%) | 2mo | $301,900 | $219 | 54 |
| 317 Julian Davis Dr | 0.48mi | 3/2.0 (-1) | 1,379 (-11%) | 2mo | $307,900 | $223 | 53 |
Match score weights: distance 35% · size 25% · config 20% · recency 20%. Top-matched comps best support the ARV.
Projected returns pro-forma
7.32% appreciation · 2.39% rent growth · sell at horizon
- IRR
- 15.8%
- Equity multiple
- 2.13×
- Total profit
- $95,509
- Equity at exit
- $215,459
- IRR
- 15.3%
- Equity multiple
- 4.37×
- Total profit
- $285,103
- Equity at exit
- $415,159
Cash invested: $84,491 (down + closing). Projections, not guarantees.
Landlord ↔ Tenant lean methodology
- Overall (STATE)
- 87 Strongly Landlord-Friendly
- State Texas
- 87 Strongly Landlord-Friendly · R+5
- County
- — inherits STATE
- City
- — inherits STATE
ZIP-level market 76084
- Home prices YoY
- 2.1%
- Rents YoY
- 2.4%
- Active inventory
- 427
- Price-to-rent
- 10.6×
Monthly cashflow live
- Estimated rent
- $2,353 high interval (Pro) →
- Mortgage (P&I)
- −$1,582
- Tax est. 1.5%
- −$377 /mo · $4,526/yr
- Insurance
- −$126
- HOA
- −$0
- Vacancy / Maint / Mgmt
- −$494
- Net cashflow
- $-227
Break-even live
Sensitivity live
| Price | -10% $-18 | -5% $-122 | +0% $-227 | +5% $-331 | +10% $-435 |
|---|---|---|---|---|---|
| Rent | -10% $-412 | -5% $-320 | +0% $-227 | +5% $-134 | +10% $-41 |
| Rate | -1.0pp $-75 | -0.5pp $-150 | base $-227 | +0.5pp $-305 | +1.0pp $-384 |
UW: 25.0% down · 7.5% · 30yr · 1.5% tax · 5.0% vac · 8.0% maint · 8.0% mgmt
Financing live
Cash to close
- Down payment
- $75,439
- Closing costs
- $9,053
- Reserves months
- —
- Total cash needed
- —
Loan-product check · same deal, 3 products live
Conventional
25% down · 7.5% · 30yr
- Down + closing
- —
- Monthly P&I
- —
- Monthly cashflow
- —
- DSCR
- —
- Eligible?
- —
Personal DTI + credit; lowest rate.
DSCR
20% down · 8.5% · 30yr
- Down + closing
- —
- Monthly P&I
- —
- Monthly cashflow
- —
- DSCR
- —
- Eligible?
- —
No personal income docs; deal must DSCR.
Hard money
10% down · 12.0% · 12mo
- Down + closing
- —
- Monthly P&I
- —
- Monthly cashflow
- —
- DSCR
- —
- Eligible?
- —
Short-term bridge; refi at stabilization.
Rent comps 40 comps
| Address | Beds | Baths | Sqft | Rent | $/sqft | DOM | Units | Dist |
|---|---|---|---|---|---|---|---|---|
| 201 John Laurens Dr Venus, TX | 3.0–5.0 | 2.0–2.5 | 1975 | $2,535 | $1.28 | 0d | 1 | 0.05mi |
| 512 Albert Anthony St Venus, TX | 3.0 | 2.0 | 1658 | $1,990 | $1.20 | 24d | 1 | 0.23mi |
| 512 Albert Anthony St Venus, TX | 3.0 | 2.0 | 1658 | $1,990 | $1.20 | 1d | 1 | 0.23mi |
| 313 Patton Ln Venus, TX | 4.0 | 2.0 | 1784 | $2,355 | $1.32 | 9d | 1 | 0.25mi |
| 315 Patton Ln Venus, TX | 4.0 | 2.5 | 2173 | $2,515 | $1.16 | 5d | 1 | 0.26mi |
| 325 Condie Russell Ave Venus, TX | 4.0 | 2.5 | 2189 | $2,325 | $1.06 | 14d | 1 | 0.31mi |
| 147 Sammy Fowler Ave Venus, TX | 4.0 | 2.0 | 1690 | $2,250 | $1.33 | 0d | 1 | 0.34mi |
| 201 Julian Davis Dr Venus, TX | 3.0 | 2.5 | 1626 | $2,195 | $1.35 | 21d | 1 | 0.38mi |
| 208 Julian Davis Dr Venus, TX | 4.0 | 2.0 | 1784 | $2,330 | $1.31 | 13d | 1 | 0.40mi |
| 523 Bennie Leonard St Venus, TX | 4.0 | 2.0 | 1690 | $2,350 | $1.39 | 0d | 1 | 0.42mi |
| 214 Julian Davis Dr Venus, TX | 4.0 | 2.0 | 1784 | $2,355 | $1.32 | 45d | 1 | 0.44mi |
| 358 Condie Russell Ave Venus, TX | 3.0 | 2.0 | 1658 | $1,995 | $1.20 | 4d | 1 | 0.45mi |
| 418 Watson Ct Venus, TX | 3.0 | 2.0 | 1379 | $2,210 | $1.60 | 45d | 1 | 0.47mi |
| 170 Kennedy Dr Venus, TX | 4.0 | 2.0 | 1661 | $2,300 | $1.38 | 0d | 1 | 0.49mi |
| 120 Mt Vernon Ln Venus, TX | 3.0 | 2.0 | 1661 | $2,149 | $1.29 | 45d | 1 | 0.50mi |
| 315 Julian Davis Dr Venus, TX | 4.0 | 2.0 | 1784 | $2,355 | $1.32 | 0d | 1 | 0.51mi |
| 131 Mt Vernon Ln Venus, TX | 3.0 | 2.0 | 1652 | $2,169 | $1.31 | 24d | 1 | 0.51mi |
| 430 Gib Woodall Dr Venus, TX | 3.0 | 2.0 | 1379 | $2,000 | $1.45 | 5d | 1 | 0.54mi |
| 427 Condie Russell Ave Venus, TX | 3.0 | 2.0 | 1218 | $1,965 | $1.61 | 45d | 1 | 0.56mi |
| 101 Hancock St Venus, TX | 3.0 | 2.5 | 1773 | $1,929 | $1.09 | 3d | 1 | 0.57mi |
| 501 Gib Woodall Dr Venus, TX | 3.0 | 2.0 | 1218 | $1,945 | $1.60 | 45d | 1 | 0.57mi |
| 428 Condie Russell Ave Venus, TX | 4.0 | 2.0 | 1784 | $2,150 | $1.21 | 26d | 1 | 0.58mi |
| 108 Rushmore Ln Venus, TX | 4.0 | 2.0 | 1658 | $1,969 | $1.19 | 26d | 1 | 0.61mi |
| 112 Liberty Ln Venus, TX | 4.0 | 2.0 | 1658 | $2,309 | $1.39 | 45d | 1 | 0.76mi |
| 135 Houston Pl Venus, TX | 3.0 | 2.0 | 1590 | $2,029 | $1.28 | 0d | 1 | 0.78mi |
| 628 Blackland Dr Venus, TX | 4.0 | 2.5 | 1483 | $2,200 | $1.48 | 0d | 1 | 0.78mi |
| 645 Blackland Dr Venus, TX | 3.0 | 2.0 | 1361 | $1,950 | $1.43 | 45d | 1 | 0.79mi |
| 640-644 Wheatfield DR Venus, TX | 4.0 | 2.0 | 1926 | $2,100 | $1.09 | 0d | 1 | 0.81mi |
| 656-660 Wheatfield DR Venus, TX | 3.0 | 2.0 | 1301 | $1,950 | $1.50 | 0d | 1 | 0.83mi |
| 645 Fallow Dr Venus, TX | 3.0 | 2.0 | 1301 | $1,950 | $1.50 | 9d | 1 | 0.85mi |
| 728 Fallow Dr Venus, TX | 3.0 | 2.0 | 1347 | $1,795 | $1.33 | 17d | 1 | 0.86mi |
| 601 Harvest Moon Dr Venus, TX | 3.0 | 2.0 | 1347 | $1,795 | $1.33 | 45d | 1 | 0.86mi |
| 720 Blackland Dr Venus, TX | 4.0 | 2.5 | 1926 | $2,200 | $1.14 | 9d | 1 | 0.86mi |
| 733 Wheatfield Dr Venus, TX | 3.0 | 2.0 | 1347 | $1,795 | $1.33 | 26d | 1 | 0.89mi |
| 620-616 Harvest Moon Dr Venus, TX | 3.0 | 2.0 | 1307 | $1,950 | $1.49 | 45d | 1 | 0.89mi |
| 729 Fallow Dr Venus, TX | 3.0 | 2.0 | 1301 | $1,995 | $1.53 | 45d | 1 | 0.91mi |
| 748 Wheatfield Dr Venus, TX | 3.0 | 2.0 | 1361 | $1,950 | $1.43 | 45d | 1 | 0.92mi |
| 704 Harvest Moon Dr Venus, TX | 3.0 | 2.0 | 1361 | $1,850 | $1.36 | 46d | 1 | 0.95mi |
| 712 Harvest Moon Dr Venus, TX | 3.0 | 2.0 | 1301 | $1,895 | $1.46 | 26d | 1 | 0.96mi |
| 261 Heritage Hills Pkwy Venus, TX | 1.0–3.0 | 1.0–2.0 | 912 | $2,305 | $2.53 | 0d | 1 | 1.00mi |
Listing history 17 events
-
2026-06-21days on market $299,990 Active 234 DOM
-
2026-06-18days on market $299,990 Active 231 DOM
-
2026-06-17days on market $299,990 Active 230 DOM
-
2026-06-16days on market $299,990 Active 229 DOM
-
2026-06-15days on market $299,990 Active 228 DOM
-
2026-06-13days on market $299,990 Active 226 DOM
-
2026-06-13days on market $299,990 Active 225 DOM
-
2026-06-09days on market $299,990 Active 222 DOM
-
2026-06-08days on market $299,990 Active 221 DOM
-
2026-06-07days on market $299,990 Active 220 DOM
-
2026-06-04days on market $299,990 Active 217 DOM
-
2026-06-03days on market $299,990 Active 216 DOM
-
2026-06-02days on market $299,990 Active 215 DOM
-
2026-06-01days on market $299,990 Active 214 DOM
-
2026-05-31days on market $299,990 Active 213 DOM
-
2026-01-07price $299,990 1075-char remark
Show marketing remark (1075 chars)
Bright, welcoming, and effortlessly livable, the one-story Avalon proves that great design lives in the details. From the to the open-concept living spaces and covered patio, this home is thoughtfully crafted for the way you live today. The kitchen is the heart of the home, with a spacious island and seamless flow into the dining and family rooms - perfect for casual mornings, festive dinners, and everything in between. A private primary suite at the back of the home creates a relaxing retreat, complete with a spacious bath and an expansive closet with the choice to add laundry room access for the ultimate convenience. Three additional bedrooms surround a shared bath, offering comfort, privacy, and space for everyone in the household. With its graceful layout and natural sense of flow, the Avalon offers more than comfort - it offers possibility. Whether you're just starting out or simply looking for a place that feels like it was made for you, the Avalon adapts with ease. This is a home where lasting memories are made, and everyday moments feel extraordinary.
-
2025-10-30$304,990 Active 1075-char remark
Show marketing remark (1075 chars)
Bright, welcoming, and effortlessly livable, the one-story Avalon proves that great design lives in the details. From the to the open-concept living spaces and covered patio, this home is thoughtfully crafted for the way you live today. The kitchen is the heart of the home, with a spacious island and seamless flow into the dining and family rooms - perfect for casual mornings, festive dinners, and everything in between. A private primary suite at the back of the home creates a relaxing retreat, complete with a spacious bath and an expansive closet with the choice to add laundry room access for the ultimate convenience. Three additional bedrooms surround a shared bath, offering comfort, privacy, and space for everyone in the household. With its graceful layout and natural sense of flow, the Avalon offers more than comfort - it offers possibility. Whether you're just starting out or simply looking for a place that feels like it was made for you, the Avalon adapts with ease. This is a home where lasting memories are made, and everyday moments feel extraordinary.
ⓘ Source: listings_history table (triggers on properties + properties_extension) + one-shot
backfill from property_details.listing_events for pre-trigger history.
Nearby sold comps map
Loading sold comps map…
Walkable amenities ~0.75 mi
Loading nearby amenities…
Taxation est. · year 1
- Rental income
- $28,234
- − Mortgage interest
- −$16,903
- − Property taxes
- −$4,526
- − Insurance
- −$1,509
- − Repairs & maintenance
- −$2,259
- − Management
- −$2,259
- − Depreciation
- −$8,778
- Taxable loss
- −$7,999
- Est. tax savings @ 24.0%
- +$1,920
- After-tax cash flow
- $-799/yr
For passive investors: Depreciation is non-cash, so a rental often shows a tax loss while cash-flowing — sheltering income. Rental losses are passive: they offset passive income freely, and up to $25,000/yr can offset ordinary (W-2) income if you actively participate and your MAGI is under $100k (phasing out to $0 by $150k); unused losses carry forward. On sale, claimed depreciation is recaptured at up to 25%, and gains may owe capital-gains tax (a 1031 exchange can defer both). Figures are a year-1 estimate at your 24.0% rate — not tax advice; consult a CPA.
Schools (NCES district)
- District
- Venus ISD
- NCES district ID
- 4844010
- Math proficiency
- 25% ▼ -15.00%
- Reading proficiency
- 32% ▼ -2.00%
- Median HH income
- $50,394
- Composite
- 24.97/100
- National rank
- #7563
- State rank
- #646 of 826 in TX
Livability — Venus
- Score
- 70/100
- State rank
- #356
- US rank
- #7724
Category grades
Schools grade is shown separately in the Schools card above.
Census & demographics
- Census place
- Venus, TX
- County
- Johnson County · 147,987 people
- Metro
- Dallas-Fort Worth-Arlington, TX
- Population (ZIP)
- 14,097
- Household income
- $102,115
- Rent vs Own
- Severe rent burden
- 70.0
Population outlook (Johnson County) Hauer SSP2
- Today (2025)
- 179,678 people
- By 2030
- 189,208 · +5.3%
- By 2040
- 207,261 · +15.4%
- By 2050
- 223,064 · +24.1%
- By 2075
- 259,979 · +44.7%
- By 2100
- 275,395 · +53.3%
Race, ethnicity, and origin ACS 2023
- Neighborhood character
- Diverse neighborhood (Simpson 0.63)
- Race & ethnicity
- White 52% Hispanic / Latino 30% Two or more races 24% Black 11% Asian 1%
- Hispanic origin (detail)
- Mexican 25% Puerto Rican 1%
- Common ancestry
- Romanian 2% Lithuanian 1% Slovak 1%
- Foreign-born
- 8% · Canada
- Languages at home
- 78% English-only · Spanish 18% Arabic 1% French/Haitian/Cajun 1%
Political lean MEDSL · Johnson
- 2024 margin
- Solid R (+51.4) · D 23.9% · R 75.3%
- 2008→2024 swing
- -3.9pp toward R · 2008: -47.5pp · 2024: -51.4pp
- All cycles
- 2024: R+51.4 2020: R+53.0 2016: R+58.3 2012: R+55.6 2008: R+47.5
Not yet ingested
- Civics
- —
Market trends
- HPI YoY
- ▲ 7.32%
- Current HPI
- 355.74
- Rent YoY
- ▲ 2.39%
- Metro
- Dallas-Fort Worth-Arlington, TX
- State GDP YoY
- ▲ 3.95%
- F500 in state
- 110
Industry mix (Fortune 500 HQ in TX)
| Industry | F500 HQs | Revenue |
|---|---|---|
| Energy | 16 | $1,198B |
|
||
| Technology | 5 | $198B |
|
||
| Engineering / Construction | 4 | $72B |
|
||
| Energy Services | 3 | $60B |
|
||
| Utilities | 3 | $41B |
|
||
| Healthcare | 2 | $330B |
|
||
Price history
-1.6% since first listed2 events — show timeline
- 2026-01-07 Price Changed $299,990 Zillow
- 2025-10-30 Listed $304,990 Zillow
Cash-flow waterfall
monthlySold comps — $/sqft
last 12 mo · ≤1 miLoading sold comps…