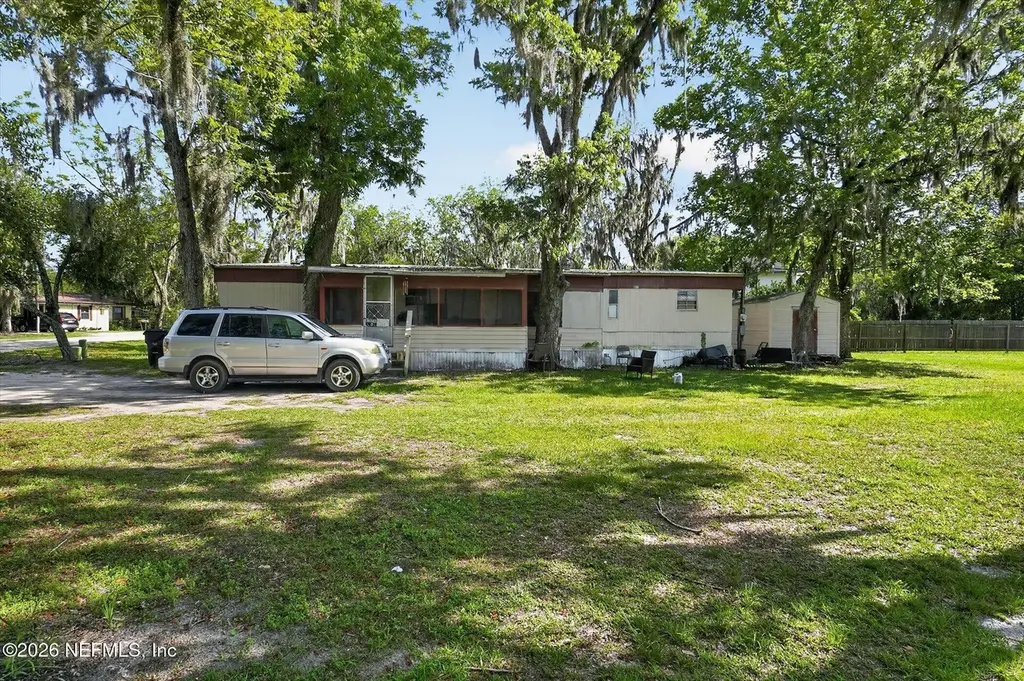
170 SW 9th Ave · Lake Butler, FL
Flood risk 1/10 · Minimal
- FEMA flood zone
- X (unshaded)
- Chance of flooding over 30 yrs
- 0.0%
- Est. flood insurance / yr
- $507 – $1,088
Fire risk 4/10 · Minor
- Est. fire insurance / yr
- $947 – $1,759
Heat risk 8/10 · Major
- Hot days now (above 107°F)
- 7 days/yr
- Hot days in 30 yrs
- 21 days/yr
Wind risk 9/10 · Severe
- Chance of severe wind over 30 yrs
- 99.0%
Air-quality risk 3/10 · Minor
- Unhealthy air days now
- 3 days/yr
- Unhealthy air days in 30 yrs
- 3 days/yr
Risk factors via First Street. Map © Google.
Why this score? — see what drove the A- grade
The composite is a weighted blend of 9 inputs, each scored 0–100. Each bar is that input's sub-score; the figure is the points it added to the 100-point composite (weight × sub-score).
- Cash flow +30.0/30.0
- 1% rule +10.0/10.0
- DSCR +10.0/10.0
- Appreciation +10.0/10.0
- ARV discount +7.5/15.0
- Schools +4.9/10.0
- Livability +3.2/5.0
- Rent growth +2.5/5.0
- Condition / age +2.5/5.0
$50,000
🖨 Deal sheet 📄 Offer letter ✓ Due diligence
Listing remarks
SELLER MOTIVATED!!! Owner wants to sell this property and the neighboring property 160 SW 9th Avenue under 1 sale. This home is currently being rented out to a long term tenant on a month to month lease so producing income from day 1. Some of the small metal gate from 160 SW 9th Avenue is crossing over onto this property. Home will be getting resurveyed if sold apart from 160 SW 9th Avenue! ESTIMATED new lot size is 0.36 acres Cash only! Financing may not be available for this home.
Key facts
- 0.46 acre lot
- Built 1974
- Listed 22 days
Property features AI
Finance
- HOA & community: Not a senior community
Exterior
- Parking: Other parking type
- Utilities: Utilities available (unspecified)
- Home design: Double wide manufactured home; Used as residential and investment property
- Construction: Metal roof
- Exterior features: Dirt road access; Other on-site structures
Interior
- Kitchen: Appliances included (unspecified)
- Bedrooms: 3 bedrooms
- Bathrooms: 2 full bathrooms
- Heating & cooling: Has cooling (type unspecified)
- Interior features: Includes unspecified built-in appliances
- Laundry & utility: Unfurnished unit (no built-in laundry described)
Neighborhood map
What this means for you Summary
Snapshot
- This is a 3-bed/2.0-bath manufactured listed at $50k.
Deal economics
- At list price, monthly cash flow is $614 ($7k/yr) — positive.
- The deal already cash-flows at list — no discount required.
- Meets the 1% rule at list price ($1k rent vs $50k).
- Recommended offer: $49k (1.5% below list) — sets the bar for market timing.
- Cap rate 21.0% vs local median 1.2% in Lake Butler — top-decile yield for the area; either an underpriced asset or a hidden risk that comps aren't pricing in. Stress-test before assuming the spread holds.
Location & tenants
- Location reads 64/100 on livability (#681 in FL) — a middle-class / working-renter tenant base. Strengths: crime A+, employment A+, housing A-; Watch: amenities F, commute F, cost of living F.
- Union (town): math 62% / reading 54% proficiency, ranked #17 of 73 in FL (top 23%) — acceptable for families but not a draw, mixed tenant base, ~2y average lease.
- Market conditions: 65 active listings in the ZIP; 45 units permitted in Union County in 2024 (0 in 5+ unit buildings).
Forward outlook
- In year one you build about $5k of equity ($346 loan paydown + $5k appreciation (10.0% local appreciation)).
- Union County population projected to shrink 9% by 2050 — rents likely to lag national; underwrite the cash flow, not the appreciation.
- At projected returns (10.0% appreciation + 3.0% rent growth), your $14k cash investment doubles in ~2 years — after that, you're playing with house money.
- By year 6, paydown + projected appreciation supports a ~$31k cash-out refi (75% LTV) — recoverable capital for the next deal without selling this one.
Negotiation context
- It's been on market 23 days — a 2% lower offer ($49k) is reasonable based on typical stale-listing flexibility.
Risks & watch-outs
- Climate carrying-cost: severe wind risk, 99% chance of damaging wind over 30y; extreme-heat days projected 7→21/yr by 2055 (HVAC capex compounding) — expect insurance premiums to compound above CPI over the hold.
Questions for the listing agent
- Built in 1974 — when were the roof, HVAC, electrical panel, plumbing, and water heater last replaced?
- Is there a deadline driving the sale (1031 exchange, divorce, estate, relocation)? That informs how much negotiation room exists.
- Schools are B-rated — typically a magnet for longer-tenancy family renters. What's the average tenant stay here, and is there a school-zone premium baked into asking?
- What's the average days-on-market for RENTAL listings here right now (not sales)? A rising rental-DOM trend means longer vacancies and softer asking-rent achievability than the comps imply.
- What's the recent tenant-quality profile in this submarket — average credit score on applications, eviction rate, late-payment / NSF rate, and stable-employment percentage? A property-management company in the area should have these aggregated.
- How much new for-sale + rental construction is in the pipeline within 1–3 miles? Heavy new supply typically softens prices + rents 12–24 months out; constrained supply supports both.
Investment metrics
- 1% rule
- 2.40% ✓
- Cap rate
- 21.03%
- Cash-on-cash
- 52.62%
- DSCR
- 3.34
- GRM
- 3.5
CMA / ARV
No comps found within radius.
Projected returns pro-forma
10.0% appreciation · 3.0% rent growth · sell at horizon
- IRR
- 65.8%
- Equity multiple
- 5.74×
- Total profit
- $66,345
- Equity at exit
- $45,044
- IRR
- 59.4%
- Equity multiple
- 12.76×
- Total profit
- $164,646
- Equity at exit
- $97,139
Cash invested: $14,000 (down + closing). Projections, not guarantees.
Landlord ↔ Tenant lean methodology
- Overall (STATE)
- 87 Strongly Landlord-Friendly
- State Florida
- 87 Strongly Landlord-Friendly · R+3
- County
- — inherits STATE
- City
- — inherits STATE
ZIP-level market 32054
- Home prices YoY
- 16.6%
- Active inventory
- 65
- Price-to-rent
- 3.5×
Monthly cashflow live
- Estimated rent
- $1,200 medium interval (Pro) →
- Mortgage (P&I)
- −$262
- Tax from tax record
- −$51 /mo · $611/yr
- Insurance
- −$21
- HOA
- −$0
- Vacancy / Maint / Mgmt
- −$252
- Net cashflow
- $614
Break-even live
UW: 25.0% down · 7.5% · 30yr · 1.5% tax · 5.0% vac · 8.0% maint · 8.0% mgmt
Financing live
Cash to close
- Down payment
- $12,500
- Closing costs
- $1,500
- Reserves months
- —
- Total cash needed
- —
Loan-product check · same deal, 3 products live
Conventional
25% down · 7.5% · 30yr
- Down + closing
- —
- Monthly P&I
- —
- Monthly cashflow
- —
- DSCR
- —
- Eligible?
- —
Personal DTI + credit; lowest rate.
DSCR
20% down · 8.5% · 30yr
- Down + closing
- —
- Monthly P&I
- —
- Monthly cashflow
- —
- DSCR
- —
- Eligible?
- —
No personal income docs; deal must DSCR.
Hard money
10% down · 12.0% · 12mo
- Down + closing
- —
- Monthly P&I
- —
- Monthly cashflow
- —
- DSCR
- —
- Eligible?
- —
Short-term bridge; refi at stabilization.
Listing history 19 events
-
2026-06-19days on market $50,000 Active 23 DOM
-
2026-06-18remarks 493-char remark
-
2026-06-18days on market $50,000 Active 22 DOM
-
2026-06-17days on market $50,000 Active 21 DOM
-
2026-06-16days on market $50,000 Active 20 DOM
-
2026-06-15days on market $50,000 Active 19 DOM
-
2026-06-14days on market $50,000 Active 17 DOM
-
2026-06-12days on market $50,000 Active 16 DOM
-
2026-06-09days on market $50,000 Active 13 DOM
-
2026-06-09remarks 414-char remark
-
2026-06-08days on market $50,000 Active 12 DOM
-
2026-06-07days on market $50,000 Active 11 DOM
-
2026-06-05days on market $50,000 Active 8 DOM
-
2026-06-03days on market $50,000 Active 7 DOM
-
2026-06-02days on market $50,000 Active 6 DOM
-
2026-06-01days on market $50,000 Active 5 DOM
-
2026-05-31days on market $50,000 Active 4 DOM
-
2026-05-30days on market $50,000 Active 3 DOM
-
2026-05-27$50,000 Active
ⓘ Source: listings_history table (triggers on properties + properties_extension) + one-shot
backfill from property_details.listing_events for pre-trigger history.
Tax reassessment forecast FL · Resets to sale price
- Current annual tax
- $611 · $51/mo
- Projected year-2 tax
- $611 · $51/mo
- Expected delta
- $0/yr ($0/mo · 0.0%)
ⓘ Screening estimate from a state-policy table — verify with the county assessor before closing.
Climate risk First Street
- Flood 1/10 Low FEMA zone X (unshaded) · 0% chance over 30 yrs
- Wildfire 4/10 Moderate
- Heat 8/10 Severe 7 d/yr ≥107°F today · 21 d/yr by 30 yrs out
- Wind 9/10 Extreme 99% chance of damaging wind over 30 yrs
- Air quality 3/10 Moderate 3 unhealthy d/yr today · 3 by 30 yrs out
Nearby sold comps map
Loading sold comps map…
Walkable amenities ~0.75 mi
Loading nearby amenities…
Taxation est. · year 1
- Rental income
- $14,398
- − Mortgage interest
- −$2,801
- − Property taxes
- −$611
- − Insurance
- −$250
- − Repairs & maintenance
- −$1,152
- − Management
- −$1,152
- − Depreciation
- −$1,455
- Taxable income
- $6,978
- Est. tax owed @ 24.0%
- −$1,675
- After-tax cash flow
- $5,692/yr
For passive investors: Depreciation is non-cash, so a rental often shows a tax loss while cash-flowing — sheltering income. Rental losses are passive: they offset passive income freely, and up to $25,000/yr can offset ordinary (W-2) income if you actively participate and your MAGI is under $100k (phasing out to $0 by $150k); unused losses carry forward. On sale, claimed depreciation is recaptured at up to 25%, and gains may owe capital-gains tax (a 1031 exchange can defer both). Figures are a year-1 estimate at your 24.0% rate — not tax advice; consult a CPA.
Schools (NCES district)
- District
- Union
- NCES district ID
- 1201890
- Math proficiency
- 62% ▼ -11.00%
- Reading proficiency
- 54% ▼ -7.00%
- Median HH income
- $40,908
- Composite
- 48.59/100
- National rank
- #2111
- State rank
- #17 of 73 in FL
Livability — Lake Butler
- Score
- 64/100
- State rank
- #681
- US rank
- #14143
Category grades
Schools grade is shown separately in the Schools card above.
Census & demographics
- Census place
- Lake Butler, FL
- City population
- 43,700
- Population (ZIP)
- 12,467
Population outlook (Union County) Hauer SSP2
- Today (2025)
- 14,613 people
- By 2030
- 14,322 · -2.0%
- By 2040
- 13,780 · -5.7%
- By 2050
- 13,325 · -8.8%
- By 2075
- 11,965 · -18.1%
- By 2100
- 9,102 · -37.7%
Race, ethnicity, and origin ACS 2023
- Neighborhood character
- Predominantly White (75%)
- Race & ethnicity
- White 75% Black 14% Two or more races 8% Hispanic / Latino 4%
- Common ancestry
- Slovak 2% Lithuanian 1% Italian 1%
- Foreign-born
- 2% · Canada
- Languages at home
- 95% English-only · Spanish 4%
Political lean MEDSL · Union
- 2024 margin
- Solid R (+68.3) · D 15.6% · R 83.8%
- 2008→2024 swing
- -18.4pp toward R · 2008: -49.9pp · 2024: -68.3pp
- All cycles
- 2024: R+68.3 2020: R+65.3 2016: R+62.4 2012: R+49.0 2008: R+49.9
Not yet ingested
- Civics
- —
Market trends
- HPI YoY
- ▲ 33.99%
- Current HPI
- 239.3346
- Rent YoY
- —
- Metro
- —
- State GDP YoY
- ▲ 3.28%
- F500 in state
- 36
Industry mix (Fortune 500 HQ in FL)
| Industry | F500 HQs | Revenue |
|---|---|---|
| Industrial Technology | 2 | $29B |
|
||
| Insurance | 2 | $17B |
|
||
| Retail | 1 | $60B |
|
||
| Technology Distribution | 1 | $58B |
|
||
| Homebuilding | 1 | $35B |
|
||
| Technology Manufacturing | 1 | $35B |
|
||
Price history
1 event — show timeline
- 2026-05-27 Listed $50,000 realMLS
Property tax history
+4.2%/yrLatest (2025): $611 · +4.7% YoY. Source: county tax records.
Cash-flow waterfall
monthlySold comps — $/sqft
last 12 mo · ≤1 miLoading sold comps…