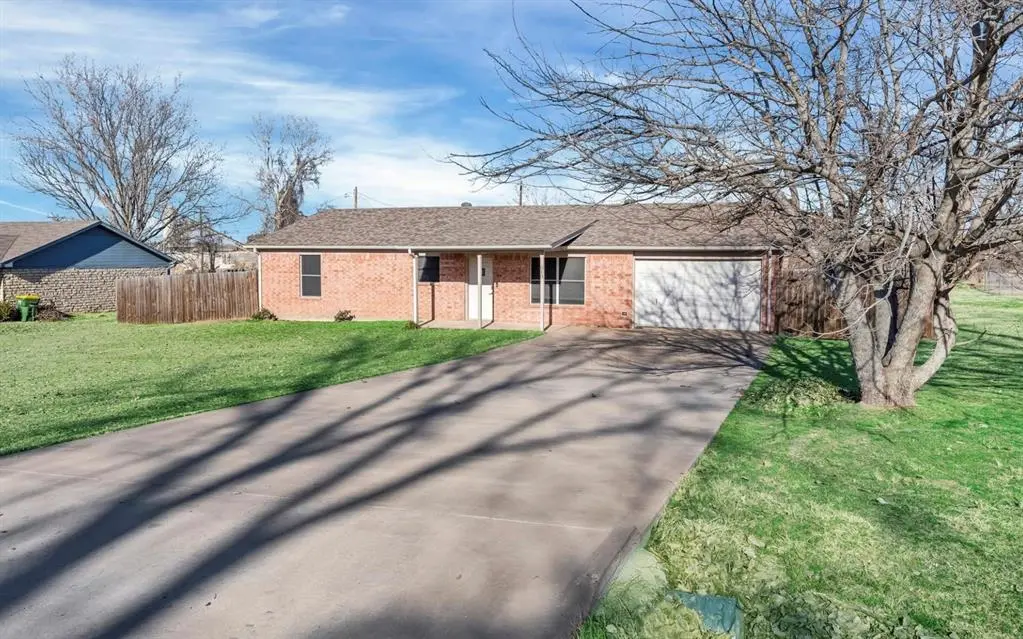
513 Ranch Rd · Granbury, TX
Flood risk 1/10 · Minimal
- FEMA flood zone
- X (unshaded)
- Chance of flooding over 30 yrs
- 0.0%
- Est. flood insurance / yr
- $507 – $1,088
Fire risk 5/10 · Moderate
- Est. fire insurance / yr
- $1,222 – $2,270
Heat risk 7/10 · Major
- Hot days now (above 108°F)
- 7 days/yr
- Hot days in 30 yrs
- 23 days/yr
Wind risk 6/10 · Moderate
- Chance of severe wind over 30 yrs
- 27.0%
Air-quality risk 2/10 · Minimal
- Unhealthy air days now
- 1 days/yr
- Unhealthy air days in 30 yrs
- 2 days/yr
Risk factors via First Street. Map © Google.
Why this score? — see what drove the D grade
The composite is a weighted blend of 9 inputs, each scored 0–100. Each bar is that input's sub-score; the figure is the points it added to the 100-point composite (weight × sub-score).
- Cash flow +12.4/30.0
- ARV discount +8.1/15.0
- Schools +4.0/10.0
- Rent growth +3.8/5.0
- DSCR +3.7/10.0
- 1% rule +3.4/10.0
- Livability +3.3/5.0
- Condition / age +2.5/5.0
- Appreciation +0.0/10.0
$233,000
🖨 Deal sheet (PDF) 📄 Offer letter ✓ Due diligence
Listing remarks MLS
***SELLER OFFERING $5,000.00 TOWARDS BUYER'S CLOSING COST*** Located in the heart of Granbury with easy access to Hwy 377! Exterior of home features a nice size front yard and extra large back yard without backyard neighbors! Interior has nice large open living room, breakfast area, open kitchen with newer appliances and existing refrigerator. Split bedrooms all with large walk in closets. Separate large utility room. Lake and boat ramp are less than two miles away. If you're looking for a great home centrally located in the city with recent updates and improvements then come see this house.
Key facts
- Open living room
- Newer appliances
- Walk in closets
Tags
Neighborhood map
What this means for you Summary
Snapshot
- This is a 3-bed/2.0-bath single-family listed at $233k.
Deal economics
- At list price, monthly cash flow is $-39 ($-472/yr) — negative.
- To cash-flow at today's rent, offer at most $226k (3.0% below list).
- To meet the 1% rule (rent ≥ 1% of price), the offer needs to be $196k (15.8% below list).
- Recommended offer: $196k (15.8% below list) — sets the bar for 1% rule.
- Cap rate 6.1% vs local median 3.8% in Granbury — top-decile yield for the area; either an underpriced asset or a hidden risk that comps aren't pricing in. Stress-test before assuming the spread holds.
Location & tenants
- Location reads 66/100 on livability (#628 in TX) — a middle-class / working-renter tenant base. Strengths: cost of living A+, housing A+, health & safety A+; Watch: employment C-, crime D+, amenities F.
- Granbury ISD (town): math 46% / reading 46% proficiency, ranked #237 of 826 in TX (top 29%) — families likely to look elsewhere, expect single-tenant / working-renter base with shorter leases.
- Zoned schools: John And Lynn Brawner El (math 45% / reading 41%, grade F, #1,283 of 4,322 statewide, top 30%, 798 students, 70% FRL); Granbury Middle (math 35% / reading 40%, grade F, #736 of 1,662 statewide, top 45%, 846 students, 68% FRL); Granbury H S (math 38% / reading 51%, grade F, #652 of 1,632 statewide, top 43%, 2,202 students, 46% FRL) — zoned schools average 61% FRL vs 43% district-wide (18 pts higher); higher-poverty schools than district average — tighter screening recommended.
- Market conditions: Rents rising fast (+5.2%/yr); 701 active listings in the ZIP; 16 comparable units currently listed for rent nearby; rentals lingering (median 46d on market — plan ~5-8 weeks vacancy on turnover, expect pricing pressure); 50% of comp listings sitting > 30 days — soft ceiling on asking rent; solid renter incomes; 125 units permitted in Hood County in 2024 (0 in 5+ unit buildings).
Forward outlook
- Local home prices are declining (-3.0%/yr); year-one equity from $2k of loan paydown is wiped out by about $7k of value loss. Plan a longer hold.
- Hood County population projected at +29% by 2050 — long-run rental-demand tailwind backs the buy-and-hold thesis.
Negotiation context
- It's been on market 112 days — a 9% lower offer ($212k) is reasonable based on typical stale-listing flexibility.
- 5 sale attempts since 18y ago with the ask held roughly flat each time — persistent listings suggest the price (not the market) is what's stuck; bring a comps-based counter.
Risks & watch-outs
- Climate carrying-cost: major wind risk, 27% chance of damaging wind over 30y; moderate wildfire risk; extreme-heat days projected 7→23/yr by 2055 (HVAC capex compounding) — expect insurance premiums to compound above CPI over the hold.
Questions for the listing agent
- What do current leases actually rent for vs. the listed asking? Can we see a recent rent roll and the last 12 months of T-12 income?
- It's been on market 112 days. Have you received any prior offers? Is the seller open to a 16% concession, seller financing, or rate buy-down credit?
- What does the HOA fee cover, when was the last increase, and are there any pending special assessments or reserve-fund shortfalls?
- Why hasn't it sold? Are there any deal-killer items the seller is aware of (foundation, flood, title, zoning, code violations)?
- Is there a deadline driving the sale (1031 exchange, divorce, estate, relocation)? That informs how much negotiation room exists.
- Schools are D-rated, which usually means shorter tenancies and higher turnover. Who's the typical renter profile here, and what's been the actual vacancy rate?
- Crime grade is D in this area — have there been break-ins, vandalism, or insurance claims at this property in the last 3 years? What carrier currently insures it and at what premium?
- The area grade is low — what's the realistic commute time and amenity access for the typical tenant pool here? Any planned neighborhood developments (good or bad) we should know about?
- What's the average days-on-market for RENTAL listings here right now (not sales)? A rising rental-DOM trend means longer vacancies and softer asking-rent achievability than the comps imply.
- What's the recent tenant-quality profile in this submarket — average credit score on applications, eviction rate, late-payment / NSF rate, and stable-employment percentage? A property-management company in the area should have these aggregated.
- How much new for-sale + rental construction is in the pipeline within 1–3 miles? Heavy new supply typically softens prices + rents 12–24 months out; constrained supply supports both.
Investment metrics
- 1% rule
- 0.84% ✗
- Cap rate
- 6.09%
- Cash-on-cash
- -0.72%
- DSCR
- 0.97
- GRM
- 9.9
CMA / ARV
- ARV (median comp)
- $236,047
- List price
- $233,000
- Delta
- -1.29%
- Verdict
- FAIR
- Comps
- 20 within 1.0 mi
Show comp detail 12 sales within ~0.75 mi
| Address | Dist | Beds/Ba | Sqft | Sold | Price | $/sf | Match |
|---|---|---|---|---|---|---|---|
| 1830 Hitching Post Rd | 0.27mi | 3/2.0 | 1,452 (+1%) | 2mo | $234,900 | $162 | 84 |
| 615 Whisperview Cir | 0.23mi | 4/2.0 (+1) | 1,525 (+6%) | 0mo | $234,900 | $154 | 74 |
| 1818 Boot Hill Rd | 0.36mi | 2/2.0 (-1) | 1,488 (+3%) | 6mo | $219,000 | $147 | 67 |
| 1710 Broken Bow Rd | 0.56mi | 3/2.0 | 1,400 (-3%) | 2mo | $249,000 | $178 | 67 |
| 1009 Mustang Trl | 0.68mi | 3/2.0 | 1,450 (+1%) | 2mo | $235,900 | $163 | 66 |
| 1712 Boot Hill Rd | 0.46mi | 3/2.0 | 1,292 (-10%) | 3mo | $254,900 | $197 | 59 |
| 814 Branding Iron Trl | 0.30mi | 2/2.0 (-1) | 1,309 (-9%) | 9mo | $219,000 | $167 | 59 |
| 1014 Teresa Ct | 0.74mi | 3/2.0 | 1,382 (-4%) | 0mo | $254,900 | $184 | 58 |
| 1714 Broken Bow Rd | 0.56mi | 3/2.0 | 1,292 (-10%) | 4mo | $254,900 | $197 | 53 |
| 1013 Teresa Ct | 0.71mi | 2/2.0 (-1) | 1,519 (+6%) | 8mo | $235,000 | $155 | 46 |
| 1701 Smokehouse Rd | 0.41mi | 3/1.5 | 1,225 (-15%) | 11mo | $195,000 | $159 | 45 |
| 1008 Mustang Trl | 0.69mi | 3/2.0 | 1,230 (-15%) | 11mo | $247,000 | $201 | 35 |
Match score weights: distance 35% · size 25% · config 20% · recency 20%. Top-matched comps best support the ARV.
Projected returns pro-forma
-3.0% appreciation · 5.2% rent growth · sell at horizon
- IRR
- -15.1%
- Equity multiple
- 0.45×
- Total profit
- $-35,802
- Equity at exit
- $34,741
- IRR
- -3.2%
- Equity multiple
- 0.77×
- Total profit
- $-15,271
- Equity at exit
- $20,146
Cash invested: $65,240 (down + closing). Projections, not guarantees.
Landlord ↔ Tenant lean methodology
- Overall (STATE)
- 87 Strongly Landlord-Friendly
- State Texas
- 87 Strongly Landlord-Friendly · R+5
- County
- — inherits STATE
- City
- — inherits STATE
ZIP-level market 76049
- Home prices YoY
- -26.8%
- Rents YoY
- 5.2%
- Active inventory
- 701
- Price-to-rent
- 9.9×
Monthly cashflow live
- Estimated rent
- $1,963 high interval (Pro) →
- Mortgage (P&I)
- −$1,222
- Tax from tax record
- −$270 /mo · $3,239/yr
- Insurance
- −$97
- HOA
- −$1
- Vacancy / Maint / Mgmt
- −$412
- Net cashflow
- $-39
Break-even live
Sensitivity live
| Price | -10% $93 | -5% $27 | +0% $-39 | +5% $-105 | +10% $-171 |
|---|---|---|---|---|---|
| Rent | -10% $-194 | -5% $-117 | +0% $-39 | +5% $38 | +10% $116 |
| Rate | -1.0pp $78 | -0.5pp $20 | base $-39 | +0.5pp $-100 | +1.0pp $-161 |
UW: 25.0% down · 7.5% · 30yr · 1.5% tax · 5.0% vac · 8.0% maint · 8.0% mgmt
Financing live
Cash to close
- Down payment
- $58,250
- Closing costs
- $6,990
- Reserves months
- —
- Total cash needed
- —
Loan-product check · same deal, 3 products live
Conventional
25% down · 7.5% · 30yr
- Down + closing
- —
- Monthly P&I
- —
- Monthly cashflow
- —
- DSCR
- —
- Eligible?
- —
Personal DTI + credit; lowest rate.
DSCR
20% down · 8.5% · 30yr
- Down + closing
- —
- Monthly P&I
- —
- Monthly cashflow
- —
- DSCR
- —
- Eligible?
- —
No personal income docs; deal must DSCR.
Hard money
10% down · 12.0% · 12mo
- Down + closing
- —
- Monthly P&I
- —
- Monthly cashflow
- —
- DSCR
- —
- Eligible?
- —
Short-term bridge; refi at stabilization.
Rent comps 16 comps
| Address | Beds | Baths | Sqft | Rent | $/sqft | DOM | Units | Dist |
|---|---|---|---|---|---|---|---|---|
| 805 Branding Iron Trl Granbury, TX | 3.0 | 2.0 | 1287 | $1,950 | $1.52 | 45d | 1 | 0.23mi |
| 807 Branding Iron Trl Granbury, TX | 3.0 | 2.0 | 1287 | $1,950 | $1.52 | 45d | 1 | 0.24mi |
| 809 Branding Iron Trl Granbury, TX | 3.0 | 2.0 | 1414 | $2,050 | $1.45 | 45d | 1 | 0.25mi |
| 811 Branding Iron Trl Granbury, TX | 3.0 | 2.0 | 1414 | $2,050 | $1.45 | 45d | 1 | 0.26mi |
| 1713 Bronco Rd Granbury, TX | 4.0 | 2.5 | 1520 | $1,800 | $1.18 | 9d | 1 | 0.28mi |
| 1627 Summerhill Ct Granbury, TX | 2.0 | 2.0 | 1050 | $1,450 | $1.38 | 45d | 1 | 0.51mi |
| 1525 E 2nd St Granbury, TX | 2.0 | 2.0 | 889 | $1,150 | $1.29 | 9d | 1 | 0.60mi |
| 1010 Teresa Ct Granbury, TX | 2.0 | 2.0 | 1205 | $1,600 | $1.33 | 26d | 1 | 0.76mi |
| 1010 Dawn Ct Granbury, TX | 2.0 | 2.0 | 1080 | $1,750 | $1.62 | 45d | 1 | 0.80mi |
| 1017 Meadowlark Ln Granbury, TX | 3.0 | 2.0 | 1725 | $2,300 | $1.33 | 14d | 1 | 1.00mi |
| 3142 Shady Grove Cir Granbury, TX | 3.0 | 2.0 | 1450 | $1,950 | $1.34 | 26d | 1 | 1.01mi |
| 1111 Dove Hollow Rd Granbury, TX | 3.0 | 2.0 | 1789 | $2,399 | $1.34 | 45d | 1 | 1.03mi |
| 1220 Crawford Ct Granbury, TX | 1.0–2.0 | 1.0–2.0 | 968 | $1,739 | $1.80 | 0d | 14 | 1.07mi |
| 306 Shady Grove Dr Unit 103 Granbury, TX | 2.0 | 2.0 | 1000 | $1,300 | $1.30 | 45d | 1 | 1.20mi |
| 800 Chanel Dr Granbury, TX | 1.0–2.0 | 1.0–2.0 | 1029 | $1,948 | $1.89 | 0d | 11 | 1.28mi |
| 1000 Quiet Cv Granbury, TX | 1.0–2.0 | 1.0–2.0 | 841 | $1,700 | $2.02 | 0d | 30 | 1.30mi |
HOA detail
- Monthly dues
- $1 · $12/yr
Listing history 42 events
-
2026-06-21days on market $233,000 Active 112 DOM
-
2026-06-18days on market $233,000 Active 109 DOM
-
2026-06-17days on market $233,000 Active 108 DOM
-
2026-06-16days on market $233,000 Active 107 DOM
-
2026-06-15days on market $233,000 Active 106 DOM
-
2026-06-13days on market $233,000 Active 104 DOM
-
2026-06-10price $233,000 Active 100 DOM
-
2026-06-09days on market $235,000 Active 100 DOM
-
2026-06-08days on market $235,000 Active 99 DOM
-
2026-06-07days on market $235,000 Active 98 DOM
-
2026-06-04days on market $235,000 Active 95 DOM
-
2026-06-03days on market $235,000 Active 94 DOM
-
2026-06-02days on market $235,000 Active 93 DOM
-
2026-06-02days on market $235,000 Active 92 DOM
-
2026-05-31days on market $235,000 Active 91 DOM
-
2026-04-16price $239,000 599-char remark
Show marketing remark (599 chars)
***SELLER OFFERING $5,000.00 TOWARDS BUYER'S CLOSING COST*** Located in the heart of Granbury with easy access to Hwy 377! Exterior of home features a nice size front yard and extra large back yard without backyard neighbors! Interior has nice large open living room, breakfast area, open kitchen with newer appliances and existing refrigerator. Split bedrooms all with large walk in closets. Separate large utility room. Lake and boat ramp are less than two miles away. If you're looking for a great home centrally located in the city with recent updates and improvements then come see this house.
-
2026-04-05price $240,000 599-char remark
Show marketing remark (599 chars)
***SELLER OFFERING $5,000.00 TOWARDS BUYER'S CLOSING COST*** Located in the heart of Granbury with easy access to Hwy 377! Exterior of home features a nice size front yard and extra large back yard without backyard neighbors! Interior has nice large open living room, breakfast area, open kitchen with newer appliances and existing refrigerator. Split bedrooms all with large walk in closets. Separate large utility room. Lake and boat ramp are less than two miles away. If you're looking for a great home centrally located in the city with recent updates and improvements then come see this house.
-
2026-03-24price $242,000 599-char remark
Show marketing remark (599 chars)
***SELLER OFFERING $5,000.00 TOWARDS BUYER'S CLOSING COST*** Located in the heart of Granbury with easy access to Hwy 377! Exterior of home features a nice size front yard and extra large back yard without backyard neighbors! Interior has nice large open living room, breakfast area, open kitchen with newer appliances and existing refrigerator. Split bedrooms all with large walk in closets. Separate large utility room. Lake and boat ramp are less than two miles away. If you're looking for a great home centrally located in the city with recent updates and improvements then come see this house.
-
2026-03-16price $243,000 599-char remark
Show marketing remark (599 chars)
***SELLER OFFERING $5,000.00 TOWARDS BUYER'S CLOSING COST*** Located in the heart of Granbury with easy access to Hwy 377! Exterior of home features a nice size front yard and extra large back yard without backyard neighbors! Interior has nice large open living room, breakfast area, open kitchen with newer appliances and existing refrigerator. Split bedrooms all with large walk in closets. Separate large utility room. Lake and boat ramp are less than two miles away. If you're looking for a great home centrally located in the city with recent updates and improvements then come see this house.
-
2026-03-01$245,000 Active 599-char remark
Show marketing remark (599 chars)
***SELLER OFFERING $5,000.00 TOWARDS BUYER'S CLOSING COST*** Located in the heart of Granbury with easy access to Hwy 377! Exterior of home features a nice size front yard and extra large back yard without backyard neighbors! Interior has nice large open living room, breakfast area, open kitchen with newer appliances and existing refrigerator. Split bedrooms all with large walk in closets. Separate large utility room. Lake and boat ramp are less than two miles away. If you're looking for a great home centrally located in the city with recent updates and improvements then come see this house.
-
2025-06-30historical
-
2025-06-06price $269,999
-
2025-05-02price $270,000
-
2025-04-07price $275,000
-
2025-03-22price $280,000
-
2025-03-03price $290,000
-
2025-02-05$295,000 Active
-
2020-11-09soldstatus
-
2020-10-27soldstatus Sold
-
2020-10-09status Pending
-
2020-10-02historical Active Option Contract
-
2020-09-20$194,900 Active
-
2009-06-08soldstatus
-
2009-06-05soldstatus
-
2009-05-07historical
-
2009-04-30$100,000
-
2008-03-27soldstatus
-
2008-03-27soldstatus
-
2008-03-14historical
-
2008-01-30$86,900
-
1996-10-18soldstatus
-
1989-10-02soldstatus
ⓘ Source: listings_history table (triggers on properties + properties_extension) + one-shot
backfill from property_details.listing_events for pre-trigger history.
Tax reassessment forecast TX · Resets to sale price
- Current annual tax
- $3,239 · $270/mo
- Projected year-2 tax
- $4,264 · $355/mo
- Expected delta
- +$1,025/yr (+$85/mo · 31.7%)
ⓘ Screening estimate from a state-policy table — verify with the county assessor before closing.
Climate risk First Street
- Flood 1/10 Low FEMA zone X (unshaded) · 0% chance over 30 yrs
- Wildfire 5/10 Major
- Heat 7/10 Severe 7 d/yr ≥108°F today · 23 d/yr by 30 yrs out
- Wind 6/10 Major 27% chance of damaging wind over 30 yrs
- Air quality 2/10 Low 1 unhealthy d/yr today · 2 by 30 yrs out
Nearby sold comps map
Loading sold comps map…
Walkable amenities ~0.75 mi
Loading nearby amenities…
Taxation est. · year 1
- Rental income
- $23,553
- − Mortgage interest
- −$13,052
- − Property taxes
- −$3,239
- − Insurance
- −$1,165
- − Repairs & maintenance
- −$1,884
- − Management
- −$1,884
- − HOA
- −$12
- − Depreciation
- −$6,778
- Taxable loss
- −$4,461
- Est. tax savings @ 24.0%
- +$1,071
- After-tax cash flow
- $599/yr
For passive investors: Depreciation is non-cash, so a rental often shows a tax loss while cash-flowing — sheltering income. Rental losses are passive: they offset passive income freely, and up to $25,000/yr can offset ordinary (W-2) income if you actively participate and your MAGI is under $100k (phasing out to $0 by $150k); unused losses carry forward. On sale, claimed depreciation is recaptured at up to 25%, and gains may owe capital-gains tax (a 1031 exchange can defer both). Figures are a year-1 estimate at your 24.0% rate — not tax advice; consult a CPA.
Schools (NCES district)
- District
- Granbury ISD
- NCES district ID
- 4821390
- Math proficiency
- 46% ▬ 0.00%
- Reading proficiency
- 46% ▲ 4.00%
- Median HH income
- $55,856
- Composite
- 40.04/100
- National rank
- #3820
- State rank
- #237 of 826 in TX
Livability — Granbury
- Score
- 66/100
- State rank
- #628
- US rank
- #11998
Category grades
Schools grade is shown separately in the Schools card above.
Census & demographics
- County
- Hood County · 58,506 people
- City population
- 58,506
- Metro
- Granbury, TX
- Population (ZIP)
- 31,506
- Household income
- $104,967
- Rent vs Own
- Severe rent burden
- 235.0
Population outlook (Hood County) Hauer SSP2
- Today (2025)
- 63,502 people
- By 2030
- 67,459 · +6.2%
- By 2040
- 74,958 · +18.0%
- By 2050
- 81,922 · +29.0%
- By 2075
- 98,872 · +55.7%
- By 2100
- 107,796 · +69.8%
Race, ethnicity, and origin ACS 2023
- Neighborhood character
- Predominantly White (82%)
- Race & ethnicity
- White 82% Hispanic / Latino 14% Two or more races 9%
- Hispanic origin (detail)
- Mexican 11%
- Common ancestry
- Slovak 3% Serbian 2% Italian 2%
- Foreign-born
- 5% · Canada
- Languages at home
- 91% English-only · Spanish 8%
Political lean MEDSL · Hood
- 2024 margin
- Solid R (+66.0) · D 16.6% · R 82.6%
- 2008→2024 swing
- -11.9pp toward R · 2008: -54.0pp · 2024: -66.0pp
- All cycles
- 2024: R+66.0 2020: R+64.1 2016: R+66.5 2012: R+64.7 2008: R+54.0
Not yet ingested
- Civics
- —
Market trends
- HPI YoY
- ▼ -100.09%
- Current HPI
- 273.1293
- Rent YoY
- ▲ 5.20%
- Metro
- Granbury, TX
- State GDP YoY
- ▲ 3.95%
- F500 in state
- 110
Industry mix (Fortune 500 HQ in TX)
| Industry | F500 HQs | Revenue |
|---|---|---|
| Energy | 16 | $1,198B |
|
||
| Technology | 5 | $198B |
|
||
| Engineering / Construction | 4 | $72B |
|
||
| Energy Services | 3 | $60B |
|
||
| Utilities | 3 | $41B |
|
||
| Healthcare | 2 | $330B |
|
||
Price history
+175.0% since first listed27 events — show timeline
- 2026-04-16 Price Changed $239,000 NTREIS
- 2026-04-05 Price Changed $240,000 NTREIS
- 2026-03-24 Price Changed $242,000 NTREIS
- 2026-03-16 Price Changed $243,000 NTREIS
- 2026-03-01 Listed $245,000 NTREIS
- 2025-06-30 Listing Removed — NTREIS
- 2025-06-06 Price Changed $269,999 NTREIS
- 2025-05-02 Price Changed $270,000 NTREIS
- 2025-04-07 Price Changed $275,000 NTREIS
- 2025-03-22 Price Changed $280,000 NTREIS
- 2025-03-03 Price Changed $290,000 NTREIS
- 2025-02-05 Listed $295,000 NTREIS
- 2020-11-09 Sold (Public Records) — Public Records
- 2020-10-27 Sold (MLS) — NTREIS
- 2020-10-09 Pending — NTREIS
- 2020-10-02 Contingent — NTREIS
- 2020-09-20 Listed $194,900 NTREIS
- 2009-06-08 Sold (Public Records) — Public Records
- 2009-06-05 Sold (MLS) — NTREIS
- 2009-05-07 Listing Removed — NTREIS
- 2009-04-30 Listed $100,000 NTREIS
- 2008-03-27 Sold (Public Records) — Public Records
- 2008-03-27 Sold (MLS) — NTREIS
- 2008-03-14 Listing Removed — NTREIS
- 2008-01-30 Listed $86,900 NTREIS
- 1996-10-18 Sold (Public Records) — Public Records
- 1989-10-02 Sold (Public Records) — Public Records
Property tax history
+4.9%/yrLatest (2025): $3,239 · +10.9% YoY. Source: county tax records.
Cash-flow waterfall
monthlySold comps — $/sqft
last 12 mo · ≤1 miLoading sold comps…