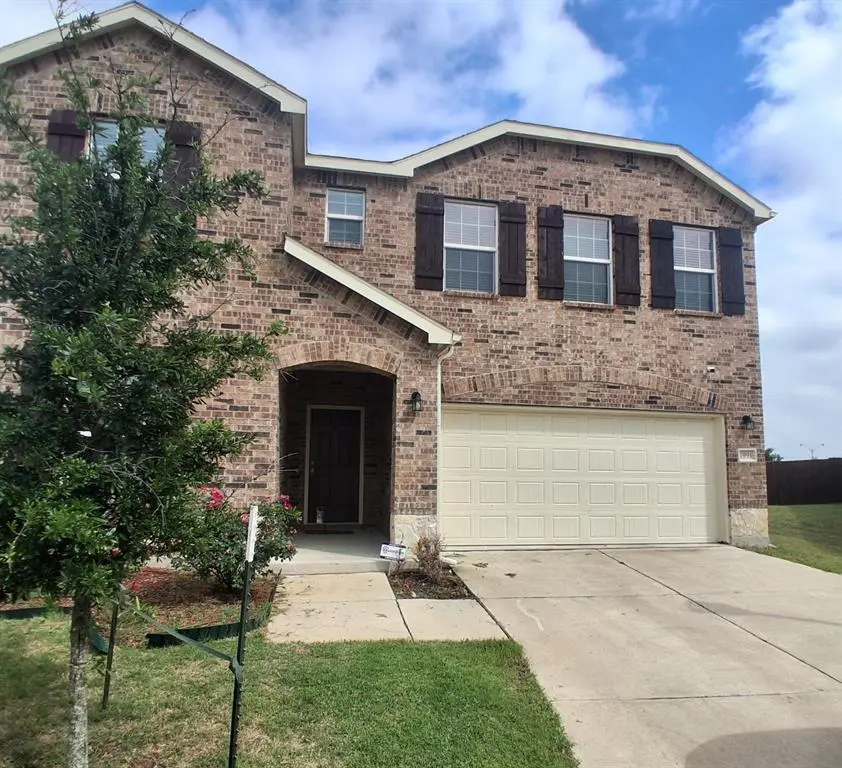
1991 Oriole Ct · Princeton, TX
Flood risk 1/10 · Minimal
- FEMA flood zone
- X (unshaded)
- Chance of flooding over 30 yrs
- 0.0%
- Est. flood insurance / yr
- $507 – $1,088
Fire risk 5/10 · Moderate
- Est. fire insurance / yr
- $1,222 – $2,270
Heat risk 7/10 · Major
- Hot days now (above 110°F)
- 7 days/yr
- Hot days in 30 yrs
- 22 days/yr
Wind risk 6/10 · Moderate
- Chance of severe wind over 30 yrs
- 27.0%
Air-quality risk 3/10 · Minor
- Unhealthy air days now
- 3 days/yr
- Unhealthy air days in 30 yrs
- 3 days/yr
Risk factors via First Street. Map © Google.
Why this score? — see what drove the D grade
The composite is a weighted blend of 9 inputs, each scored 0–100. Each bar is that input's sub-score; the figure is the points it added to the 100-point composite (weight × sub-score).
- ARV discount +15.0/15.0
- Cash flow +7.0/30.0
- Schools +4.2/10.0
- Condition / age +4.0/5.0
- 1% rule +3.3/10.0
- Livability +3.1/5.0
- Rent growth +2.2/5.0
- DSCR +1.2/10.0
- Appreciation +0.0/10.0
$295,000
🖨 Deal sheet 📄 Offer letter ✓ Due diligence
Listing remarks
Great neighborhood! 5-bedroom brick home with 3 full bathrooms. 2 living areas. Quiet Cul-de-sac street. Two story design with a game room, full bath and 3 bedrooms upstairs and the primary suite and additional bedroom downstairs. Open floorplan living, dining and kitchen area with an island breakfast bar and pantry. Great location in Princeton Tx. Great community amenities including a pool and playground. Enjoy the suburb life with only a short drive to the metroplex amenities. Sold AS-IS.
Key facts
- Community amenities
- Island breakfast bar
- Two story design
Tags
Property features AI
Finance
- Other: Special listing conditions: Real Estate Owned
- Financial info: Semi-annual HOA fee of 515
- HOA & community: Mandatory association managed by Essex; Association provides full use of facilities; Semi-annual association fee
Exterior
- Parking: 2 covered parking spaces; 2-car attached garage; Driveway; garage faces front
- Utilities: City water; City sewer; Not in a municipal utility district
- Home design: Single family residence; Residential property; Two-story; Preowned (built in 2022)
- Construction: Brick construction; Composition roof; Slab foundation; Built in 2022
- Exterior features: Lot less than 0.5 acre; Subdivision: Whitewing Trails Ph 1
Interior
- Kitchen: Dishwasher; Electric range; Microwave
- Bedrooms: 5 bedrooms (primary bedroom on level 1; other bedrooms on levels 1 and 2)
- Flooring: Carpet; Ceramic tile; Laminate
- Bathrooms: 3 full bathrooms
- Heating & cooling: Central heating; Central electric air conditioning
- Interior features: Decorative lighting; Granite counters; Kitchen island; Walk-in closet(s); 13 total rooms; Two-level floorplan; Two living areas; One dining area
- Laundry & utility: Laundry room with washer and electric dryer hookups; Utility room
Neighborhood map
What this means for you Summary
Snapshot
- This is a 5-bed/3.0-bath single-family listed at $295k. Condition is rated good.
Deal economics
- At list price, monthly cash flow is $-433 ($-5k/yr) — negative.
- To cash-flow at today's rent, offer at most $219k (25.9% below list).
- To meet the 1% rule (rent ≥ 1% of price), the offer needs to be $246k (16.8% below list).
- Recommended offer: $219k (25.9% below list) — sets the bar for cash-flow.
Location & tenants
- Location reads 62/100 on livability (#969 in TX) — a middle-class / working-renter tenant base. Strengths: employment A+, housing A+, cost of living A; Watch: amenities F, commute F, health & safety F.
- Princeton ISD (suburban): math 51% / reading 47% proficiency, ranked #188 of 826 in TX (top 23%) — families likely to look elsewhere, expect single-tenant / working-renter base with shorter leases.
- Zoned schools: Lacy El (math 44% / reading 44%, grade F, #1,243 of 4,322 statewide, top 29%, 670 students, 59% FRL) — zoned schools at 59% FRL track the district average.
- Market conditions: Rents soft (-1.0%/yr); 1404 active listings in the ZIP; 40 comparable units currently listed for rent nearby; rentals at typical pace (median 19d on market — plan ~3-4 weeks tenant-placement turnaround); solid renter incomes; 19,194 units permitted in Collin County in 2024 (3,988 in 5+ unit buildings).
Forward outlook
- Local home prices are declining (-3.0%/yr); year-one equity from $2k of loan paydown is wiped out by about $9k of value loss. Plan a longer hold.
- Collin County population projected at +60% by 2050 — long-run rental-demand tailwind backs the buy-and-hold thesis.
Negotiation context
- It's been on market 35 days — a 3% lower offer ($286k) is reasonable based on typical stale-listing flexibility.
Risks & watch-outs
- Watch-outs: property tax is 2.5% of price.
- Climate carrying-cost: major wind risk, 27% chance of damaging wind over 30y; moderate wildfire risk; extreme-heat days projected 7→22/yr by 2055 (HVAC capex compounding) — expect insurance premiums to compound above CPI over the hold.
Questions for the listing agent
- What do current leases actually rent for vs. the listed asking? Can we see a recent rent roll and the last 12 months of T-12 income?
- It's been on market 35 days. Have you received any prior offers? Is the seller open to a 26% concession, seller financing, or rate buy-down credit?
- Property tax is high relative to price — has the assessment been appealed recently, and will the sale trigger a re-assessment?
- What does the HOA fee cover, when was the last increase, and are there any pending special assessments or reserve-fund shortfalls?
- Is there a deadline driving the sale (1031 exchange, divorce, estate, relocation)? That informs how much negotiation room exists.
- The area grade is low — what's the realistic commute time and amenity access for the typical tenant pool here? Any planned neighborhood developments (good or bad) we should know about?
- What's the average days-on-market for RENTAL listings here right now (not sales)? A rising rental-DOM trend means longer vacancies and softer asking-rent achievability than the comps imply.
- What's the recent tenant-quality profile in this submarket — average credit score on applications, eviction rate, late-payment / NSF rate, and stable-employment percentage? A property-management company in the area should have these aggregated.
- How much new for-sale + rental construction is in the pipeline within 1–3 miles? Heavy new supply typically softens prices + rents 12–24 months out; constrained supply supports both.
Investment metrics
- 1% rule
- 0.83% ✗
- Cap rate
- 4.53%
- Cash-on-cash
- -6.29%
- DSCR
- 0.72
- GRM
- 10.0
CMA / ARV
- ARV (median comp)
- $391,538
- List price
- $295,000
- Delta
- -24.66%
- Verdict
- UNDERPRICED
- Comps
- 20 within 1.0 mi
Show comp detail 12 sales within ~0.75 mi
| Address | Dist | Beds/Ba | Sqft | Sold | Price | $/sf | Match |
|---|---|---|---|---|---|---|---|
| 2006 Starling St | 0.20mi | 4/2.5 (-1) | 2,626 (+3%) | 2mo | $412,990 | $157 | 77 |
| 1921 Sandpiper Way | 0.12mi | 5/4.0 | 2,682 (+5%) | 9mo | $404,990 | $151 | 74 |
| 1908 Starling St | 0.16mi | 4/2.5 (-1) | 2,636 (+4%) | 9mo | $419,990 | $159 | 72 |
| 1612 Dove Dr | 0.33mi | 4/2.5 (-1) | 2,626 (+3%) | 1mo | $374,990 | $143 | 72 |
| 809 Indigo Rd | 0.19mi | 4/2.5 (-1) | 2,739 (+8%) | 0mo | $395,000 | $144 | 71 |
| 2019 Blackbird Ln | 0.25mi | 4/3.0 (-1) | 2,448 (-4%) | 9mo | $409,900 | $167 | 69 |
| 2112 Sandpiper Way | 0.22mi | 4/3.0 (-1) | 2,704 (+6%) | 9mo | $414,990 | $153 | 67 |
| 1209 Jasper Xing | 0.60mi | 5/2.5 | 2,598 (+2%) | 4mo | $310,000 | $119 | 63 |
| 2003 Partridge Rd | 0.17mi | 5/3.5 | 2,880 (+13%) | 9mo | $434,990 | $151 | 61 |
| 2013 Partridge Rd | 0.21mi | 5/3.5 | 2,880 (+13%) | 8mo | $444,990 | $155 | 60 |
| 1301 Meadow Creek Dr | 0.71mi | 5/3.5 | 2,312 (-9%) | 8mo | $300,000 | $130 | 43 |
| 2306 Winthrop Ave | 0.70mi | 4/3.0 (-1) | 2,260 (-11%) | 1mo | $284,500 | $126 | 43 |
Match score weights: distance 35% · size 25% · config 20% · recency 20%. Top-matched comps best support the ARV.
Projected returns pro-forma
-3.0% appreciation · 0.0% rent growth · sell at horizon
- IRR
- -31.1%
- Equity multiple
- 0.00×
- Total profit
- $-82,310
- Equity at exit
- $43,985
- IRR
- -59.9%
- Equity multiple
- -0.62×
- Total profit
- $-133,977
- Equity at exit
- $25,506
Cash invested: $82,600 (down + closing). Projections, not guarantees.
Landlord ↔ Tenant lean methodology
- Overall (STATE)
- 87 Strongly Landlord-Friendly
- State Texas
- 87 Strongly Landlord-Friendly · R+5
- County
- — inherits STATE
- City
- — inherits STATE
ZIP-level market 75407
- Home prices YoY
- -30.3%
- Rents YoY
- -1.0%
- Active inventory
- 1404
- Price-to-rent
- 10.0×
Monthly cashflow live
- Estimated rent
- $2,455 high interval (Pro) →
- Mortgage (P&I)
- −$1,547
- Tax from tax record
- −$616 /mo · $7,395/yr
- Insurance
- −$123
- HOA
- −$86
- Vacancy / Maint / Mgmt
- −$516
- Net cashflow
- $-433
Break-even live
UW: 25.0% down · 7.5% · 30yr · 1.5% tax · 5.0% vac · 8.0% maint · 8.0% mgmt
Financing live
Cash to close
- Down payment
- $73,750
- Closing costs
- $8,850
- Reserves months
- —
- Total cash needed
- —
Loan-product check · same deal, 3 products live
Conventional
25% down · 7.5% · 30yr
- Down + closing
- —
- Monthly P&I
- —
- Monthly cashflow
- —
- DSCR
- —
- Eligible?
- —
Personal DTI + credit; lowest rate.
DSCR
20% down · 8.5% · 30yr
- Down + closing
- —
- Monthly P&I
- —
- Monthly cashflow
- —
- DSCR
- —
- Eligible?
- —
No personal income docs; deal must DSCR.
Hard money
10% down · 12.0% · 12mo
- Down + closing
- —
- Monthly P&I
- —
- Monthly cashflow
- —
- DSCR
- —
- Eligible?
- —
Short-term bridge; refi at stabilization.
Rent comps 40 comps
| Address | Beds | Baths | Sqft | Rent | $/sqft | DOM | Units | Dist |
|---|---|---|---|---|---|---|---|---|
| 2107 Camellia St Princeton, TX | 4.0 | 2.0 | 1829 | $2,200 | $1.20 | 12d | 1 | 0.20mi |
| 911 Cormorant St Princeton, TX | 4.0 | 3.0 | 2326 | $2,195 | $0.94 | 18d | 1 | 0.22mi |
| 1655 Ratama Dr Princeton, TX | 4.0 | 2.0 | 1851 | $2,250 | $1.22 | 12d | 1 | 0.22mi |
| 1062 Churchill Dr Princeton, TX | 4.0 | 2.0 | 1901 | $1,889 | $0.99 | 7d | 1 | 0.23mi |
| 1048 Churchill Dr Princeton, TX | 4.0 | 2.0 | 1901 | $1,950 | $1.03 | 43d | 1 | 0.23mi |
| 610 Union Dr Princeton, TX | 4.0 | 2.0 | 1829 | $2,350 | $1.28 | 24d | 1 | 0.27mi |
| 701 Union Dr Princeton, TX | 4.0 | 3.0 | 2673 | $2,370 | $0.89 | 4d | 1 | 0.27mi |
| 1004 Churchill Dr Princeton, TX | 4.0 | 3.0 | 2630 | $2,200 | $0.84 | 12d | 1 | 0.33mi |
| 1107 Caroline Dr Princeton, TX | 4.0 | 2.5 | 2447 | $2,205 | $0.90 | 1d | 1 | 0.35mi |
| 1121 Rainer Dr Princeton, TX | 4.0 | 2.0 | 1892 | $1,950 | $1.03 | 1d | 1 | 0.35mi |
| 1118 Grace Dr Princeton, TX | 4.0 | 2.0 | 1924 | $2,900 | $1.51 | 17d | 1 | 0.36mi |
| 1210 Augustin Dr Princeton, TX | 4.0 | 2.0 | 1760 | $1,750 | $0.99 | 17d | 1 | 0.45mi |
| 808 Marigold St Princeton, TX | 4.0 | 3.0 | 2060 | $2,500 | $1.21 | 43d | 1 | 0.47mi |
| 808 Marigold St Princeton, TX | 4.0 | 3.0 | 2060 | $2,350 | $1.14 | 12d | 1 | 0.47mi |
| 1217 Caroline Dr Princeton, TX | 4.0 | 2.0 | 1948 | $1,975 | $1.01 | 5d | 1 | 0.50mi |
| 1405 Diamond Ct Princeton, TX | 4.0 | 2.0 | 1891 | $1,925 | $1.02 | 43d | 1 | 0.51mi |
| 904 Opal Path Princeton, TX | 4.0 | 2.0 | 1891 | $1,995 | $1.05 | 43d | 1 | 0.51mi |
| 1112 Nickel St Princeton, TX | 5.0 | 3.5 | 2338 | $2,100 | $0.90 | 24d | 1 | 0.53mi |
| 1001 Marigold St Princeton, TX | 4.0 | 3.0 | 2192 | $2,225 | $1.02 | 43d | 1 | 0.57mi |
| 1201 Jasper Xing Princeton, TX | 5.0 | 3.5 | 2338 | $2,500 | $1.07 | 24d | 1 | 0.60mi |
| 1008 Emerald Dr Princeton, TX | 4.0 | 2.5 | 2119 | $2,300 | $1.09 | 43d | 1 | 0.63mi |
| 1009 Riverstone Trl Princeton, TX | 5.0 | 2.0 | 2047 | $2,195 | $1.07 | 10d | 1 | 0.64mi |
| 1302 Meadow Creek Dr Princeton, TX | 4.0 | 2.0 | 1889 | $2,095 | $1.11 | 7d | 1 | 0.67mi |
| 1901 States St Princeton, TX | 4.0 | 3.0 | 2260 | $2,700 | $1.19 | 24d | 1 | 0.69mi |
| 2304 Winthrop Ave Princeton, TX | 5.0 | 3.0 | 2777 | $2,600 | $0.94 | 43d | 1 | 0.71mi |
| 1203 Onyx Ln Princeton, TX | 5.0 | 2.5 | 2602 | $2,900 | $1.11 | 17d | 1 | 0.72mi |
| 311 Pennsylvania Ave Princeton, TX | 4.0 | 3.0 | 2258 | $2,195 | $0.97 | 24d | 1 | 0.72mi |
| 2312 Winthrop Ave Princeton, TX | 5.0 | 3.0 | 2609 | $2,275 | $0.87 | 43d | 1 | 0.72mi |
| 900 Sapphire Dr Princeton, TX | 5.0 | 2.0 | 2046 | $2,300 | $1.12 | 43d | 1 | 0.73mi |
| 811 Emerald Dr Princeton, TX | 4.0 | 2.0 | 2080 | $2,250 | $1.08 | 43d | 1 | 0.76mi |
| 1902 Chapel Hill Rd Princeton, TX | 5.0 | 3.0 | 2616 | $2,295 | $0.88 | 4d | 1 | 0.76mi |
| 2208 Georgetown St Princeton, TX | 5.0 | 2.5 | 2700 | $2,305 | $0.85 | 24d | 1 | 0.77mi |
| 1702 Chapel Hill Rd Princeton, TX | 4.0 | 2.5 | 2121 | $1,995 | $0.94 | 7d | 1 | 0.78mi |
| 1202 Meadow Wood Ct Princeton, TX | 5.0 | 2.0 | 2044 | $2,400 | $1.17 | 4d | 1 | 0.79mi |
| 2206 Pioneer Dr Princeton, TX | 5.0 | 3.0 | 2777 | $2,600 | $0.94 | 43d | 1 | 0.79mi |
| 1809 Chapel Hill Rd Princeton, TX | 4.0 | 2.5 | 2121 | $2,100 | $0.99 | 4d | 1 | 0.80mi |
| 408 Forest St Princeton, TX | 5.0 | 3.5 | 2617 | $2,595 | $0.99 | 2d | 1 | 0.80mi |
| 2004 Hancock Cir Princeton, TX | 4.0 | 3.0 | 2258 | $1,995 | $0.88 | 12d | 1 | 0.81mi |
| 1908 Marquette Dr Princeton, TX | 5.0 | 3.0 | 2609 | $2,150 | $0.82 | 20d | 1 | 0.82mi |
| 2008 Washington St Princeton, TX | 5.0 | 2.5 | 3144 | $2,600 | $0.83 | 43d | 1 | 0.87mi |
HOA detail
- Monthly dues
- $86 · $1,032/yr
- Likely covers
- pool
Listing history 10 events
-
2026-06-13statusdays on market $295,000 Pending 35 DOM
-
2026-06-09days on market $295,000 Active 32 DOM
-
2026-06-08days on market $295,000 Active 31 DOM
-
2026-06-07days on market $295,000 Active 30 DOM
-
2026-06-04days on market $295,000 Active 27 DOM
-
2026-06-03days on market $295,000 Active 26 DOM
-
2026-06-02days on market $295,000 Active 25 DOM
-
2026-06-01days on market $295,000 Active 24 DOM
-
2026-05-31days on market $295,000 Active 23 DOM
-
2026-05-06$295,000 Active 496-char remark
ⓘ Source: listings_history table (triggers on properties + properties_extension) + one-shot
backfill from property_details.listing_events for pre-trigger history.
Tax reassessment forecast TX · Resets to sale price
- Current annual tax
- $7,395 · $616/mo
- Projected year-2 tax
- $7,395 · $616/mo
- Expected delta
- $0/yr ($0/mo · 0.0%)
ⓘ Screening estimate from a state-policy table — verify with the county assessor before closing.
Climate risk First Street
- Flood 1/10 Low FEMA zone X (unshaded) · 0% chance over 30 yrs
- Wildfire 5/10 Major
- Heat 7/10 Severe 7 d/yr ≥110°F today · 22 d/yr by 30 yrs out
- Wind 6/10 Major 27% chance of damaging wind over 30 yrs
- Air quality 3/10 Moderate 3 unhealthy d/yr today · 3 by 30 yrs out
Nearby sold comps map
Loading sold comps map…
Walkable amenities ~0.75 mi
Loading nearby amenities…
Taxation est. · year 1
- Rental income
- $29,461
- − Mortgage interest
- −$16,525
- − Property taxes
- −$7,395
- − Insurance
- −$1,475
- − Repairs & maintenance
- −$2,357
- − Management
- −$2,357
- − HOA
- −$1,032
- − Depreciation
- −$8,582
- Taxable loss
- −$10,261
- Est. tax savings @ 24.0%
- +$2,463
- After-tax cash flow
- $-2,729/yr
For passive investors: Depreciation is non-cash, so a rental often shows a tax loss while cash-flowing — sheltering income. Rental losses are passive: they offset passive income freely, and up to $25,000/yr can offset ordinary (W-2) income if you actively participate and your MAGI is under $100k (phasing out to $0 by $150k); unused losses carry forward. On sale, claimed depreciation is recaptured at up to 25%, and gains may owe capital-gains tax (a 1031 exchange can defer both). Figures are a year-1 estimate at your 24.0% rate — not tax advice; consult a CPA.
Condition & rehab AI · 12 photos
This well-maintained, two-story home in a desirable neighborhood offers a good investment opportunity with potential for modest improvements to enhance its value.
Value-add opportunities
- Both Paint interior walls — Fresh paint can enhance curb appeal and interior aesthetics
- Both Replace countertops — Modern countertops can increase both resale and rental value
- Both Install smart home devices — Smart home devices can improve convenience and energy efficiency, attracting more buyers and renters
Renovation cost estimate screening
Value-add ROI direction
- Both Paint interior walls — Fresh paint can enhance curb appeal and interior aesthetics ↑
- Both Replace countertops — Modern countertops can increase both resale and rental value ↑
- Both Install smart home devices — Smart home devices can improve convenience and energy efficiency, attracting more buyers and renters ↑
ⓘ Cost ranges are severity-bucket heuristics (US national rule-of-thumb). Get contractor quotes + a written scope before underwriting a rehab budget.
Schools (NCES district)
- District
- Princeton ISD
- NCES district ID
- 4835850
- Math proficiency
- 51% ▼ -8.00%
- Reading proficiency
- 47% ▬ 0.00%
- Median HH income
- $54,827
- Composite
- 42.44/100
- National rank
- #3226
- State rank
- #188 of 826 in TX
Livability — Princeton
- Score
- 62/100
- State rank
- #969
- US rank
- #17215
Category grades
Schools grade is shown separately in the Schools card above.
Census & demographics
- Census place
- Princeton, TX
- County
- Collin County · 1,159,394 people
- City population
- 34,171
- Metro
- Dallas-Fort Worth-Arlington, TX
- Population (ZIP)
- 34,171
- Household income
- $100,037
- Rent vs Own
- Severe rent burden
- 368.0
Population outlook (Collin County) Hauer SSP2
- Today (2025)
- 1,210,074 people
- By 2030
- 1,358,201 · +12.2%
- By 2040
- 1,654,061 · +36.7%
- By 2050
- 1,937,359 · +60.1%
- By 2075
- 2,567,039 · +112.1%
- By 2100
- 2,952,048 · +144.0%
Race, ethnicity, and origin ACS 2023
- Neighborhood character
- Diverse neighborhood (Simpson 0.66)
- Race & ethnicity
- White 47% Hispanic / Latino 30% Black 17% Two or more races 10% Asian 4% Native American 1%
- Hispanic origin (detail)
- Mexican 26%
- Common ancestry
- Lithuanian 2% Romanian 1% Russian 1%
- Foreign-born
- 15% · Canada, China, Mexico
- Languages at home
- 70% English-only · Spanish 22% Other Indo-European 2% Other Asian/Pacific 1%
Political lean MEDSL · Collin
- 2024 margin
- R (+11.1) · D 43.1% · R 54.3% · Other 2.6%
- 2008→2024 swing
- +14.4pp toward D · 2008: -25.6pp · 2024: -11.1pp
- All cycles
- 2024: R+11.1 2020: R+4.3 2016: R+17.0 2012: R+31.6 2008: R+25.6
Not yet ingested
- Civics
- —
Market trends
- HPI YoY
- ▼ -103.99%
- Current HPI
- 238.9373
- Rent YoY
- ▼ -1.02%
- Metro
- Dallas-Fort Worth-Arlington, TX
- State GDP YoY
- ▲ 3.95%
- F500 in state
- 110
Industry mix (Fortune 500 HQ in TX)
| Industry | F500 HQs | Revenue |
|---|---|---|
| Energy | 16 | $1,198B |
|
||
| Technology | 5 | $198B |
|
||
| Engineering / Construction | 4 | $72B |
|
||
| Energy Services | 3 | $60B |
|
||
| Utilities | 3 | $41B |
|
||
| Healthcare | 2 | $330B |
|
||
Price history
3 events — show timeline
- 2026-06-12 Pending — NTREIS
- 2026-06-10 Contingent — NTREIS
- 2026-05-06 Listed $295,000 NTREIS
Property tax history
+66.5%/yrLatest (2025): $7,395 · -9.0% YoY. Source: county tax records.
Cash-flow waterfall
monthlySold comps — $/sqft
last 12 mo · ≤1 miLoading sold comps…