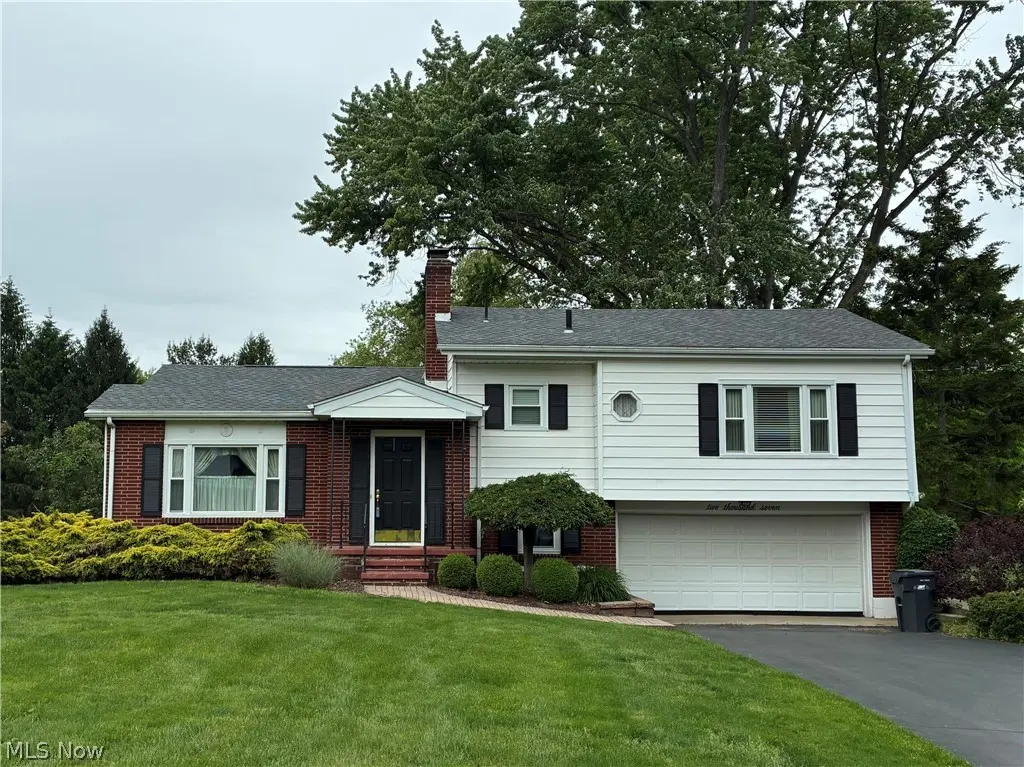
2007 Silver Fox Ln · Howland Center, OH
Flood risk 1/10 · Minimal
- FEMA flood zone
- X (unshaded)
- Chance of flooding over 30 yrs
- 0.0%
- Est. flood insurance / yr
- $473 – $860
Fire risk 1/10 · Minimal
- Est. fire insurance / yr
- $713 – $1,323
Heat risk 2/10 · Minimal
- Hot days now (above 96°F)
- 7 days/yr
- Hot days in 30 yrs
- 16 days/yr
Wind risk 1/10 · Minimal
- Chance of severe wind over 30 yrs
- —
Air-quality risk 3/10 · Minor
- Unhealthy air days now
- 2 days/yr
- Unhealthy air days in 30 yrs
- 5 days/yr
Risk factors via First Street. Map © Google.
Why this score? — see what drove the C+ grade
The composite is a weighted blend of 9 inputs, each scored 0–100. Each bar is that input's sub-score; the figure is the points it added to the 100-point composite (weight × sub-score).
- Cash flow +20.4/30.0
- ARV discount +15.0/15.0
- DSCR +6.5/10.0
- Schools +5.3/10.0
- 1% rule +5.0/10.0
- Livability +3.8/5.0
- Rent growth +2.5/5.0
- Condition / age +2.5/5.0
- Appreciation +0.0/10.0
$229,900
🖨 Deal sheet (PDF) 📄 Offer letter ✓ Due diligence
Listing remarks
Nestled in a charming Howland township neighborhood on a generous 0.84-acre lot, this lovely 3-bedroom, 1.5-bath split-level offers a comfortable and functional layout with spacious living and entertaining areas. The main level features a bright and inviting living room along with an additional family room off the back, each complete with its own fireplace, creating warm and comfortable gathering spaces throughout. The dining area flows nicely into the kitchen, which offers an abundance of cabinetry and storage space. Upstairs, you'll find three nice-sized bedrooms, including a convenient half-bath off the primary bedroom, plus a full bathroom in the hall. The lower level features a dedicat
Key facts
- Bright living room
- Family room
- Split level home
Tags
Property features AI
Exterior
- Parking: Attached garage with automatic garage door opener; 2-car garage
- Utilities: Public water; Public sewer
- Home design: Two-story home; Vinyl siding; Asphalt roof
- Construction: Built (year per public records); Vinyl siding construction; Asphalt roof
- Exterior features: Enclosed porch; Patio; Shed(s)
Interior
- Kitchen: Kitchen on first floor (14 x 8); Range; Microwave; Dishwasher; Refrigerator
- Bedrooms: Bedroom on second floor (12 x 10, carpet); Bedroom on second floor (13 x 10, carpet); Primary/large bedroom on second floor with half bathroom (16 x 10, carpet)
- Flooring: Carpet in main living areas and bedrooms; Tile in laundry room
- Bathrooms: 1 full bathroom; 1 half bathroom
- Heating & cooling: Forced air heating (gas); Central air conditioning
- Interior features: Partially finished basement; Basement laundry area (in basement); Two fireplaces (gas and wood-burning)
- Laundry & utility: Washer; Dryer; Laundry located in lower level
Neighborhood map
What this means for you Summary
Snapshot
- This is a 3-bed/1.5-bath single-family listed at $230k.
Deal economics
- At list price, monthly cash flow is $300 ($4k/yr) — positive.
- The deal already cash-flows at list — no discount required.
- Meets the 1% rule at list price ($2k rent vs $230k).
- Recommended offer: $226k (1.5% below list) — sets the bar for market timing.
- Cap rate 7.9% vs local median 4.4% in Howland Center — top-decile yield for the area; either an underpriced asset or a hidden risk that comps aren't pricing in. Stress-test before assuming the spread holds.
Location & tenants
- Location reads 76/100 on livability (#207 in OH, #3,283 nationally) — a middle-class / working-renter tenant base. Strengths: cost of living A+, housing A+, health & safety A+; Watch: amenities F, commute F.
- Howland Local (suburban): math 59% / reading 65% proficiency, ranked #260 of 656 in OH (top 40%) — acceptable for families but not a draw, mixed tenant base, ~2y average lease.
- Zoned schools: Mines Elementary School (math 67% / reading 58%, grade B, #580 of 1,584 statewide, top 37%, 330 students, 41% FRL); Howland Middle School (math 56% / reading 66%, grade B+, #252 of 654 statewide, top 39%, 766 students, 38% FRL); Howland High School (math 58% / reading 74%, grade B, #155 of 781 statewide, top 20%, 742 students, 38% FRL).
- Market conditions: 90 active listings in the ZIP; 1 comparable units currently listed for rent nearby; 129 units permitted in Trumbull County in 2024 (0 in 5+ unit buildings).
- This rent runs 42% of the median local income ($65k/yr) — at the standard rent-burdened threshold; future hikes will face affordability resistance.
Forward outlook
- Local home prices are declining (-3.0%/yr); year-one equity from $2k of loan paydown is wiped out by about $7k of value loss. Plan a longer hold.
- Trumbull County population projected at -22% by 2050 — secular population decline; favor cash flow + early exit over multi-decade hold.
Negotiation context
- It's been on market 28 days — a 2% lower offer ($226k) is reasonable based on typical stale-listing flexibility.
Questions for the listing agent
- Built in 1962 — when were the roof, HVAC, electrical panel, plumbing, and water heater last replaced?
- Is there a deadline driving the sale (1031 exchange, divorce, estate, relocation)? That informs how much negotiation room exists.
- Schools are B-rated — typically a magnet for longer-tenancy family renters. What's the average tenant stay here, and is there a school-zone premium baked into asking?
- What's the average days-on-market for RENTAL listings here right now (not sales)? A rising rental-DOM trend means longer vacancies and softer asking-rent achievability than the comps imply.
- What's the recent tenant-quality profile in this submarket — average credit score on applications, eviction rate, late-payment / NSF rate, and stable-employment percentage? A property-management company in the area should have these aggregated.
- How much new for-sale + rental construction is in the pipeline within 1–3 miles? Heavy new supply typically softens prices + rents 12–24 months out; constrained supply supports both.
Investment metrics
- 1% rule
- 1.00% ✓
- Cap rate
- 7.86%
- Cash-on-cash
- 5.60%
- DSCR
- 1.25
- GRM
- 8.3
CMA / ARV
- ARV (on-the-fly)
- $277,885
- Comps found
- 12
Show comp detail 12 sales within ~0.75 mi
| Address | Dist | Beds/Ba | Sqft | Sold | Price | $/sf | Match |
|---|---|---|---|---|---|---|---|
| 1750 Portal Dr NE | 0.33mi | 3/2.5 | 2,016 (+8%) | 5mo | $388,000 | $192 | 63 |
| 9231 King Graves Rd NE | 0.39mi | 4/2.5 (+1) | 1,973 (+6%) | 1mo | $305,000 | $155 | 62 |
| 8545 Carriage Hill Dr NE | 0.46mi | 4/2.5 (+1) | 2,016 (+8%) | 4mo | $233,000 | $116 | 53 |
| 8094 Castle Rock Dr NE | 0.54mi | 4/2.0 (+1) | 1,783 (-4%) | 12mo | $249,000 | $140 | 50 |
| 1466 White Oak Dr NE | 0.57mi | 3/2.5 | 2,001 (+7%) | 13mo | $245,000 | $122 | 46 |
| 8908 Sherwood Dr NE | 0.72mi | 4/3.0 (+1) | 1,952 (+5%) | 2mo | $290,000 | $149 | 46 |
| 2140 Howland Wilson Rd NE | 0.59mi | 3/2.0 | 1,660 (-11%) | 7mo | $247,500 | $149 | 46 |
| 1800 Howland Wilson Rd NE | 0.70mi | 3/2.0 | 2,048 (+10%) | 7mo | $335,000 | $164 | 44 |
| 8080 Glen Oaks | 0.75mi | 4/2.5 (+1) | 1,792 (-4%) | 10mo | $186,000 | $104 | 41 |
| 8541 Bayberry Dr | 0.69mi | 3/2.5 | 2,023 (+8%) | 14mo | $275,000 | $136 | 38 |
| 8570 Red Oak Dr NE | 0.65mi | 4/2.5 (+1) | 2,016 (+8%) | 11mo | $245,000 | $122 | 38 |
| 1383 Bittersweet Dr NE | 0.73mi | 4/2.5 (+1) | 2,016 (+8%) | 12mo | $325,000 | $161 | 33 |
Match score weights: distance 35% · size 25% · config 20% · recency 20%. Top-matched comps best support the ARV.
Projected returns pro-forma
-3.0% appreciation · 3.0% rent growth · sell at horizon
- IRR
- -7.6%
- Equity multiple
- 0.72×
- Total profit
- $-18,125
- Equity at exit
- $34,279
- IRR
- 1.9%
- Equity multiple
- 1.14×
- Total profit
- $8,822
- Equity at exit
- $19,878
Cash invested: $64,372 (down + closing). Projections, not guarantees.
Landlord ↔ Tenant lean methodology
- Overall (STATE)
- 73 Landlord-Friendly
- State Ohio
- 73 Landlord-Friendly · R+6
- County
- — inherits STATE
- City
- — inherits STATE
ZIP-level market 44484
- Home prices YoY
- -17.5%
- Active inventory
- 90
- Price-to-rent
- 8.3×
Monthly cashflow live
- Estimated rent
- $2,300 medium interval (Pro) →
- Mortgage (P&I)
- −$1,206
- Tax from tax record
- −$215 /mo · $2,581/yr
- Insurance
- −$96
- HOA
- −$0
- Vacancy / Maint / Mgmt
- −$483
- Net cashflow
- $300
Break-even live
Sensitivity live
| Price | -10% $431 | -5% $366 | +0% $300 | +5% $235 | +10% $170 |
|---|---|---|---|---|---|
| Rent | -10% $119 | -5% $210 | +0% $300 | +5% $391 | +10% $482 |
| Rate | -1.0pp $416 | -0.5pp $359 | base $300 | +0.5pp $241 | +1.0pp $180 |
UW: 25.0% down · 7.5% · 30yr · 1.5% tax · 5.0% vac · 8.0% maint · 8.0% mgmt
Financing live
Cash to close
- Down payment
- $57,475
- Closing costs
- $6,897
- Reserves months
- —
- Total cash needed
- —
Loan-product check · same deal, 3 products live
Conventional
25% down · 7.5% · 30yr
- Down + closing
- —
- Monthly P&I
- —
- Monthly cashflow
- —
- DSCR
- —
- Eligible?
- —
Personal DTI + credit; lowest rate.
DSCR
20% down · 8.5% · 30yr
- Down + closing
- —
- Monthly P&I
- —
- Monthly cashflow
- —
- DSCR
- —
- Eligible?
- —
No personal income docs; deal must DSCR.
Hard money
10% down · 12.0% · 12mo
- Down + closing
- —
- Monthly P&I
- —
- Monthly cashflow
- —
- DSCR
- —
- Eligible?
- —
Short-term bridge; refi at stabilization.
Rent comps 1 comps
| Address | Beds | Baths | Sqft | Rent | $/sqft | DOM | Units | Dist |
|---|---|---|---|---|---|---|---|---|
| 300 Pegotty Ct NE Warren, OH | 3.0 | 2.5 | 1820 | $2,300 | $1.26 | 15d | 1 | 1.18mi |
Listing history 18 events
-
2026-06-22days on market $229,900 Active 28 DOM
-
2026-06-19days on market $229,900 Active 26 DOM
-
2026-06-18days on market $229,900 Active 25 DOM
-
2026-06-17days on market $229,900 Active 24 DOM
-
2026-06-16days on market $229,900 Active 23 DOM
-
2026-06-15days on market $229,900 Active 22 DOM
-
2026-06-14days on market $229,900 Active 20 DOM
-
2026-06-13days on market $229,900 Active 19 DOM
-
2026-06-10pricedays on market $229,900 Active 17 DOM
-
2026-06-09days on market $249,900 Active 16 DOM
-
2026-06-08days on market $249,900 Active 15 DOM
-
2026-06-07days on market $249,900 Active 14 DOM
-
2026-06-05days on market $249,900 Active 11 DOM
-
2026-06-02days on market $249,900 Active 9 DOM
-
2026-06-01days on market $249,900 Active 8 DOM
-
2026-05-31days on market $249,900 Active 7 DOM
-
2026-05-30days on market $249,900 Active 6 DOM
-
2026-05-22$249,900 Active
ⓘ Source: listings_history table (triggers on properties + properties_extension) + one-shot
backfill from property_details.listing_events for pre-trigger history.
Tax reassessment forecast OH · Partial reset (capped growth)
- Current annual tax
- $2,581 · $215/mo
- Projected year-2 tax
- $3,084 · $257/mo
- Expected delta
- +$503/yr (+$42/mo · 19.5%)
ⓘ Screening estimate from a state-policy table — verify with the county assessor before closing.
Climate risk First Street
- Flood 1/10 Low FEMA zone X (unshaded) · 0% chance over 30 yrs
- Wildfire 1/10 Low
- Heat 2/10 Low 7 d/yr ≥96°F today · 16 d/yr by 30 yrs out
- Wind 1/10 Low
- Air quality 3/10 Moderate 2 unhealthy d/yr today · 5 by 30 yrs out
Nearby sold comps map
Loading sold comps map…
Walkable amenities ~0.75 mi
Loading nearby amenities…
Taxation est. · year 1
- Rental income
- $27,600
- − Mortgage interest
- −$12,878
- − Property taxes
- −$2,581
- − Insurance
- −$1,150
- − Repairs & maintenance
- −$2,208
- − Management
- −$2,208
- − Depreciation
- −$6,688
- Taxable loss
- −$113
- Est. tax savings @ 24.0%
- +$27
- After-tax cash flow
- $3,633/yr
For passive investors: Depreciation is non-cash, so a rental often shows a tax loss while cash-flowing — sheltering income. Rental losses are passive: they offset passive income freely, and up to $25,000/yr can offset ordinary (W-2) income if you actively participate and your MAGI is under $100k (phasing out to $0 by $150k); unused losses carry forward. On sale, claimed depreciation is recaptured at up to 25%, and gains may owe capital-gains tax (a 1031 exchange can defer both). Figures are a year-1 estimate at your 24.0% rate — not tax advice; consult a CPA.
Schools (NCES district)
- District
- Howland Local
- NCES district ID
- 3905016
- Math proficiency
- 59% ▼ -17.00%
- Reading proficiency
- 65% ▼ -13.00%
- Median HH income
- $49,022
- Composite
- 52.63/100
- National rank
- #1556
- State rank
- #260 of 656 in OH
Livability — Howland Center
- Score
- 76/100
- State rank
- #207
- US rank
- #3283
Category grades
Schools grade is shown separately in the Schools card above.
Census & demographics
- County
- Trumbull · 193,293 people
- City population
- 21,634
- Metro
- Youngstown-Warren, OH
- Population (ZIP)
- 21,634
- Household income
- $65,435
- Rent vs Own
- Severe rent burden
- 6.7
Population outlook (Trumbull County) Hauer SSP2
- Today (2025)
- 191,696 people
- By 2030
- 184,015 · -4.0%
- By 2040
- 166,810 · -13.0%
- By 2050
- 149,857 · -21.8%
- By 2075
- 115,769 · -39.6%
- By 2100
- 83,617 · -56.4%
Race, ethnicity, and origin ACS 2023
- Neighborhood character
- Predominantly White (84%)
- Race & ethnicity
- White 84% Black 8% Two or more races 5% Hispanic / Latino 3% Asian 2%
- Common ancestry
- Romanian 3% Lithuanian 2% Serbian 1%
- Foreign-born
- 3% · China, Canada
- Languages at home
- 96% English-only · Other Indo-European 2% Other Asian/Pacific 1% Spanish 1%
Political lean MEDSL · Trumbull
- 2024 margin
- R (+16.8) · D 41.2% · R 58.0%
- 2008→2024 swing
- -39.2pp toward R · 2008: 22.4pp · 2024: -16.8pp
- All cycles
- 2024: R+16.8 2020: R+10.6 2016: R+6.4 2012: D+22.2 2008: D+22.4
Not yet ingested
- Civics
- —
Market trends
- HPI YoY
- ▼ -46.24%
- Current HPI
- 217.6603
- Rent YoY
- —
- Metro
- —
- State GDP YoY
- ▲ 1.98%
- F500 in state
- 48
Industry mix (Fortune 500 HQ in OH)
| Industry | F500 HQs | Revenue |
|---|---|---|
| Insurance | 3 | $145B |
|
||
| Industrial Machinery | 3 | $49B |
|
||
| Financial Services | 3 | $24B |
|
||
| Consumer Goods | 2 | $93B |
|
||
| Aerospace / Defense | 2 | $47B |
|
||
| Utilities | 2 | $33B |
|
||
Price history
1 event — show timeline
- 2026-05-22 Listed $249,900 MLSNOW
Property tax history
+5.0%/yrLatest (2025): $2,581 · -0.1% YoY. Source: county tax records.
Cash-flow waterfall
monthlySold comps — $/sqft
last 12 mo · ≤1 miLoading sold comps…