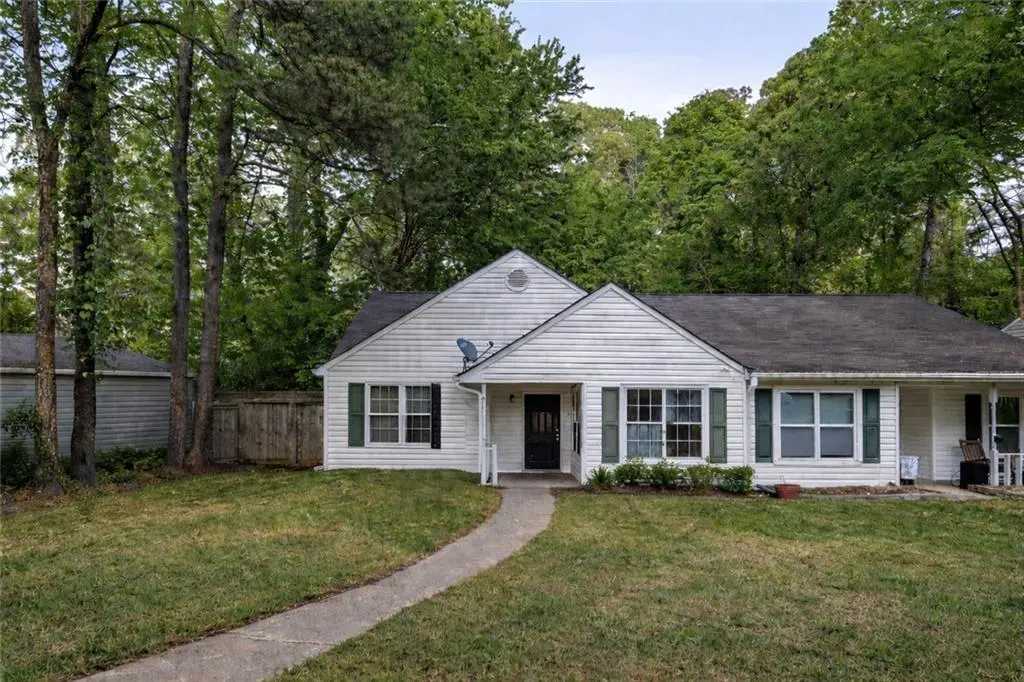
5144 Hill Farm Dr NE · Woodstock, GA
Flood risk 1/10 · Minimal
- FEMA flood zone
- X (unshaded)
- Chance of flooding over 30 yrs
- 0.0%
- Est. flood insurance / yr
- $507 – $1,088
Fire risk 3/10 · Minor
- Est. fire insurance / yr
- $963 – $1,789
Heat risk 5/10 · Moderate
- Hot days now (above 103°F)
- 7 days/yr
- Hot days in 30 yrs
- 18 days/yr
Wind risk 4/10 · Minor
- Chance of severe wind over 30 yrs
- 19.0%
Air-quality risk 4/10 · Minor
- Unhealthy air days now
- 5 days/yr
- Unhealthy air days in 30 yrs
- 7 days/yr
Risk factors via First Street. Map © Google.
Why this score? — see what drove the C+ grade
The composite is a weighted blend of 9 inputs, each scored 0–100. Each bar is that input's sub-score; the figure is the points it added to the 100-point composite (weight × sub-score).
- Cash flow +20.8/30.0
- ARV discount +15.0/15.0
- DSCR +6.6/10.0
- 1% rule +5.2/10.0
- Schools +3.8/10.0
- Livability +3.7/5.0
- Rent growth +3.5/5.0
- Condition / age +2.5/5.0
- Appreciation +0.0/10.0
$189,900
🖨 Deal sheet (PDF) 📄 Offer letter ✓ Due diligence
Listing remarks MLS
2 bed, 2 bath bungalow/townhouse minutes from downtown Woodstock. This home is perfect for an owner occupant willing to do a little work or would make a great investment property. The living room features high ceilings and skylights, along with a cozy fireplace. The primary suite includes an ensuite bathroom. The backyard is fenced and features a small porch and fire pit.
Key facts
- Built 1985
- Listed 64 days
Neighborhood map
What this means for you Summary
Snapshot
- This is a 2-bed/2.0-bath townhouse listed at $190k.
Deal economics
- At list price, monthly cash flow is $259 ($3k/yr) — positive.
- The deal already cash-flows at list — no discount required.
- Meets the 1% rule at list price ($2k rent vs $190k).
- Recommended offer: $179k (6.0% below list) — sets the bar for market timing.
- Cap rate 7.9% vs local median 3.3% in Woodstock — top-decile yield for the area; either an underpriced asset or a hidden risk that comps aren't pricing in. Stress-test before assuming the spread holds.
Location & tenants
- Location reads 73/100 on livability (#46 in GA) — a middle-class / working-renter tenant base. Strengths: crime A+, employment A+, housing A+; Watch: amenities F, commute F, health & safety F.
- Cobb County (suburban): math 39% / reading 45% proficiency, ranked #25 of 174 in GA (top 14%) — families likely to look elsewhere, expect single-tenant / working-renter base with shorter leases.
- Zoned schools: Nicholson Elementary School (math 42% / reading 42%, grade F, #380 of 1,228 statewide, top 33%, 407 students, 36% FRL); Mccleskey Middle School (math 37% / reading 44%, grade F, #140 of 470 statewide, top 30%, 570 students, 34% FRL); Kell High School (math 28% / reading 21%, grade F, #184 of 424 statewide, top 48%, 1,506 students, 32% FRL).
- Market conditions: Rents rising (+4.0%/yr); 623 active listings in the ZIP; 7 comparable units currently listed for rent nearby; rentals at typical pace (median 23d on market — plan ~3-4 weeks tenant-placement turnaround); 43% of comp listings sitting > 30 days — soft ceiling on asking rent; solid renter incomes; 1,625 units permitted in Cobb County in 2024 (389 in 5+ unit buildings).
Forward outlook
- Local home prices are declining (-3.0%/yr); year-one equity from $1k of loan paydown is wiped out by about $6k of value loss. Plan a longer hold.
- Cobb County population projected at +33% by 2050 — long-run rental-demand tailwind backs the buy-and-hold thesis.
Negotiation context
- It's been on market 64 days — a 6% lower offer ($179k) is reasonable based on typical stale-listing flexibility.
- 2 sale attempts; this cycle's ask has dropped $20k (10%) from the opening price — seller is motivated, your offer sets the floor, not the list.
- Current owner paid $142k; 33% above their basis — modest negotiation headroom, anchor on the comps not their cost.
Risks & watch-outs
- Climate carrying-cost: extreme-heat days projected 7→18/yr by 2055 (HVAC capex compounding) — expect insurance premiums to compound above CPI over the hold.
Questions for the listing agent
- It's been on market 64 days. Have you received any prior offers? Is the seller open to a 6% concession, seller financing, or rate buy-down credit?
- Why hasn't it sold? Are there any deal-killer items the seller is aware of (foundation, flood, title, zoning, code violations)?
- Is there a deadline driving the sale (1031 exchange, divorce, estate, relocation)? That informs how much negotiation room exists.
- Schools are B-rated — typically a magnet for longer-tenancy family renters. What's the average tenant stay here, and is there a school-zone premium baked into asking?
- What's the average days-on-market for RENTAL listings here right now (not sales)? A rising rental-DOM trend means longer vacancies and softer asking-rent achievability than the comps imply.
- What's the recent tenant-quality profile in this submarket — average credit score on applications, eviction rate, late-payment / NSF rate, and stable-employment percentage? A property-management company in the area should have these aggregated.
- How much new for-sale + rental construction is in the pipeline within 1–3 miles? Heavy new supply typically softens prices + rents 12–24 months out; constrained supply supports both.
Investment metrics
- 1% rule
- 1.02% ✓
- Cap rate
- 7.93%
- Cash-on-cash
- 5.85%
- DSCR
- 1.26
- GRM
- 8.2
CMA / ARV
- ARV (median comp)
- $255,616
- List price
- $189,900
- Delta
- -25.71%
- Verdict
- UNDERPRICED
- Comps
- 20 within 1.0 mi
Show comp detail 3 sales within ~0.75 mi
| Address | Dist | Beds/Ba | Sqft | Sold | Price | $/sf | Match |
|---|---|---|---|---|---|---|---|
| 5119 Hill Farm Dr NE | 0.09mi | 3/2.0 (+1) | 1,197 (+6%) | 10mo | $275,000 | $230 | 72 |
| 5142 Farm Place Dr NE | 0.13mi | 3/2.0 (+1) | 1,242 (+10%) | 7mo | $263,000 | $212 | 66 |
| 348 Farm Place Ct | 0.27mi | 3/2.0 (+1) | 1,242 (+10%) | 14mo | $283,000 | $228 | 54 |
Match score weights: distance 35% · size 25% · config 20% · recency 20%. Top-matched comps best support the ARV.
Projected returns pro-forma
-3.0% appreciation · 3.96% rent growth · sell at horizon
- IRR
- -6.2%
- Equity multiple
- 0.77×
- Total profit
- $-12,353
- Equity at exit
- $28,315
- IRR
- 4.5%
- Equity multiple
- 1.35×
- Total profit
- $18,452
- Equity at exit
- $16,419
Cash invested: $53,172 (down + closing). Projections, not guarantees.
Landlord ↔ Tenant lean methodology
- Overall (STATE)
- 90 Strongly Landlord-Friendly
- State Georgia
- 90 Strongly Landlord-Friendly · R+3
- County
- — inherits STATE
- City
- — inherits STATE
ZIP-level market 30188
- Rents YoY
- 4.0%
- Active inventory
- 623
- Price-to-rent
- 8.2×
Monthly cashflow live
- Estimated rent
- $1,939 high interval (Pro) →
- Mortgage (P&I)
- −$996
- Tax from tax record
- −$198 /mo · $2,371/yr
- Insurance
- −$79
- HOA
- −$0
- Vacancy / Maint / Mgmt
- −$407
- Net cashflow
- $259
Break-even live
Sensitivity live
| Price | -10% $367 | -5% $313 | +0% $259 | +5% $206 | +10% $152 |
|---|---|---|---|---|---|
| Rent | -10% $106 | -5% $183 | +0% $259 | +5% $336 | +10% $413 |
| Rate | -1.0pp $355 | -0.5pp $308 | base $259 | +0.5pp $210 | +1.0pp $160 |
UW: 25.0% down · 7.5% · 30yr · 1.5% tax · 5.0% vac · 8.0% maint · 8.0% mgmt
Financing live
Cash to close
- Down payment
- $47,475
- Closing costs
- $5,697
- Reserves months
- —
- Total cash needed
- —
Loan-product check · same deal, 3 products live
Conventional
25% down · 7.5% · 30yr
- Down + closing
- —
- Monthly P&I
- —
- Monthly cashflow
- —
- DSCR
- —
- Eligible?
- —
Personal DTI + credit; lowest rate.
DSCR
20% down · 8.5% · 30yr
- Down + closing
- —
- Monthly P&I
- —
- Monthly cashflow
- —
- DSCR
- —
- Eligible?
- —
No personal income docs; deal must DSCR.
Hard money
10% down · 12.0% · 12mo
- Down + closing
- —
- Monthly P&I
- —
- Monthly cashflow
- —
- DSCR
- —
- Eligible?
- —
Short-term bridge; refi at stabilization.
Rent comps 7 comps
| Address | Beds | Baths | Sqft | Rent | $/sqft | DOM | Units | Dist |
|---|---|---|---|---|---|---|---|---|
| 4930 Farmstead Ct NE Woodstock, GA | 2.0 | 1.5 | 1194 | $1,900 | $1.59 | 0d | 1 | 0.10mi |
| 5091 Farm Valley Dr NE Unit 5091 Woodstock, GA | 2.0 | 2.0 | 1100 | $1,795 | $1.63 | 45d | 1 | 0.13mi |
| 933 Old Noonday Sch House Rd Marietta, GA | 3.0 | 2.0 | 1500 | $1,800 | $1.20 | 22d | 1 | 0.56mi |
| 10247 Highway 92 Woodstock, GA | 1.0–3.0 | 1.0–2.0 | 1093 | $1,798 | $1.64 | 0d | 10 | 1.11mi |
| 1370 High Country Ct Marietta, GA | 3.0 | 2.0 | 1260 | $2,059 | $1.63 | 45d | 1 | 1.20mi |
| 900 View Dr Woodstock, GA | 1.0–3.0 | 1.0–2.0 | 1156 | $1,995 | $1.73 | 0d | 12 | 1.32mi |
| 1109 Rook Pl Woodstock, GA | 2.0 | 2.0 | 912 | $1,850 | $2.03 | 45d | 1 | 1.45mi |
Listing history 18 events
-
2026-06-18status $189,900 Pending 64 DOM
-
2026-06-18days on market $189,900 Active Under Contract 64 DOM
-
2026-06-17days on market $189,900 Active Under Contract 63 DOM
-
2026-06-16days on market $189,900 Active Under Contract 62 DOM
-
2026-06-15days on market $189,900 Active Under Contract 61 DOM
-
2026-06-13days on market $189,900 Active Under Contract 59 DOM
-
2026-06-13statusdays on market $189,900 Active Under Contract 58 DOM
-
2026-06-09days on market $189,900 Active 55 DOM
-
2026-06-08days on market $189,900 Active 54 DOM
-
2026-06-07days on market $189,900 Active 53 DOM
-
2026-06-04days on market $189,900 Active 50 DOM
-
2026-06-03days on market $189,900 Active 49 DOM
-
2026-06-02days on market $189,900 Active 48 DOM
-
2026-06-01days on market $189,900 Active 47 DOM
-
2026-05-31days on market $189,900 Active 46 DOM
-
2026-04-15$210,000 New 374-char remark
Show marketing remark (374 chars)
2 bed, 2 bath bungalow/townhouse minutes from downtown Woodstock. This home is perfect for an owner occupant willing to do a little work or would make a great investment property. The living room features high ceilings and skylights, along with a cozy fireplace. The primary suite includes an ensuite bathroom. The backyard is fenced and features a small porch and fire pit.
-
2026-04-15$210,000 Active 374-char remark
Show marketing remark (374 chars)
2 bed, 2 bath bungalow/townhouse minutes from downtown Woodstock. This home is perfect for an owner occupant willing to do a little work or would make a great investment property. The living room features high ceilings and skylights, along with a cozy fireplace. The primary suite includes an ensuite bathroom. The backyard is fenced and features a small porch and fire pit.
-
2026-04-02soldstatus $142,500
ⓘ Source: listings_history table (triggers on properties + properties_extension) + one-shot
backfill from property_details.listing_events for pre-trigger history.
Tax reassessment forecast GA · Resets to sale price
- Current annual tax
- $2,371 · $198/mo
- Projected year-2 tax
- $2,371 · $198/mo
- Expected delta
- $0/yr ($0/mo · 0.0%)
ⓘ Screening estimate from a state-policy table — verify with the county assessor before closing.
Climate risk First Street
- Flood 1/10 Low FEMA zone X (unshaded) · 0% chance over 30 yrs
- Wildfire 3/10 Moderate
- Heat 5/10 Major 7 d/yr ≥103°F today · 18 d/yr by 30 yrs out
- Wind 4/10 Moderate 19% chance of damaging wind over 30 yrs
- Air quality 4/10 Moderate 5 unhealthy d/yr today · 7 by 30 yrs out
Nearby sold comps map
Loading sold comps map…
Walkable amenities ~0.75 mi
Loading nearby amenities…
Taxation est. · year 1
- Rental income
- $23,271
- − Mortgage interest
- −$10,637
- − Property taxes
- −$2,371
- − Insurance
- −$950
- − Repairs & maintenance
- −$1,862
- − Management
- −$1,862
- − Depreciation
- −$5,524
- Taxable income
- $65
- Est. tax owed @ 24.0%
- −$16
- After-tax cash flow
- $3,097/yr
For passive investors: Depreciation is non-cash, so a rental often shows a tax loss while cash-flowing — sheltering income. Rental losses are passive: they offset passive income freely, and up to $25,000/yr can offset ordinary (W-2) income if you actively participate and your MAGI is under $100k (phasing out to $0 by $150k); unused losses carry forward. On sale, claimed depreciation is recaptured at up to 25%, and gains may owe capital-gains tax (a 1031 exchange can defer both). Figures are a year-1 estimate at your 24.0% rate — not tax advice; consult a CPA.
Schools (NCES district)
- District
- Cobb County
- NCES district ID
- 1301290
- Math proficiency
- 39% ▼ -15.00%
- Reading proficiency
- 45% ▼ -10.00%
- Median HH income
- $68,845
- Composite
- 37.93/100
- National rank
- #4308
- State rank
- #25 of 174 in GA
Livability — Woodstock
- Score
- 73/100
- State rank
- #46
- US rank
- #5116
Category grades
Schools grade is shown separately in the Schools card above.
Census & demographics
- County
- Cherokee County · 289,977 people
- City population
- 109,446
- Metro
- Atlanta-Sandy Springs-Alpharetta, GA
- Population (ZIP)
- 69,518
- Household income
- $106,844
- Rent vs Own
- Severe rent burden
- 1591.0
Population outlook (Cobb County) Hauer SSP2
- Today (2025)
- 868,385 people
- By 2030
- 929,614 · +7.1%
- By 2040
- 1,047,533 · +20.6%
- By 2050
- 1,155,537 · +33.1%
- By 2075
- 1,405,030 · +61.8%
- By 2100
- 1,555,058 · +79.1%
Race, ethnicity, and origin ACS 2023
- Neighborhood character
- Predominantly White (74%)
- Race & ethnicity
- White 74% Hispanic / Latino 9% Two or more races 8% Black 7% Asian 4%
- Hispanic origin (detail)
- Mexican 4% Puerto Rican 1%
- Common ancestry
- Slovak 3% Italian 3% Lithuanian 3%
- Foreign-born
- 11% · Canada, Vietnam, South Korea
- Languages at home
- 87% English-only · Spanish 7% Other Indo-European 3% Other Asian/Pacific 1%
Political lean MEDSL · Cobb
- 2024 margin
- D (+14.9) · D 56.9% · R 42.0% · Other 1.1%
- 2008→2024 swing
- +24.3pp toward D · 2008: -9.4pp · 2024: 14.9pp
- All cycles
- 2024: D+14.9 2020: D+14.3 2016: D+2.1 2012: R+12.6 2008: R+9.4
Not yet ingested
- Civics
- —
Market trends
- HPI YoY
- ▼ -291.54%
- Current HPI
- 260.554
- Rent YoY
- ▲ 3.96%
- Metro
- Atlanta-Sandy Springs-Alpharetta, GA
- State GDP YoY
- ▲ 2.66%
- F500 in state
- 28
Industry mix (Fortune 500 HQ in GA)
| Industry | F500 HQs | Revenue |
|---|---|---|
| Paper / Packaging | 2 | $29B |
|
||
| Retail | 1 | $160B |
|
||
| Transportation / Logistics | 1 | $91B |
|
||
| Airlines | 1 | $62B |
|
||
| Consumer Goods | 1 | $47B |
|
||
| Utilities | 1 | $25B |
|
||
Price history
+47.4% since first listed3 events — show timeline
- 2026-04-15 Listed $210,000 FMLS
- 2026-04-15 Listed $210,000 GAMLS
- 2026-04-02 Sold (Public Records) $142,500 Public Records
Property tax history
+4.8%/yrLatest (2025): $2,371 · -4.1% YoY. Source: county tax records.
Cash-flow waterfall
monthlySold comps — $/sqft
last 12 mo · ≤1 miLoading sold comps…