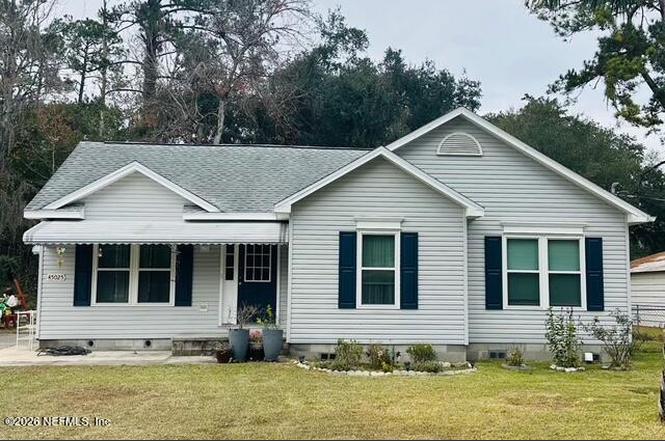
45025 Mahoney St · Callahan, FL
Flood risk 1/10 · Minimal
- FEMA flood zone
- X (unshaded)
- Chance of flooding over 30 yrs
- 0.0%
- Est. flood insurance / yr
- $507 – $1,088
Fire risk 5/10 · Moderate
- Est. fire insurance / yr
- $947 – $1,759
Heat risk 9/10 · Severe
- Hot days now (above 108°F)
- 7 days/yr
- Hot days in 30 yrs
- 20 days/yr
Wind risk 9/10 · Severe
- Chance of severe wind over 30 yrs
- 99.0%
Air-quality risk 6/10 · Moderate
- Unhealthy air days now
- 12 days/yr
- Unhealthy air days in 30 yrs
- 13 days/yr
Risk factors via First Street. Map © Google.
Why this score? — see what drove the D- grade
The composite is a weighted blend of 9 inputs, each scored 0–100. Each bar is that input's sub-score; the figure is the points it added to the 100-point composite (weight × sub-score).
- Appreciation +10.0/10.0
- Cash flow +6.7/30.0
- Schools +6.0/10.0
- ARV discount +5.0/15.0
- Livability +3.6/5.0
- Rent growth +2.5/5.0
- Condition / age +2.5/5.0
- DSCR +0.9/10.0
- 1% rule +0.4/10.0
$280,000
🖨 Deal sheet (PDF) 📄 Offer letter ✓ Due diligence
Listing remarks MLS
Pack your bags because this is the home you have been waiting for. Newly renovated home in the heart of Callahan. This home boasts new wood Laminate flooring and paint throughout. While you enjoy the immaculate inside, the dog will enjoy the fully fenced backyard. Conveniently located to everything Callahan has to offer. Call today to schedule your showing because this home won't last long!
Key facts
- No cdd fees
- Centrally located
- Large kitchen
Tags
Property features AI
Exterior
- Parking: Other parking
- Utilities: Public sewer; Electricity available; Water available; Sewer available
- Home design: Single-family residence; One story
- Construction: Vinyl siding
- Exterior features: Covered porch; Back yard fencing; Shed(s)
Interior
- Kitchen: Dishwasher; Electric oven
- Bedrooms: 3 bedrooms
- Flooring: Vinyl
- Bathrooms: 2 full bathrooms
- Heating & cooling: Central heating; Central air conditioning
- Interior features: Vinyl flooring
Neighborhood map
What this means for you Summary
Snapshot
- This is a 3-bed/2.0-bath single-family listed at $280k.
Deal economics
- At list price, monthly cash flow is $-451 ($-5k/yr) — negative.
- To cash-flow at today's rent, offer at most $200k (28.5% below list).
- To meet the 1% rule (rent ≥ 1% of price), the offer needs to be $152k (45.7% below list).
- Recommended offer: $152k (45.7% below list) — sets the bar for 1% rule.
- Cap rate 4.4% vs local median 2.6% in Callahan — top-decile yield for the area; either an underpriced asset or a hidden risk that comps aren't pricing in. Stress-test before assuming the spread holds.
Location & tenants
- Location reads 71/100 on livability (#408 in FL) — a middle-class / working-renter tenant base. Strengths: crime A+, cost of living A+, housing A+; Watch: employment D+, amenities F, commute F.
- Nassau (town): math 74% / reading 65% proficiency, ranked #4 of 73 in FL (top 6%) — acceptable for families but not a draw, mixed tenant base, ~2y average lease.
- Market conditions: 103 active listings in the ZIP; 1 comparable units currently listed for rent nearby; 953 units permitted in Nassau County in 2024 (24 in 5+ unit buildings).
Forward outlook
- In year one you build about $30k of equity ($2k loan paydown + $28k appreciation (10.0% local appreciation)).
- Nassau County population projected at +17% by 2050 — long-run rental-demand tailwind backs the buy-and-hold thesis.
- By year 2, paydown + projected appreciation supports a ~$48k cash-out refi (75% LTV) — recoverable capital for the next deal without selling this one.
Negotiation context
- It's been on market 137 days — a 12% lower offer ($246k) is reasonable based on typical stale-listing flexibility.
- 3 sale attempts since 12y ago; this cycle's ask has dropped $35k (11%) from the opening price — seller is motivated, your offer sets the floor, not the list.
- Current owner paid $100k; list at $280k implies a 181% gain — meaningful room to come down on a strong offer.
Risks & watch-outs
- Climate carrying-cost: severe wind risk, 99% chance of damaging wind over 30y; moderate wildfire risk; extreme-heat days projected 7→20/yr by 2055 (HVAC capex compounding) — expect insurance premiums to compound above CPI over the hold.
Questions for the listing agent
- What do current leases actually rent for vs. the listed asking? Can we see a recent rent roll and the last 12 months of T-12 income?
- It's been on market 137 days. Have you received any prior offers? Is the seller open to a 46% concession, seller financing, or rate buy-down credit?
- Why hasn't it sold? Are there any deal-killer items the seller is aware of (foundation, flood, title, zoning, code violations)?
- Is there a deadline driving the sale (1031 exchange, divorce, estate, relocation)? That informs how much negotiation room exists.
- Schools are B-rated — typically a magnet for longer-tenancy family renters. What's the average tenant stay here, and is there a school-zone premium baked into asking?
- The area grade is low — what's the realistic commute time and amenity access for the typical tenant pool here? Any planned neighborhood developments (good or bad) we should know about?
- What's the average days-on-market for RENTAL listings here right now (not sales)? A rising rental-DOM trend means longer vacancies and softer asking-rent achievability than the comps imply.
- What's the recent tenant-quality profile in this submarket — average credit score on applications, eviction rate, late-payment / NSF rate, and stable-employment percentage? A property-management company in the area should have these aggregated.
- How much new for-sale + rental construction is in the pipeline within 1–3 miles? Heavy new supply typically softens prices + rents 12–24 months out; constrained supply supports both.
Investment metrics
- 1% rule
- 0.54% ✗
- Cap rate
- 4.36%
- Cash-on-cash
- -6.91%
- DSCR
- 0.69
- GRM
- 15.4
CMA / ARV
- ARV (on-the-fly)
- $265,080
- Comps found
- 5
Show comp detail 5 sales within ~0.75 mi
| Address | Dist | Beds/Ba | Sqft | Sold | Price | $/sf | Match |
|---|---|---|---|---|---|---|---|
| 45025 Mahoney St | 0.00mi | 3/2.0 | 1,128 (0%) | 1mo | $265,000 | $235 | 99 |
| 45068 Fourth Ave | 0.28mi | 3/2.0 | 1,162 (+3%) | 23mo | $275,000 | $237 | 63 |
| 45043 Brinkley St | 0.42mi | 3/2.0 | 1,242 (+10%) | 10mo | $295,000 | $238 | 55 |
| 45138 Ewing Park Rd | 0.53mi | 3/1.5 | 1,025 (-9%) | 15mo | $179,000 | $175 | 46 |
| 45284 Dixie Ave | 0.71mi | 2/1.0 (-1) | 995 (-12%) | 24mo | $225,000 | $226 | 18 |
Match score weights: distance 35% · size 25% · config 20% · recency 20%. Top-matched comps best support the ARV.
Projected returns pro-forma
10.0% appreciation · 3.0% rent growth · sell at horizon
- IRR
- 19.4%
- Equity multiple
- 2.58×
- Total profit
- $123,606
- Equity at exit
- $252,246
- IRR
- 17.8%
- Equity multiple
- 5.93×
- Total profit
- $386,299
- Equity at exit
- $543,978
Cash invested: $78,400 (down + closing). Projections, not guarantees.
Landlord ↔ Tenant lean methodology
- Overall (STATE)
- 87 Strongly Landlord-Friendly
- State Florida
- 87 Strongly Landlord-Friendly · R+3
- County
- — inherits STATE
- City
- — inherits STATE
ZIP-level market 32011
- Home prices YoY
- 19.2%
- Active inventory
- 103
- Price-to-rent
- 15.4×
Monthly cashflow live
- Estimated rent
- $1,520 medium interval (Pro) →
- Mortgage (P&I)
- −$1,468
- Tax from tax record
- −$67 /mo · $804/yr
- Insurance
- −$117
- HOA
- −$0
- Vacancy / Maint / Mgmt
- −$319
- Net cashflow
- $-451
Break-even live
Sensitivity live
| Price | -10% $-293 | -5% $-372 | +0% $-451 | +5% $-530 | +10% $-610 |
|---|---|---|---|---|---|
| Rent | -10% $-571 | -5% $-511 | +0% $-451 | +5% $-391 | +10% $-331 |
| Rate | -1.0pp $-310 | -0.5pp $-380 | base $-451 | +0.5pp $-524 | +1.0pp $-598 |
UW: 25.0% down · 7.5% · 30yr · 1.5% tax · 5.0% vac · 8.0% maint · 8.0% mgmt
Financing live
Cash to close
- Down payment
- $70,000
- Closing costs
- $8,400
- Reserves months
- —
- Total cash needed
- —
Loan-product check · same deal, 3 products live
Conventional
25% down · 7.5% · 30yr
- Down + closing
- —
- Monthly P&I
- —
- Monthly cashflow
- —
- DSCR
- —
- Eligible?
- —
Personal DTI + credit; lowest rate.
DSCR
20% down · 8.5% · 30yr
- Down + closing
- —
- Monthly P&I
- —
- Monthly cashflow
- —
- DSCR
- —
- Eligible?
- —
No personal income docs; deal must DSCR.
Hard money
10% down · 12.0% · 12mo
- Down + closing
- —
- Monthly P&I
- —
- Monthly cashflow
- —
- DSCR
- —
- Eligible?
- —
Short-term bridge; refi at stabilization.
Rent comps 1 comps
| Address | Beds | Baths | Sqft | Rent | $/sqft | DOM | Units | Dist |
|---|---|---|---|---|---|---|---|---|
| 45160 Ewing Park Rd Callahan, FL | 2.0 | 1.0 | 900 | $1,520 | $1.69 | 9d | 3 | 0.49mi |
Listing history 14 events
-
2026-05-01status Pending
-
2026-03-28price $280,000
-
2026-03-21price $289,000
-
2026-03-13price $294,000
-
2026-02-14price $299,000
-
2026-01-28price $310,000
-
2025-12-15$315,000 Active
-
2014-10-23soldstatus $99,600
-
2014-10-22soldstatus $99,500 393-char remark
Show marketing remark (389 chars)
Pack your bags, because this is the home you've been waiting for. Completely renovated home in the heart of Callahan. This home has brand NEW wood laminate flooring and paint throughout. While you enjoy the immaculate inside, the dog will enjoy the fully fenced back yard. Conveniently located to everything Callahan has to offer. This home is a must see for anyone looking in West Nassau.
-
2014-10-22soldstatus $99,500 389-char remark
Show marketing remark (389 chars)
Pack your bags, because this is the home you've been waiting for. Completely renovated home in the heart of Callahan. This home has brand NEW wood laminate flooring and paint throughout. While you enjoy the immaculate inside, the dog will enjoy the fully fenced back yard. Conveniently located to everything Callahan has to offer. This home is a must see for anyone looking in West Nassau.
-
2014-09-04$119,500 393-char remark
Show marketing remark (393 chars)
Pack your bags because this is the home you have been waiting for. Newly renovated home in the heart of Callahan. This home boasts new wood Laminate flooring and paint throughout. While you enjoy the immaculate inside, the dog will enjoy the fully fenced backyard. Conveniently located to everything Callahan has to offer. Call today to schedule your showing because this home won't last long!
-
2014-09-03$119,500 389-char remark
Show marketing remark (389 chars)
Pack your bags, because this is the home you've been waiting for. Completely renovated home in the heart of Callahan. This home has brand NEW wood laminate flooring and paint throughout. While you enjoy the immaculate inside, the dog will enjoy the fully fenced back yard. Conveniently located to everything Callahan has to offer. This home is a must see for anyone looking in West Nassau.
-
2004-01-15soldstatus $101,500
-
2003-07-10soldstatus $60,000
ⓘ Source: listings_history table (triggers on properties + properties_extension) + one-shot
backfill from property_details.listing_events for pre-trigger history.
Tax reassessment forecast FL · Resets to sale price
- Current annual tax
- $804 · $67/mo
- Projected year-2 tax
- $2,324 · $194/mo
- Expected delta
- +$1,520/yr (+$127/mo · 189.0%)
ⓘ Screening estimate from a state-policy table — verify with the county assessor before closing.
Climate risk First Street
- Flood 1/10 Low FEMA zone X (unshaded) · 0% chance over 30 yrs
- Wildfire 5/10 Major
- Heat 9/10 Extreme 7 d/yr ≥108°F today · 20 d/yr by 30 yrs out
- Wind 9/10 Extreme 99% chance of damaging wind over 30 yrs
- Air quality 6/10 Major 12 unhealthy d/yr today · 13 by 30 yrs out
Nearby sold comps map
Loading sold comps map…
Walkable amenities ~0.75 mi
Loading nearby amenities…
Taxation est. · year 1
- Rental income
- $18,240
- − Mortgage interest
- −$15,684
- − Property taxes
- −$804
- − Insurance
- −$1,400
- − Repairs & maintenance
- −$1,459
- − Management
- −$1,459
- − Depreciation
- −$8,145
- Taxable loss
- −$10,712
- Est. tax savings @ 24.0%
- +$2,571
- After-tax cash flow
- $-2,844/yr
For passive investors: Depreciation is non-cash, so a rental often shows a tax loss while cash-flowing — sheltering income. Rental losses are passive: they offset passive income freely, and up to $25,000/yr can offset ordinary (W-2) income if you actively participate and your MAGI is under $100k (phasing out to $0 by $150k); unused losses carry forward. On sale, claimed depreciation is recaptured at up to 25%, and gains may owe capital-gains tax (a 1031 exchange can defer both). Figures are a year-1 estimate at your 24.0% rate — not tax advice; consult a CPA.
Schools (NCES district)
- District
- Nassau
- NCES district ID
- 1201350
- Math proficiency
- 74% ▼ -2.00%
- Reading proficiency
- 65% ▼ -2.00%
- Median HH income
- $58,267
- Composite
- 59.79/100
- National rank
- #899
- State rank
- #4 of 73 in FL
Livability — Callahan
- Score
- 71/100
- State rank
- #408
- US rank
- #7208
Category grades
Schools grade is shown separately in the Schools card above.
Census & demographics
- Census place
- Callahan, FL
- Population (ZIP)
- 15,716
Population outlook (Nassau County) Hauer SSP2
- Today (2025)
- 88,419 people
- By 2030
- 92,679 · +4.8%
- By 2040
- 99,257 · +12.3%
- By 2050
- 103,378 · +16.9%
- By 2075
- 109,726 · +24.1%
- By 2100
- 107,006 · +21.0%
Race, ethnicity, and origin ACS 2023
- Neighborhood character
- Predominantly White (92%)
- Race & ethnicity
- White 92% Black 3% Hispanic / Latino 3% Two or more races 3%
- Common ancestry
- Italian 2% Slovak 2% Lithuanian 1%
- Foreign-born
- 2% · Canada
- Languages at home
- 98% English-only · Spanish 1%
Political lean MEDSL · Nassau
- 2024 margin
- Solid R (+46.9) · D 26.1% · R 73.1%
- 2008→2024 swing
- -3.1pp toward R · 2008: -43.8pp · 2024: -46.9pp
- All cycles
- 2024: R+46.9 2020: R+45.9 2016: R+50.2 2012: R+48.6 2008: R+43.8
Not yet ingested
- Civics
- —
Market trends
- HPI YoY
- ▲ 56.56%
- Current HPI
- 351.8301
- Rent YoY
- —
- Metro
- —
- State GDP YoY
- ▲ 3.28%
- F500 in state
- 36
Industry mix (Fortune 500 HQ in FL)
| Industry | F500 HQs | Revenue |
|---|---|---|
| Industrial Technology | 2 | $29B |
|
||
| Insurance | 2 | $17B |
|
||
| Retail | 1 | $60B |
|
||
| Technology Distribution | 1 | $58B |
|
||
| Homebuilding | 1 | $35B |
|
||
| Technology Manufacturing | 1 | $35B |
|
||
Price history
+366.7% since first listed14 events — show timeline
- 2026-05-01 Pending — realMLS
- 2026-03-28 Price Changed $280,000 realMLS
- 2026-03-21 Price Changed $289,000 realMLS
- 2026-03-13 Price Changed $294,000 realMLS
- 2026-02-14 Price Changed $299,000 realMLS
- 2026-01-28 Price Changed $310,000 realMLS
- 2025-12-15 Listed $315,000 realMLS
- 2014-10-23 Sold (Public Records) $99,600 Public Records
- 2014-10-22 Sold (MLS) $99,500 AINCAR
- 2014-10-22 Sold (MLS) $99,500 realMLS
- 2014-09-04 Listed $119,500 realMLS
- 2014-09-03 Listed $119,500 AINCAR
- 2004-01-15 Sold (Public Records) $101,500 Public Records
- 2003-07-10 Sold (Public Records) $60,000 Public Records
Property tax history
-4.2%/yrLatest (2025): $804 · +1.7% YoY. Source: county tax records.
Cash-flow waterfall
monthlySold comps — $/sqft
last 12 mo · ≤1 miLoading sold comps…