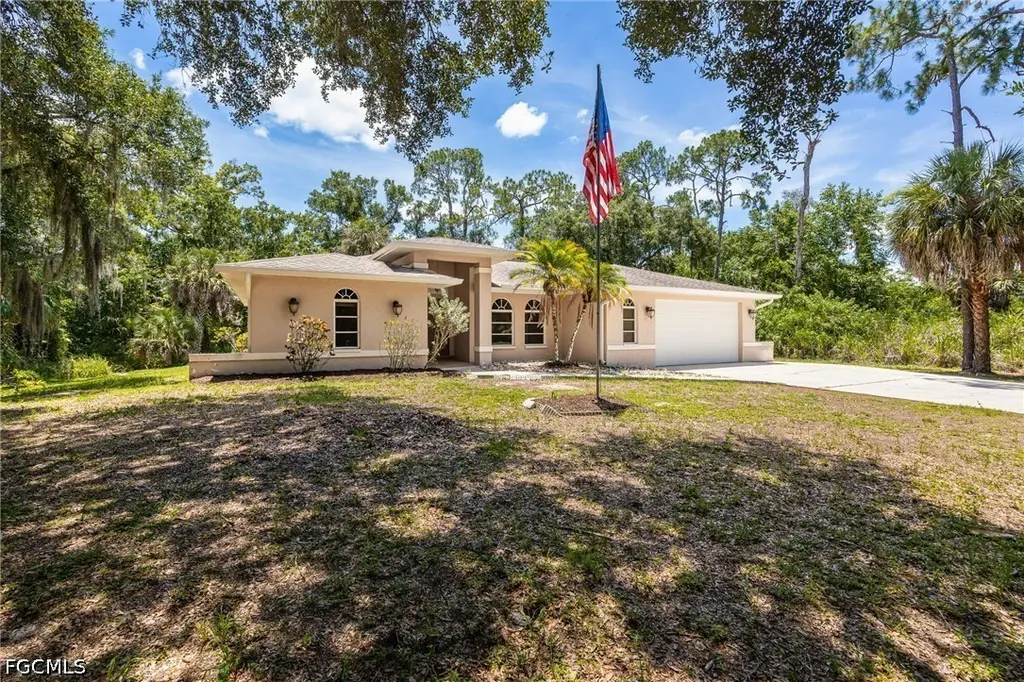
2411 Herzog Rd · Alva, FL
Flood risk 1/10 · Minimal
- FEMA flood zone
- X (shaded)
- Chance of flooding over 30 yrs
- 0.0%
- Est. flood insurance / yr
- $507 – $1,088
Fire risk 5/10 · Moderate
- Est. fire insurance / yr
- $947 – $1,759
Heat risk 9/10 · Severe
- Hot days now (above 108°F)
- 7 days/yr
- Hot days in 30 yrs
- 27 days/yr
Wind risk 10/10 · Severe
- Chance of severe wind over 30 yrs
- 99.0%
Air-quality risk 2/10 · Minimal
- Unhealthy air days now
- 2 days/yr
- Unhealthy air days in 30 yrs
- 2 days/yr
Risk factors via First Street. Map © Google.
Why this score? — see what drove the D+ grade
The composite is a weighted blend of 9 inputs, each scored 0–100. Each bar is that input's sub-score; the figure is the points it added to the 100-point composite (weight × sub-score).
- ARV discount +15.0/15.0
- Cash flow +14.5/30.0
- DSCR +4.4/10.0
- Schools +4.1/10.0
- Livability +3.4/5.0
- 1% rule +3.1/10.0
- Rent growth +2.5/5.0
- Condition / age +2.5/5.0
- Appreciation +0.0/10.0
$335,000
🖨 Deal sheet (PDF) 📄 Offer letter ✓ Due diligence
Listing remarks
Unlock the potential of country living with this rare opportunity in the heart of Alva. Situated on an oversized homesite and being sold together with the adjacent lot, 2411 Herzog Rd offers the space, privacy, and flexibility that are becoming increasingly difficult to find in Southwest Florida. Lovingly maintained by its original owner, this home is ready for its next chapter and presents an exceptional opportunity for buyers looking to add their own style and updates while building instant equity. The spacious floor plan features two primary suites, making it ideal for multigenerational living, hosting guests, or creating a private retreat. The guest bathroom conveniently functions as a
Key facts
- Oversized homesite
- Pool and spa
- Two primary suites
Tags
Property features AI
Finance
- Financial info: Pets allowed
- HOA & community: Non-gated community; No association fee listed
Exterior
- Parking: Attached 2-car garage; Driveway; Paved parking; Garage with door opener; Covered parking for 2 vehicles
- Security: Smoke detectors
- Utilities: Well water; Septic tank; Cable available; High-speed internet available
- Home design: Single-story; Resale property; Faces west
- Construction: Block, concrete and stucco construction; Shingle roof
- Exterior features: Deck; Lanai; Patio; Porch; Screened porch; Storage; Outbuilding; Oversized lot; Located on a dead-end road; Paved road; East exposure
Interior
- Kitchen: Range; Dishwasher; Disposal; Icemaker; Refrigerator; Refrigerator with ice maker; Kitchen island; Pantry; Water purifier (reverse osmosis)
- Bedrooms: Includes multiple primary suites; Split bedroom layout
- Flooring: Carpet; Tile
- Bathrooms: 3 full bathrooms; Dual sinks in primary; Combination of bathtub and separate showers
- Heating & cooling: Central heating (electric); Central air conditioning (electric); Ceiling fans
- Interior features: Breakfast bar; Built-in features; Bathtub; Separate/formal dining room; Dual sinks; Entrance foyer; Kitchen island; Living/dining room; Multiple primary suites; Pantry; Shower only; Separate shower; Vaulted ceilings; Walk-in closets; Split bedrooms; Single-hung windows; Unfurnished
- Laundry & utility: Washer; Dryer; Laundry located inside; Water softener
Neighborhood map
What this means for you Summary
Snapshot
- This is a 3-bed/3.0-bath single-family listed at $335k.
Deal economics
- At list price, monthly cash flow is $71 ($848/yr) — positive.
- The deal already cash-flows at list — no discount required.
- To meet the 1% rule (rent ≥ 1% of price), the offer needs to be $270k (19.4% below list).
- Recommended offer: $270k (19.4% below list) — sets the bar for 1% rule.
Location & tenants
- Location reads 68/100 on livability (#514 in FL) — a middle-class / working-renter tenant base. Strengths: crime A+, employment A+, housing A+; Watch: amenities F, commute F, health & safety D-.
- Lee (suburban): math 47% / reading 50% proficiency, ranked #42 of 73 in FL (top 58%) — families likely to look elsewhere, expect single-tenant / working-renter base with shorter leases.
- Zoned schools: Veterans Park Academy For The Arts (math 41% / reading 45%, grade F, #1,366 of 2,144 statewide, top 64%, 2,133 students, 36% FRL); Oak Hammock Middle School (math 43% / reading 41%, grade D-, #340 of 571 statewide, top 61%, 1,563 students, 56% FRL); Lehigh Senior High School (math 23% / reading 45%, grade F, #394 of 667 statewide, top 60%, 2,476 students, 57% FRL).
- Market conditions: 460 active listings in the ZIP; 2 comparable units currently listed for rent nearby; 15,411 units permitted in Lee County in 2024 (4,686 in 5+ unit buildings).
Forward outlook
- Local home prices are declining (-3.0%/yr); year-one equity from $2k of loan paydown is wiped out by about $10k of value loss. Plan a longer hold.
- Lee County population projected at +44% by 2050 — long-run rental-demand tailwind backs the buy-and-hold thesis.
Negotiation context
- Only 4 days on market — expect competitive offers; lowballing is unlikely to land.
Risks & watch-outs
- Climate carrying-cost: severe wind risk, 99% chance of damaging wind over 30y; moderate wildfire risk; extreme-heat days projected 7→27/yr by 2055 (HVAC capex compounding) — expect insurance premiums to compound above CPI over the hold.
Questions for the listing agent
- Is there a deadline driving the sale (1031 exchange, divorce, estate, relocation)? That informs how much negotiation room exists.
- The area grade is low — what's the realistic commute time and amenity access for the typical tenant pool here? Any planned neighborhood developments (good or bad) we should know about?
- What's the average days-on-market for RENTAL listings here right now (not sales)? A rising rental-DOM trend means longer vacancies and softer asking-rent achievability than the comps imply.
- What's the recent tenant-quality profile in this submarket — average credit score on applications, eviction rate, late-payment / NSF rate, and stable-employment percentage? A property-management company in the area should have these aggregated.
- How much new for-sale + rental construction is in the pipeline within 1–3 miles? Heavy new supply typically softens prices + rents 12–24 months out; constrained supply supports both.
Investment metrics
- 1% rule
- 0.81% ✗
- Cap rate
- 6.55%
- Cash-on-cash
- 0.90%
- DSCR
- 1.04
- GRM
- 10.3
CMA / ARV
- ARV (on-the-fly)
- $549,120
- Comps found
- 4
Show comp detail 4 sales within ~0.75 mi
| Address | Dist | Beds/Ba | Sqft | Sold | Price | $/sf | Match |
|---|---|---|---|---|---|---|---|
| 3945 Sweet Alyssum Ter | 0.40mi | 3/3.0 | 2,201 (+3%) | 8mo | $325,000 | $148 | 71 |
| 2110 Sebastian Ct | 0.50mi | 3/2.0 | 1,992 (-7%) | 8mo | $600,000 | $301 | 55 |
| 2171 Waylife Ct | 0.48mi | 3/2.0 | 2,403 (+12%) | 12mo | $419,000 | $174 | 43 |
| 2770 Styles Rd | 0.60mi | 3/2.0 | 1,837 (-14%) | 12mo | $470,000 | $256 | 34 |
Match score weights: distance 35% · size 25% · config 20% · recency 20%. Top-matched comps best support the ARV.
Projected returns pro-forma
-3.0% appreciation · 3.0% rent growth · sell at horizon
- IRR
- -14.9%
- Equity multiple
- 0.47×
- Total profit
- $-49,896
- Equity at exit
- $49,950
- IRR
- -6.3%
- Equity multiple
- 0.59×
- Total profit
- $-38,116
- Equity at exit
- $28,965
Cash invested: $93,800 (down + closing). Projections, not guarantees.
Landlord ↔ Tenant lean methodology
- Overall (STATE)
- 87 Strongly Landlord-Friendly
- State Florida
- 87 Strongly Landlord-Friendly · R+3
- County
- — inherits STATE
- City
- — inherits STATE
ZIP-level market 33920
- Home prices YoY
- -11.8%
- Active inventory
- 460
- Price-to-rent
- 10.3×
Monthly cashflow live
- Estimated rent
- $2,700 medium interval (Pro) →
- Mortgage (P&I)
- −$1,757
- Tax from tax record
- −$166 /mo · $1,991/yr
- Insurance
- −$140
- HOA
- −$0
- Vacancy / Maint / Mgmt
- −$567
- Net cashflow
- $71
Break-even live
Sensitivity live
| Price | -10% $260 | -5% $166 | +0% $71 | +5% $-24 | +10% $-119 |
|---|---|---|---|---|---|
| Rent | -10% $-143 | -5% $-36 | +0% $71 | +5% $177 | +10% $284 |
| Rate | -1.0pp $239 | -0.5pp $156 | base $71 | +0.5pp $-16 | +1.0pp $-104 |
UW: 25.0% down · 7.5% · 30yr · 1.5% tax · 5.0% vac · 8.0% maint · 8.0% mgmt
Financing live
Cash to close
- Down payment
- $83,750
- Closing costs
- $10,050
- Reserves months
- —
- Total cash needed
- —
Loan-product check · same deal, 3 products live
Conventional
25% down · 7.5% · 30yr
- Down + closing
- —
- Monthly P&I
- —
- Monthly cashflow
- —
- DSCR
- —
- Eligible?
- —
Personal DTI + credit; lowest rate.
DSCR
20% down · 8.5% · 30yr
- Down + closing
- —
- Monthly P&I
- —
- Monthly cashflow
- —
- DSCR
- —
- Eligible?
- —
No personal income docs; deal must DSCR.
Hard money
10% down · 12.0% · 12mo
- Down + closing
- —
- Monthly P&I
- —
- Monthly cashflow
- —
- DSCR
- —
- Eligible?
- —
Short-term bridge; refi at stabilization.
Rent comps 2 comps
| Address | Beds | Baths | Sqft | Rent | $/sqft | DOM | Units | Dist |
|---|---|---|---|---|---|---|---|---|
| 2111 Waylife Ct Alva, FL | 3.0 | 2.0 | 1661 | $2,700 | $1.63 | 5d | 1 | 0.55mi |
| 2111 Waylife Ct Alva, FL | 3.0 | 2.0 | 1661 | $2,700 | $1.63 | 25d | 1 | 0.55mi |
Listing history 3 events
-
2026-06-22statusdays on market $335,000 Pending 4 DOM
-
2026-06-17remarks 699-char remark
-
2026-06-17$335,000 Active 1 DOM
ⓘ Source: listings_history table (triggers on properties + properties_extension) + one-shot
backfill from property_details.listing_events for pre-trigger history.
Tax reassessment forecast FL · Resets to sale price
- Current annual tax
- $1,991 · $166/mo
- Projected year-2 tax
- $2,780 · $232/mo
- Expected delta
- +$789/yr (+$66/mo · 39.6%)
ⓘ Screening estimate from a state-policy table — verify with the county assessor before closing.
Climate risk First Street
- Flood 1/10 Low FEMA zone X (shaded) · 0% chance over 30 yrs
- Wildfire 5/10 Major
- Heat 9/10 Extreme 7 d/yr ≥108°F today · 27 d/yr by 30 yrs out
- Wind 10/10 Extreme 99% chance of damaging wind over 30 yrs
- Air quality 2/10 Low 2 unhealthy d/yr today · 2 by 30 yrs out
Nearby sold comps map
Loading sold comps map…
Walkable amenities ~0.75 mi
Loading nearby amenities…
Taxation est. · year 1
- Rental income
- $32,400
- − Mortgage interest
- −$18,765
- − Property taxes
- −$1,991
- − Insurance
- −$1,675
- − Repairs & maintenance
- −$2,592
- − Management
- −$2,592
- − Depreciation
- −$9,745
- Taxable loss
- −$4,961
- Est. tax savings @ 24.0%
- +$1,191
- After-tax cash flow
- $2,039/yr
For passive investors: Depreciation is non-cash, so a rental often shows a tax loss while cash-flowing — sheltering income. Rental losses are passive: they offset passive income freely, and up to $25,000/yr can offset ordinary (W-2) income if you actively participate and your MAGI is under $100k (phasing out to $0 by $150k); unused losses carry forward. On sale, claimed depreciation is recaptured at up to 25%, and gains may owe capital-gains tax (a 1031 exchange can defer both). Figures are a year-1 estimate at your 24.0% rate — not tax advice; consult a CPA.
Schools (NCES district)
- District
- Lee
- NCES district ID
- 1201080
- Math proficiency
- 47% ▼ -11.00%
- Reading proficiency
- 50% ▼ -4.00%
- Median HH income
- $49,518
- Composite
- 41.49/100
- National rank
- #3458
- State rank
- #42 of 73 in FL
Livability — Alva
- Score
- 68/100
- State rank
- #514
- US rank
- #9471
Category grades
Schools grade is shown separately in the Schools card above.
Census & demographics
- Census place
- Alva, FL
- Population (ZIP)
- 7,689
Population outlook (Lee County) Hauer SSP2
- Today (2025)
- 871,946 people
- By 2030
- 955,468 · +9.6%
- By 2040
- 1,113,587 · +27.7%
- By 2050
- 1,256,891 · +44.1%
- By 2075
- 1,560,270 · +78.9%
- By 2100
- 1,726,848 · +98.0%
Race, ethnicity, and origin ACS 2023
- Neighborhood character
- Predominantly White (82%)
- Race & ethnicity
- White 82% Hispanic / Latino 8% Two or more races 7% Asian 5% Black 1%
- Hispanic origin (detail)
- Mexican 3% Puerto Rican 2% Cuban 1%
- Common ancestry
- Romanian 6% Portuguese 5% German 3%
- Foreign-born
- 11% · Canada, Vietnam
- Languages at home
- 90% English-only · Spanish 5% Other Asian/Pacific 2% Vietnamese 2%
Political lean MEDSL · Lee
- 2024 margin
- Strong R (+28.4) · D 35.5% · R 63.9%
- 2008→2024 swing
- -18.0pp toward R · 2008: -10.4pp · 2024: -28.4pp
- All cycles
- 2024: R+28.4 2020: R+19.2 2016: R+20.4 2012: R+16.6 2008: R+10.4
Not yet ingested
- Civics
- —
Market trends
- HPI YoY
- ▼ -47.83%
- Current HPI
- 355.9229
- Rent YoY
- —
- Metro
- —
- State GDP YoY
- ▲ 3.28%
- F500 in state
- 36
Industry mix (Fortune 500 HQ in FL)
| Industry | F500 HQs | Revenue |
|---|---|---|
| Industrial Technology | 2 | $29B |
|
||
| Insurance | 2 | $17B |
|
||
| Retail | 1 | $60B |
|
||
| Technology Distribution | 1 | $58B |
|
||
| Homebuilding | 1 | $35B |
|
||
| Technology Manufacturing | 1 | $35B |
|
||
Price history
1 event — show timeline
- 2026-06-17 Listed $335,000 FORTMLS
Property tax history
+1.0%/yrLatest (2025): $1,991 · +5.2% YoY. Source: county tax records.
Cash-flow waterfall
monthlySold comps — $/sqft
last 12 mo · ≤1 miLoading sold comps…