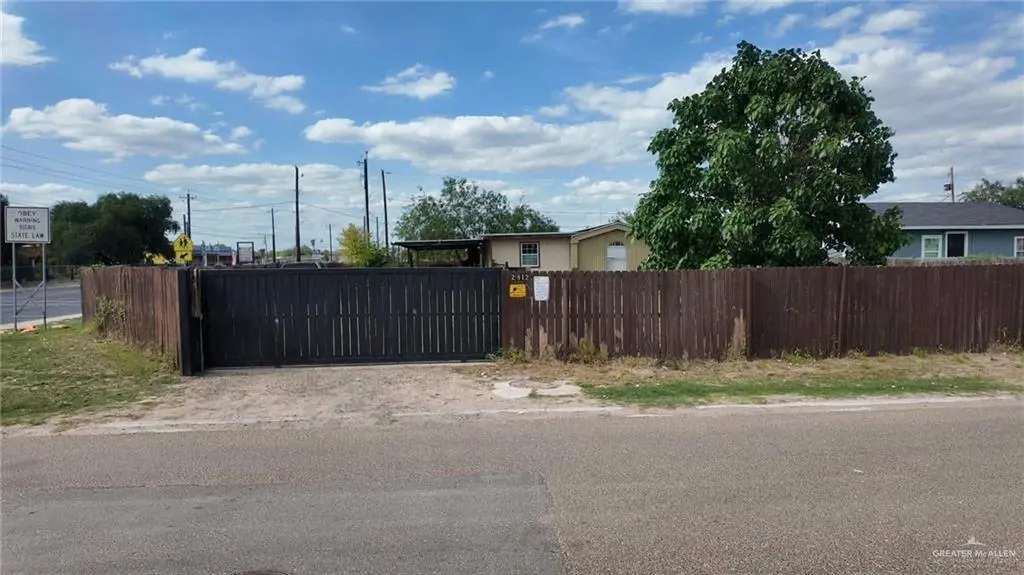
2812 La Dona St · La Homa, TX
Flood risk 1/10 · Minimal
- FEMA flood zone
- X
- Chance of flooding over 30 yrs
- 0.0%
- Est. flood insurance / yr
- $507 – $1,088
Fire risk 7/10 · Major
- Est. fire insurance / yr
- $1,222 – $2,270
Heat risk 9/10 · Severe
- Hot days now (above 112°F)
- 7 days/yr
- Hot days in 30 yrs
- 22 days/yr
Wind risk 8/10 · Major
- Chance of severe wind over 30 yrs
- 96.0%
Air-quality risk 1/10 · Minimal
- Unhealthy air days now
- 0 days/yr
- Unhealthy air days in 30 yrs
- 0 days/yr
Risk factors via First Street. Map © Google.
Why this score? — see what drove the D- grade
The composite is a weighted blend of 9 inputs, each scored 0–100. Each bar is that input's sub-score; the figure is the points it added to the 100-point composite (weight × sub-score).
- Cash flow +18.5/30.0
- DSCR +5.8/10.0
- 1% rule +4.6/10.0
- Livability +2.8/5.0
- Rent growth +2.5/5.0
- Schools +1.9/10.0
- Condition / age +1.0/5.0
- ARV discount +0.0/15.0
- Appreciation +0.0/10.0
$141,607
🖨 Deal sheet 📄 Offer letter ✓ Due diligence
Listing remarks
Spacious 4-bedroom, 3-bath mobile home featuring an attached unit and a functional layout designed for comfortable living. This property offers generous indoor and outdoor space, including a spacious patio area perfect for relaxing or entertaining. Conveniently located near schools and everyday amenities, the home includes laminate flooring, ceiling fans, covered parking for 2 vehicles, wood fencing, and a manual gate. Situated on a corner lot with paved street access and plenty of space inside and out to enjoy everyday living.
Key facts
- Laminate flooring
- Covered parking
- Ceiling fans
Tags
Property features AI
Finance
- Other: Building area approximately 1,653 square feet
- HOA & community: No association
Exterior
- Parking: 2 total parking spaces; 2 covered spaces; 2-car carport (attached; garage faces front)
- Utilities: Public water; City sewer
- Home design: Mobile home with double roof; Own lot
- Construction: Wood siding; Other construction materials; Pilings foundation
- Exterior features: Wood fencing; Corner lot; Paved road access; Curbs
Interior
- Kitchen: No conveying appliances
- Bedrooms: Living area(s): 1
- Flooring: Laminate flooring
- Bathrooms: 3 full bathrooms
- Heating & cooling: Electric heating; Electric cooling; Wall units and window units for cooling
- Interior features: Laminate countertops; Ceiling fan(s); No window coverings; Manual gate
- Laundry & utility: Laundry area; Washer and dryer (present)
Neighborhood map
What this means for you Summary
Snapshot
- This is a 2-bed/3.0-bath manufactured listed at $142k. Condition is rated poor.
Deal economics
- At list price, monthly cash flow is $134 ($2k/yr) — positive.
- The deal already cash-flows at list — no discount required.
- To meet the 1% rule (rent ≥ 1% of price), the offer needs to be $136k (3.8% below list).
- Recommended offer: $136k (3.8% below list) — sets the bar for 1% rule.
- Cap rate 7.4% vs local median 5.5% in La Homa — top-decile yield for the area; either an underpriced asset or a hidden risk that comps aren't pricing in. Stress-test before assuming the spread holds.
Location & tenants
- Location reads 56/100 on livability (#1,308 in TX) — a working-class tenant base; expect higher turnover. Strengths: cost of living A+, housing A-; Watch: crime F, amenities F, commute F.
- La Joya ISD (suburban): math 18% / reading 29% proficiency, ranked #759 of 826 in TX (top 92%) — low school quality limits family demand, transient renter base, plan for 1-2y turnover.
- Zoned schools: Diaz-Villarreal El (math 17% / reading 18%, grade F, #3,805 of 4,322 statewide, top 89%, 594 students, 97% FRL); Memorial Middle (math 24% / reading 30%, grade F, #1,177 of 1,662 statewide, top 72%, 700 students, 84% FRL); La Joya Palmview H S (math 20% / reading 37%, grade F, #1,157 of 1,632 statewide, top 72%, 2,155 students, 91% FRL) — zoned schools average 91% FRL vs 54% district-wide (37 pts higher); higher-poverty schools than district average — tighter screening recommended.
- Market conditions: 474 active listings in the ZIP; 10 comparable units currently listed for rent nearby; rentals lingering (median 44d on market — plan ~5-8 weeks vacancy on turnover, expect pricing pressure); 50% of comp listings sitting > 30 days — soft ceiling on asking rent; 7,378 units permitted in Hidalgo County in 2024 (641 in 5+ unit buildings).
- This rent runs 31% of the median local income ($52k/yr) — at the standard rent-burdened threshold; future hikes will face affordability resistance.
Forward outlook
- Local home prices are declining (-3.0%/yr); year-one equity from $979 of loan paydown is wiped out by about $4k of value loss. Plan a longer hold.
- Hidalgo County population projected at +28% by 2050 — long-run rental-demand tailwind backs the buy-and-hold thesis.
Negotiation context
- It's been on market 34 days — a 3% lower offer ($137k) is reasonable based on typical stale-listing flexibility.
Risks & watch-outs
- Climate carrying-cost: severe wind risk, 96% chance of damaging wind over 30y; major wildfire risk; extreme-heat days projected 7→22/yr by 2055 (HVAC capex compounding) — expect insurance premiums to compound above CPI over the hold.
Questions for the listing agent
- It's been on market 34 days. Have you received any prior offers? Is the seller open to a 4% concession, seller financing, or rate buy-down credit?
- Have any recent inspections been done? Can we get a copy of the seller's disclosures and any deferred-maintenance estimates?
- Is there a deadline driving the sale (1031 exchange, divorce, estate, relocation)? That informs how much negotiation room exists.
- Schools are F-rated, which usually means shorter tenancies and higher turnover. Who's the typical renter profile here, and what's been the actual vacancy rate?
- Crime grade is F in this area — have there been break-ins, vandalism, or insurance claims at this property in the last 3 years? What carrier currently insures it and at what premium?
- The area grade is low — what's the realistic commute time and amenity access for the typical tenant pool here? Any planned neighborhood developments (good or bad) we should know about?
- What's the average days-on-market for RENTAL listings here right now (not sales)? A rising rental-DOM trend means longer vacancies and softer asking-rent achievability than the comps imply.
- What's the recent tenant-quality profile in this submarket — average credit score on applications, eviction rate, late-payment / NSF rate, and stable-employment percentage? A property-management company in the area should have these aggregated.
- How much new for-sale + rental construction is in the pipeline within 1–3 miles? Heavy new supply typically softens prices + rents 12–24 months out; constrained supply supports both.
Investment metrics
- 1% rule
- 0.96% ✗
- Cap rate
- 7.43%
- Cash-on-cash
- 4.05%
- DSCR
- 1.18
- GRM
- 8.7
CMA / ARV
- ARV (median comp)
- $117,391
- List price
- $141,607
- Delta
- 20.63%
- Verdict
- OVERPRICED
- Comps
- 1 within 2.0 mi
Projected returns pro-forma
-3.0% appreciation · 3.0% rent growth · sell at horizon
- IRR
- -10.0%
- Equity multiple
- 0.64×
- Total profit
- $-14,425
- Equity at exit
- $21,114
- IRR
- -0.6%
- Equity multiple
- 0.96×
- Total profit
- $-1,592
- Equity at exit
- $12,244
Cash invested: $39,650 (down + closing). Projections, not guarantees.
Landlord ↔ Tenant lean methodology
- Overall (STATE)
- 87 Strongly Landlord-Friendly
- State Texas
- 87 Strongly Landlord-Friendly · R+5
- County
- — inherits STATE
- City
- — inherits STATE
ZIP-level market 78574
- Home prices YoY
- -16.1%
- Active inventory
- 474
- Price-to-rent
- 8.7×
Monthly cashflow live
- Estimated rent
- $1,363 high interval (Pro) →
- Mortgage (P&I)
- −$743
- Tax from tax record
- −$141 /mo · $1,692/yr
- Insurance
- −$59
- HOA
- −$0
- Vacancy / Maint / Mgmt
- −$286
- Net cashflow
- $134
Break-even live
UW: 25.0% down · 7.5% · 30yr · 1.5% tax · 5.0% vac · 8.0% maint · 8.0% mgmt
Financing live
Cash to close
- Down payment
- $35,402
- Closing costs
- $4,248
- Reserves months
- —
- Total cash needed
- —
Loan-product check · same deal, 3 products live
Conventional
25% down · 7.5% · 30yr
- Down + closing
- —
- Monthly P&I
- —
- Monthly cashflow
- —
- DSCR
- —
- Eligible?
- —
Personal DTI + credit; lowest rate.
DSCR
20% down · 8.5% · 30yr
- Down + closing
- —
- Monthly P&I
- —
- Monthly cashflow
- —
- DSCR
- —
- Eligible?
- —
No personal income docs; deal must DSCR.
Hard money
10% down · 12.0% · 12mo
- Down + closing
- —
- Monthly P&I
- —
- Monthly cashflow
- —
- DSCR
- —
- Eligible?
- —
Short-term bridge; refi at stabilization.
Rent comps 10 comps
| Address | Beds | Baths | Sqft | Rent | $/sqft | DOM | Units | Dist |
|---|---|---|---|---|---|---|---|---|
| 2904 W Harrison Ave Apt 2 Alton, TX | 3.0 | 2.0 | 1118 | $1,225 | $1.10 | 43d | 1 | 1.15mi |
| 2712 W Harrison Ave Unit 4 Alton, TX | 3.0 | 2.0 | 1118 | $1,225 | $1.10 | 43d | 1 | 1.15mi |
| 2708 W Harrison Ave Unit 4 Alton, TX | 3.0 | 2.0 | 1118 | $1,225 | $1.10 | 23d | 1 | 1.15mi |
| 2704 W Harrison Ave Unit 2 Alton, TX | 3.0 | 2.0 | 1119 | $1,225 | $1.09 | 23d | 1 | 1.15mi |
| 2805 W Harrison Ave Apt 2 Alton, TX | 3.0 | 2.0 | 1118 | $1,225 | $1.10 | 23d | 1 | 1.15mi |
| 2813 W Harrison Ave Apt 2 Alton, TX | 3.0 | 2.0 | 1118 | $1,225 | $1.10 | 44d | 1 | 1.15mi |
| 2805 W Harrison Ave Apt 2 Alton, TX | 3.0 | 2.0 | 1118 | $1,225 | $1.10 | 43d | 1 | 1.15mi |
| 2809 W Harrison Ave Unit 2 Alton, TX | 3.0 | 2.0 | 1118 | $1,225 | $1.10 | 43d | 1 | 1.15mi |
| 2813 W Harrison Ave Apt 2 Alton, TX | 3.0 | 2.0 | 1118 | $1,225 | $1.10 | 23d | 1 | 1.15mi |
| 1412 W Harrison Ave Unit 3 Alton, TX | 3.0 | 2.5 | 1200 | $975 | $0.81 | 21d | 1 | 1.43mi |
Listing history 19 events
-
2026-06-18days on market $141,607 Active 34 DOM
-
2026-06-17days on market $141,607 Active 33 DOM
-
2026-06-16days on market $141,607 Active 32 DOM
-
2026-06-15days on market $141,607 Active 31 DOM
-
2026-06-14days on market $141,607 Active 29 DOM
-
2026-06-13days on market $141,607 Active 28 DOM
-
2026-06-10days on market $141,607 Active 26 DOM
-
2026-06-09days on market $141,607 Active 25 DOM
-
2026-06-08days on market $141,607 Active 24 DOM
-
2026-06-07days on market $141,607 Active 23 DOM
-
2026-06-05days on market $141,607 Active 20 DOM
-
2026-06-03days on market $141,607 Active 19 DOM
-
2026-06-02days on market $141,607 Active 18 DOM
-
2026-06-01days on market $141,607 Active 17 DOM
-
2026-05-31days on market $141,607 Active 16 DOM
-
2026-05-31days on market $141,607 Active 15 DOM
-
2026-05-14$141,607 Active 533-char remark
-
2023-01-17soldstatus
-
2020-09-09soldstatus
ⓘ Source: listings_history table (triggers on properties + properties_extension) + one-shot
backfill from property_details.listing_events for pre-trigger history.
Tax reassessment forecast TX · Resets to sale price
- Current annual tax
- $1,692 · $141/mo
- Projected year-2 tax
- $2,591 · $216/mo
- Expected delta
- +$900/yr (+$75/mo · 53.2%)
ⓘ Screening estimate from a state-policy table — verify with the county assessor before closing.
Climate risk First Street
- Flood 1/10 Low FEMA zone X · 0% chance over 30 yrs
- Wildfire 7/10 Severe
- Heat 9/10 Extreme 7 d/yr ≥112°F today · 22 d/yr by 30 yrs out
- Wind 8/10 Severe 96% chance of damaging wind over 30 yrs
- Air quality 1/10 Low 0 unhealthy d/yr today · 0 by 30 yrs out
Nearby sold comps map
Loading sold comps map…
Walkable amenities ~0.75 mi
Loading nearby amenities…
Taxation est. · year 1
- Rental income
- $16,350
- − Mortgage interest
- −$7,932
- − Property taxes
- −$1,692
- − Insurance
- −$708
- − Repairs & maintenance
- −$1,308
- − Management
- −$1,308
- − Depreciation
- −$4,119
- Taxable loss
- −$717
- Est. tax savings @ 24.0%
- +$172
- After-tax cash flow
- $1,778/yr
For passive investors: Depreciation is non-cash, so a rental often shows a tax loss while cash-flowing — sheltering income. Rental losses are passive: they offset passive income freely, and up to $25,000/yr can offset ordinary (W-2) income if you actively participate and your MAGI is under $100k (phasing out to $0 by $150k); unused losses carry forward. On sale, claimed depreciation is recaptured at up to 25%, and gains may owe capital-gains tax (a 1031 exchange can defer both). Figures are a year-1 estimate at your 24.0% rate — not tax advice; consult a CPA.
Condition & rehab AI · 1 photo
This mobile home requires extensive repairs and updates to its exterior, interior, and systems, significantly impacting its value. Immediate attention to these issues is necessary to improve its condition and increase its resale or rental value.
Repairs flagged
- Major fencing — The fencing is visibly weathered and in poor condition.
- Major roof — The roof condition is unknown but likely poor given the overall condition.
- Major flooring — The flooring condition is unknown but likely poor given the overall condition.
- Major interior walls/paint — The interior walls and paint condition are unknown but likely poor given the overall condition.
- Major systems — The systems condition is unknown but likely poor given the overall condition.
- Major landscaping — The landscaping and curb appeal are unknown but likely poor given the overall condition.
Value-add opportunities
- Both repair and replace fencing — A new fence will improve both the curb appeal and the safety of the property.
- Both repair and replace roof — A new roof will improve the structural integrity and the overall appearance of the property.
- Both repair and replace flooring — New flooring will improve the living space and the overall appearance of the property.
- Both repair and paint interior walls — New paint will improve the interior appearance and the overall value of the property.
- Both repair and replace systems — Upgrading the systems will improve the functionality and the overall value of the property.
- Both landscape and improve curb appeal — A well-maintained landscape will improve the curb appeal and the overall value of the property.
Renovation cost estimate screening
| Repair item | Severity | Est. cost |
|---|---|---|
| fencing · The fencing is visibly weathered and in poor condition. | Major | $15,000–50,000 |
| roof · The roof condition is unknown but likely poor given the overall condition. | Major | $15,000–50,000 |
| flooring · The flooring condition is unknown but likely poor given the overall condition. | Major | $15,000–50,000 |
| interior walls/paint · The interior walls and paint condition are unknown but likely poor given the overall condition. | Major | $15,000–50,000 |
| systems · The systems condition is unknown but likely poor given the overall condition. | Major | $15,000–50,000 |
| landscaping · The landscaping and curb appeal are unknown but likely poor given the overall condition. | Major | $15,000–50,000 |
| Total estimated repair cost · 6 items | $90,000–300,000 |
Value-add ROI direction
- Both repair and replace fencing — A new fence will improve both the curb appeal and the safety of the property. ↑
- Both repair and replace roof — A new roof will improve the structural integrity and the overall appearance of the property. ↑
- Both repair and replace flooring — New flooring will improve the living space and the overall appearance of the property. ↑
- Both repair and paint interior walls — New paint will improve the interior appearance and the overall value of the property. ↑
- Both repair and replace systems — Upgrading the systems will improve the functionality and the overall value of the property. ↑
- Both landscape and improve curb appeal — A well-maintained landscape will improve the curb appeal and the overall value of the property. ↑
ⓘ Cost ranges are severity-bucket heuristics (US national rule-of-thumb). Get contractor quotes + a written scope before underwriting a rehab budget.
Schools (NCES district)
- District
- La Joya ISD
- NCES district ID
- 4826130
- Math proficiency
- 18% ▼ -35.00%
- Reading proficiency
- 29% ▼ -10.00%
- Median HH income
- $27,845
- Composite
- 18.65/100
- National rank
- #8891
- State rank
- #759 of 826 in TX
Livability — La Homa
- Score
- 56/100
- State rank
- #1308
- US rank
- #22643
Category grades
Schools grade is shown separately in the Schools card above.
Census & demographics
- Census place
- La Homa, TX
- County
- Hidalgo County · 623,128 people
- City population
- 62,456
- Metro
- McAllen-Edinburg-Mission, TX
- Population (ZIP)
- 62,456
- Household income
- $52,393
- Rent vs Own
- Severe rent burden
- 803.0
Population outlook (Hidalgo County) Hauer SSP2
- Today (2025)
- 955,232 people
- By 2030
- 1,009,774 · +5.7%
- By 2040
- 1,120,332 · +17.3%
- By 2050
- 1,225,036 · +28.2%
- By 2075
- 1,439,189 · +50.7%
- By 2100
- 1,533,429 · +60.5%
Race, ethnicity, and origin ACS 2023
- Neighborhood character
- Predominantly Hispanic (97%)
- Race & ethnicity
- Hispanic / Latino 97% Two or more races 62% White 2%
- Hispanic origin (detail)
- Mexican 93%
- Foreign-born
- 33% · Canada
- Languages at home
- 12% English-only · Spanish 87%
Political lean MEDSL · Hidalgo
- 2024 margin
- Toss-up / Even · D 48.1% · R 51.0%
- 2008→2024 swing
- -41.6pp toward R · 2008: 38.7pp · 2024: -2.9pp
- All cycles
- 2024: R+2.9 2020: D+17.1 2016: D+40.5 2012: D+41.8 2008: D+38.7
Not yet ingested
- Civics
- —
Market trends
- HPI YoY
- ▼ -44.13%
- Current HPI
- 230.3323
- Rent YoY
- —
- Metro
- McAllen-Edinburg-Mission, TX
- State GDP YoY
- ▲ 3.95%
- F500 in state
- 110
Industry mix (Fortune 500 HQ in TX)
| Industry | F500 HQs | Revenue |
|---|---|---|
| Energy | 16 | $1,198B |
|
||
| Technology | 5 | $198B |
|
||
| Engineering / Construction | 4 | $72B |
|
||
| Energy Services | 3 | $60B |
|
||
| Utilities | 3 | $41B |
|
||
| Healthcare | 2 | $330B |
|
||
Price history
3 events — show timeline
- 2026-05-14 Listed $141,607 MCALLENMLS
- 2023-01-17 Sold (Public Records) — Public Records
- 2020-09-09 Sold (Public Records) — Public Records
Property tax history
+8.4%/yrLatest (2025): $1,692 · -4.7% YoY. Source: county tax records.
Cash-flow waterfall
monthlySold comps — $/sqft
last 12 mo · ≤1 miLoading sold comps…