4004 Peck St · Santa Fe, TX
Flood risk 6/10 · Moderate
- FEMA flood zone
- X (unshaded)
- Chance of flooding over 30 yrs
- 0.74%
- Est. flood insurance / yr
- $507 – $1,088
Fire risk 3/10 · Minor
- Est. fire insurance / yr
- $1,222 – $2,270
Heat risk 10/10 · Severe
- Hot days now (above 109°F)
- 7 days/yr
- Hot days in 30 yrs
- 26 days/yr
Wind risk 9/10 · Severe
- Chance of severe wind over 30 yrs
- 99.0%
Air-quality risk 2/10 · Minimal
- Unhealthy air days now
- 1 days/yr
- Unhealthy air days in 30 yrs
- 1 days/yr
Risk factors via First Street. Map © Google.
Why this score? — see what drove the D grade
The composite is a weighted blend of 9 inputs, each scored 0–100. Each bar is that input's sub-score; the figure is the points it added to the 100-point composite (weight × sub-score).
- Cash flow +15.0/30.0
- 1% rule +5.0/10.0
- DSCR +5.0/10.0
- Schools +3.5/10.0
- Livability +3.4/5.0
- ARV discount +2.5/15.0
- Rent growth +2.5/5.0
- Condition / age +2.5/5.0
- Appreciation +2.0/10.0
$417,000
🖨 Deal sheet (PDF) 📄 Offer letter ✓ Due diligence
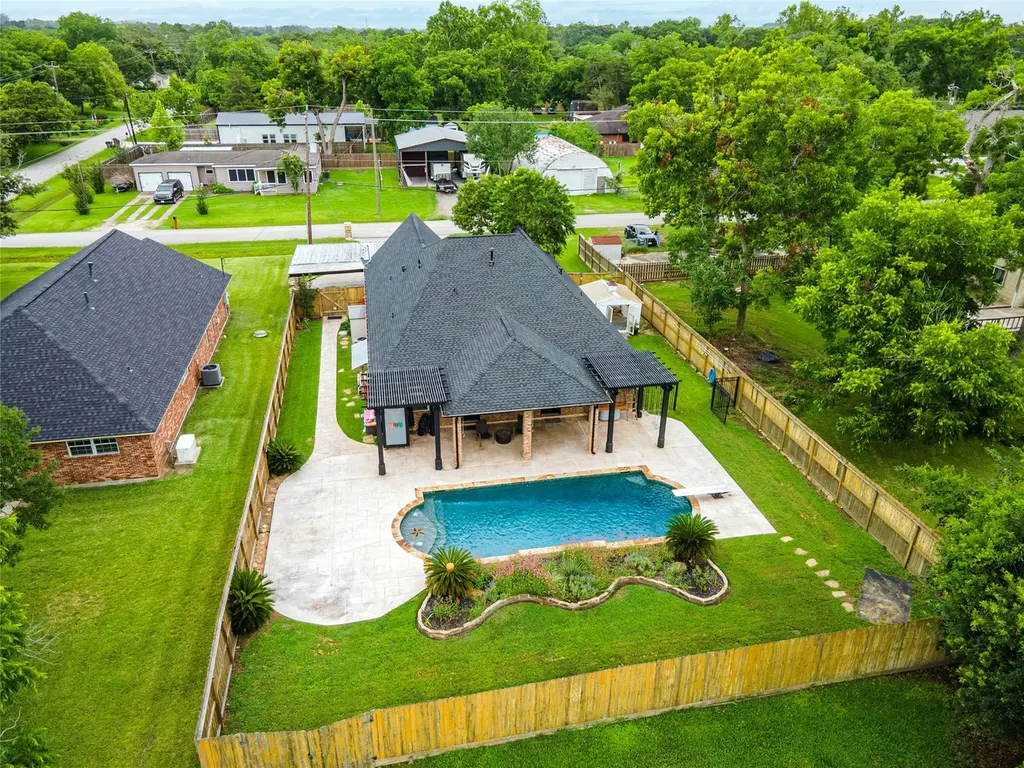
Listing remarks
CUSTOM CUSTOM CUSTOM!!! This place lacks nothing! A retreat like escape in the heart of Santa Fe, this home gives instant zen even as you enter the neighborhood with large trees and oversized lots creating a forest canopy type feel. Stepping into the house you're greeted with detail like none other including hand crafted shelving, a shiplap laundry room conveniently located off the garage, an accent wall in the dining area adjacent the spacious kitchen with updates such as a butcher block island, subway tile and eloquently lit light fixtures. Make your way to the master suite with a closet made for 2 and a wet room straight out of a magazine! Boasting fashioned wainscoting, more defined lig
Key facts
- Oversized lots
- Large trees
- Wet room
Tags
Property features AI
Exterior
- Parking: Attached 2-car garage
- Utilities: Public water; Public sewer
- Home design: Residential property; Single-story entry (all main living on first floor)
- Construction: Brick construction; Built in 2008; Slab foundation; Composition roof
- Exterior features: Private in-ground saltwater pool; Lot includes other/unspecified features
Interior
- Bedrooms: Primary bedroom on the first floor (approx. 16 x 16); Bedroom on the first floor (approx. 11 x 13); Bedroom on the first floor (approx. 10 x 13)
- Bathrooms: 2 full bathrooms
- Heating & cooling: Central heating (gas); Central electric air conditioning
- Interior features: 3 total rooms
Neighborhood map
What this means for you Summary
Snapshot
- This is a 3-bed/2.0-bath single-family listed at $417k.
Deal economics
- At list price, monthly cash flow is $15k ($179k/yr) — positive.
- The deal already cash-flows at list — no discount required.
- Meets the 1% rule at list price ($23k rent vs $417k).
- Cap rate 49.2% vs local median 4.5% in Santa Fe — top-decile yield for the area; either an underpriced asset or a hidden risk that comps aren't pricing in. Stress-test before assuming the spread holds.
Location & tenants
- Location reads 67/100 on livability (#550 in TX) — a middle-class / working-renter tenant base. Strengths: crime A+, cost of living A+, housing A+; Watch: amenities F, commute F, health & safety F.
- Santa Fe ISD (suburban): math 38% / reading 39% proficiency, ranked #385 of 826 in TX (top 47%) — families likely to look elsewhere, expect single-tenant / working-renter base with shorter leases.
- Zoned schools: Roy J Wollam El (math 44% / reading 44%, grade F, #1,243 of 4,322 statewide, top 29%, 627 students, 60% FRL); Santa Fe J H (math 34% / reading 37%, grade F, #827 of 1,662 statewide, top 51%, 1,009 students, 52% FRL); Santa Fe H S (math 19% / reading 34%, grade F, #1,228 of 1,632 statewide, top 76%, 1,369 students, 47% FRL) — zoned schools average 53% FRL vs 35% district-wide (18 pts higher); higher-poverty schools than district average — tighter screening recommended.
- Market conditions: 85 active listings in the ZIP; 2 comparable units currently listed for rent nearby; 3,258 units permitted in Galveston County in 2024 (0 in 5+ unit buildings).
Forward outlook
- Local home prices are declining (-3.0%/yr); year-one equity from $3k of loan paydown is wiped out by about $13k of value loss. Plan a longer hold.
- Galveston County population projected at +43% by 2050 — long-run rental-demand tailwind backs the buy-and-hold thesis.
- At projected returns (-3.0% appreciation + 3.0% rent growth), your $117k cash investment doubles in ~1 year — after that, you're playing with house money.
Negotiation context
- Only 12 days on market — expect competitive offers; lowballing is unlikely to land.
Risks & watch-outs
- Climate carrying-cost: major flood risk; severe wind risk, 99% chance of damaging wind over 30y; extreme-heat days projected 7→26/yr by 2055 (HVAC capex compounding) — expect insurance premiums to compound above CPI over the hold.
Questions for the listing agent
- Is there a deadline driving the sale (1031 exchange, divorce, estate, relocation)? That informs how much negotiation room exists.
- The area grade is low — what's the realistic commute time and amenity access for the typical tenant pool here? Any planned neighborhood developments (good or bad) we should know about?
- What's the average days-on-market for RENTAL listings here right now (not sales)? A rising rental-DOM trend means longer vacancies and softer asking-rent achievability than the comps imply.
- What's the recent tenant-quality profile in this submarket — average credit score on applications, eviction rate, late-payment / NSF rate, and stable-employment percentage? A property-management company in the area should have these aggregated.
- How much new for-sale + rental construction is in the pipeline within 1–3 miles? Heavy new supply typically softens prices + rents 12–24 months out; constrained supply supports both.
Investment metrics
- 1% rule
- 5.43% ✓
- Cap rate
- 49.21%
- Cash-on-cash
- 153.28%
- DSCR
- 7.82
- GRM
- 1.5
CMA / ARV
- ARV (on-the-fly)
- $375,060
- Comps found
- 12
Show comp detail 12 sales within ~0.75 mi
| Address | Dist | Beds/Ba | Sqft | Sold | Price | $/sf | Match |
|---|---|---|---|---|---|---|---|
| 3807 Wade St | 0.26mi | 3/1.5 | 1,803 (-9%) | 4mo | $305,000 | $169 | 68 |
| 3811 Anna Ct | 0.64mi | 3/2.0 | 1,995 (+1%) | 1mo | $264,900 | $133 | 67 |
| 15215 Laurel Oak Ln | 0.74mi | 3/2.0 | 2,027 (+3%) | 9mo | $341,060 | $168 | 54 |
| 15107 Laurel Oak Ln | 0.74mi | 3/2.0 | 2,027 (+3%) | 9mo | $361,540 | $178 | 54 |
| 15207 Laurel Oak Ln | 0.74mi | 3/2.0 | 2,027 (+3%) | 9mo | $338,000 | $167 | 54 |
| 15131 Laurel Oak Ln | 0.74mi | 3/2.0 | 2,027 (+3%) | 10mo | $392,672 | $194 | 53 |
| 14822 W 1st St | 0.49mi | 3/2.0 | 2,200 (+11%) | 8mo | $649,000 | $295 | 51 |
| 13726 Bunde Rd | 0.70mi | 4/2.0 (+1) | 2,046 (+4%) | 8mo | $450,000 | $220 | 50 |
| 4511 S Elm Ave | 0.74mi | 3/2.5 | 2,022 (+2%) | 12mo | $465,000 | $230 | 49 |
| 3915 Centennial Oaks Blvd | 0.73mi | 3/2.0 | 2,148 (+9%) | 9mo | $389,915 | $182 | 44 |
| 3919 Centennial Oaks Blvd | 0.72mi | 3/2.5 | 2,235 (+13%) | 8mo | $423,785 | $190 | 36 |
| 14705 8th St | 0.60mi | 4/2.5 (+1) | 1,712 (-13%) | 9mo | $359,000 | $210 | 36 |
Match score weights: distance 35% · size 25% · config 20% · recency 20%. Top-matched comps best support the ARV.
Projected returns pro-forma
-3.0% appreciation · 3.0% rent growth · sell at horizon
- IRR
- —
- Equity multiple
- 8.56×
- Total profit
- $882,680
- Equity at exit
- $62,176
- IRR
- —
- Equity multiple
- 18.07×
- Total profit
- $1,993,306
- Equity at exit
- $36,055
Cash invested: $116,760 (down + closing). Projections, not guarantees.
Landlord ↔ Tenant lean methodology
- Overall (STATE)
- 87 Strongly Landlord-Friendly
- State Texas
- 87 Strongly Landlord-Friendly · R+5
- County
- — inherits STATE
- City
- — inherits STATE
ZIP-level market 77517
- Home prices YoY
- -1.4%
- Active inventory
- 85
- Price-to-rent
- 1.5×
Monthly cashflow live
- Estimated rent
- $22,626 medium interval (Pro) →
- Mortgage (P&I)
- −$2,187
- Tax from tax record
- −$600 /mo · $7,203/yr
- Insurance
- −$174
- HOA
- −$0
- Vacancy / Maint / Mgmt
- −$4,751
- Net cashflow
- $14,914
Break-even live
Sensitivity live
| Price | -10% $15,150 | -5% $15,032 | +0% $14,914 | +5% $14,796 | +10% $14,678 |
|---|---|---|---|---|---|
| Rent | -10% $13,126 | -5% $14,020 | +0% $14,914 | +5% $15,807 | +10% $16,701 |
| Rate | -1.0pp $15,124 | -0.5pp $15,020 | base $14,914 | +0.5pp $14,806 | +1.0pp $14,696 |
UW: 25.0% down · 7.5% · 30yr · 1.5% tax · 5.0% vac · 8.0% maint · 8.0% mgmt
Financing live
Cash to close
- Down payment
- $104,250
- Closing costs
- $12,510
- Reserves months
- —
- Total cash needed
- —
Loan-product check · same deal, 3 products live
Conventional
25% down · 7.5% · 30yr
- Down + closing
- —
- Monthly P&I
- —
- Monthly cashflow
- —
- DSCR
- —
- Eligible?
- —
Personal DTI + credit; lowest rate.
DSCR
20% down · 8.5% · 30yr
- Down + closing
- —
- Monthly P&I
- —
- Monthly cashflow
- —
- DSCR
- —
- Eligible?
- —
No personal income docs; deal must DSCR.
Hard money
10% down · 12.0% · 12mo
- Down + closing
- —
- Monthly P&I
- —
- Monthly cashflow
- —
- DSCR
- —
- Eligible?
- —
Short-term bridge; refi at stabilization.
Rent comps 2 comps
| Address | Beds | Baths | Sqft | Rent | $/sqft | DOM | Units | Dist |
|---|---|---|---|---|---|---|---|---|
| 13342 Pecan Trails Dr Santa Fe, TX | 4.0 | 3.0 | 2150 | $2,700 | $1.26 | 45d | 1 | 0.80mi |
| 4120 Avenue O #10 Santa Fe, TX | 3.0 | 2.0 | 1280 | $74,621 | $58.30 | 45d | 1 | 1.47mi |
Listing history 8 events
-
2026-06-21days on market $417,000 Active 12 DOM
-
2026-06-18days on market $417,000 Active 9 DOM
-
2026-06-17days on market $417,000 Active 8 DOM
-
2026-06-16days on market $417,000 Active 7 DOM
-
2026-06-15days on market $417,000 Active 6 DOM
-
2026-06-13days on market $417,000 Active 4 DOM
-
2026-06-10remarks 699-char remark
-
2026-06-10$417,000 Active 1 DOM
ⓘ Source: listings_history table (triggers on properties + properties_extension) + one-shot
backfill from property_details.listing_events for pre-trigger history.
Tax reassessment forecast TX · Resets to sale price
- Current annual tax
- $7,203 · $600/mo
- Projected year-2 tax
- $7,631 · $636/mo
- Expected delta
- +$428/yr (+$36/mo · 5.9%)
ⓘ Screening estimate from a state-policy table — verify with the county assessor before closing.
Climate risk First Street
- Flood 6/10 Major FEMA zone X (unshaded) · 74% chance over 30 yrs
- Wildfire 3/10 Moderate
- Heat 10/10 Extreme 7 d/yr ≥109°F today · 26 d/yr by 30 yrs out
- Wind 9/10 Extreme 99% chance of damaging wind over 30 yrs
- Air quality 2/10 Low 1 unhealthy d/yr today · 1 by 30 yrs out
Nearby sold comps map
Loading sold comps map…
Walkable amenities ~0.75 mi
Loading nearby amenities…
Taxation est. · year 1
- Rental income
- $271,512
- − Mortgage interest
- −$23,358
- − Property taxes
- −$7,203
- − Insurance
- −$2,085
- − Repairs & maintenance
- −$21,721
- − Management
- −$21,721
- − Depreciation
- −$12,131
- Taxable income
- $183,292
- Est. tax owed @ 24.0%
- −$43,990
- After-tax cash flow
- $134,974/yr
For passive investors: Depreciation is non-cash, so a rental often shows a tax loss while cash-flowing — sheltering income. Rental losses are passive: they offset passive income freely, and up to $25,000/yr can offset ordinary (W-2) income if you actively participate and your MAGI is under $100k (phasing out to $0 by $150k); unused losses carry forward. On sale, claimed depreciation is recaptured at up to 25%, and gains may owe capital-gains tax (a 1031 exchange can defer both). Figures are a year-1 estimate at your 24.0% rate — not tax advice; consult a CPA.
Schools (NCES district)
- District
- Santa Fe ISD
- NCES district ID
- 4839270
- Math proficiency
- 38% ▼ -10.00%
- Reading proficiency
- 39% ▼ -2.00%
- Median HH income
- $66,769
- Composite
- 34.86/100
- National rank
- #5091
- State rank
- #385 of 826 in TX
Livability — Santa Fe
- Score
- 67/100
- State rank
- #550
- US rank
- #10637
Category grades
Schools grade is shown separately in the Schools card above.
Census & demographics
- Census place
- Santa Fe, TX
- Population (ZIP)
- 5,665
Population outlook (Galveston County) Hauer SSP2
- Today (2025)
- 390,640 people
- By 2030
- 425,226 · +8.9%
- By 2040
- 493,765 · +26.4%
- By 2050
- 559,698 · +43.3%
- By 2075
- 719,260 · +84.1%
- By 2100
- 819,628 · +109.8%
Race, ethnicity, and origin ACS 2023
- Neighborhood character
- Predominantly White (71%)
- Race & ethnicity
- White 71% Hispanic / Latino 21% Two or more races 8%
- Hispanic origin (detail)
- Mexican 20%
- Common ancestry
- Romanian 5% Italian 2% Serbian 1%
- Foreign-born
- 2% · Canada
- Languages at home
- 91% English-only · Spanish 8%
Political lean MEDSL · Galveston
- 2024 margin
- Strong R (+27.4) · D 35.7% · R 63.1% · Other 1.2%
- 2008→2024 swing
- -7.9pp toward R · 2008: -19.5pp · 2024: -27.4pp
- All cycles
- 2024: R+27.4 2020: R+22.6 2016: R+22.6 2012: R+26.9 2008: R+19.5
Not yet ingested
- Civics
- —
Market trends
- HPI YoY
- ▼ -5.93%
- Current HPI
- 420.72
- Rent YoY
- —
- Metro
- —
- State GDP YoY
- ▲ 3.95%
- F500 in state
- 110
Industry mix (Fortune 500 HQ in TX)
| Industry | F500 HQs | Revenue |
|---|---|---|
| Energy | 16 | $1,198B |
|
||
| Technology | 5 | $198B |
|
||
| Engineering / Construction | 4 | $72B |
|
||
| Energy Services | 3 | $60B |
|
||
| Utilities | 3 | $41B |
|
||
| Healthcare | 2 | $330B |
|
||
Price history
2 events — show timeline
- 2026-06-09 Listed $417,000 HARMLS
- 2008-11-25 Sold (Public Records) — Public Records
Property tax history
+3.2%/yrLatest (2025): $7,203 · +6.7% YoY. Source: county tax records.
Cash-flow waterfall
monthlySold comps — $/sqft
last 12 mo · ≤1 miLoading sold comps…