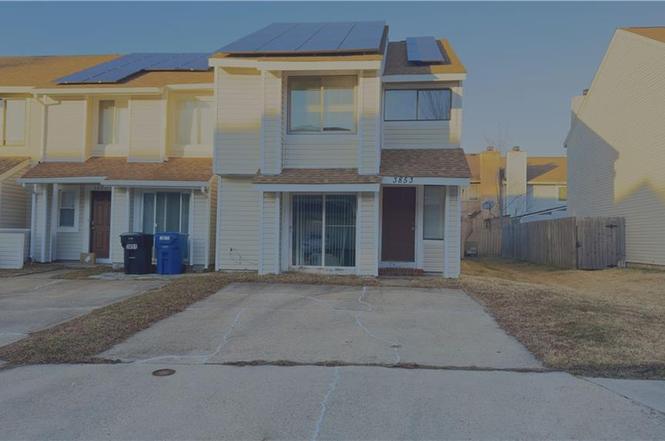
3853 Chimney Creek Dr · Virginia Beach, VA
Flood risk 1/10 · Minimal
- FEMA flood zone
- X (unshaded)
- Chance of flooding over 30 yrs
- 0.0%
- Est. flood insurance / yr
- $507 – $1,088
Fire risk 1/10 · Minimal
- Est. fire insurance / yr
- $666 – $1,236
Heat risk 9/10 · Severe
- Hot days now (above 104°F)
- 7 days/yr
- Hot days in 30 yrs
- 16 days/yr
Wind risk 8/10 · Major
- Chance of severe wind over 30 yrs
- 98.0%
Air-quality risk 3/10 · Minor
- Unhealthy air days now
- 2 days/yr
- Unhealthy air days in 30 yrs
- 4 days/yr
Risk factors via First Street. Map © Google.
Why this score? — see what drove the D+ grade
The composite is a weighted blend of 9 inputs, each scored 0–100. Each bar is that input's sub-score; the figure is the points it added to the 100-point composite (weight × sub-score).
- Cash flow +11.8/30.0
- ARV discount +10.8/15.0
- Schools +6.4/10.0
- Livability +4.2/5.0
- Rent growth +3.9/5.0
- DSCR +3.5/10.0
- 1% rule +2.8/10.0
- Condition / age +2.5/5.0
- Appreciation +0.0/10.0
$290,000
🖨 Deal sheet (PDF) 📄 Offer letter ✓ Due diligence
Listing remarks
Located in the heart of Chimney Hill, this 3-bedroom, 2.5-bath townhome offers strong upside for buyers ready to make it their own. The layout includes a spacious living area with fireplace, dedicated dining space, and three upstairs bedrooms, including a primary with ensuite bath. Private fenced patio adds outdoor space, and the community offers amenities including a pool. Centrally positioned near Town Center, shopping, dining, and major commuter routes.
Key facts
- Fenced patio
- Primary ensuite bath
- Community amenities
Tags
Neighborhood map
What this means for you Summary
Snapshot
- This is a 3-bed/2.5-bath townhouse listed at $290k.
Deal economics
- At list price, monthly cash flow is $-79 ($-942/yr) — negative.
- To cash-flow at today's rent, offer at most $276k (4.8% below list).
- To meet the 1% rule (rent ≥ 1% of price), the offer needs to be $227k (21.8% below list).
- Recommended offer: $227k (21.8% below list) — sets the bar for 1% rule.
- Cap rate 6.0% vs local median 3.5% in Virginia Beach — top-decile yield for the area; either an underpriced asset or a hidden risk that comps aren't pricing in. Stress-test before assuming the spread holds.
Location & tenants
- Location reads 83/100 on livability (#38 in VA, #880 nationally) — a professional / high-income tenant draw. Strengths: amenities A+, employment A+, housing A+; Watch: cost of living C-, commute F.
- Va Beach City Public School District (urban): math 69% / reading 78% proficiency, ranked #10 of 131 in VA (top 8%) — strong family-tenant draw, lease renewals of 3-5y typical.
- Zoned schools: White Oaks Elementary (math 51% / reading 64%, grade C+, #588 of 1,108 statewide, top 54%, 679 students, 54% FRL); Larkspur Middle (math 60% / reading 72%, grade A-, #113 of 342 statewide, top 33%, 1,536 students, 60% FRL); Green Run High (math 64% / reading 69%, grade B, #195 of 319 statewide, top 62%, 1,517 students, 69% FRL) — zoned schools average 61% FRL vs 28% district-wide (33 pts higher); higher-poverty schools than district average — tighter screening recommended.
- Market conditions: Rents rising fast (+5.6%/yr); 235 active listings in the ZIP; 40 comparable units currently listed for rent nearby; rentals at typical pace (median 17d on market — plan ~3-4 weeks tenant-placement turnaround); 666 units permitted in Virginia Beach city in 2024 (347 in 5+ unit buildings).
- This rent runs 39% of the median local income ($69k/yr) — at the standard rent-burdened threshold; future hikes will face affordability resistance.
Forward outlook
- Local home prices are declining (-3.0%/yr); year-one equity from $2k of loan paydown is wiped out by about $9k of value loss. Plan a longer hold.
- Virginia Beach County population projected at +6% by 2050 — modest demand growth; plan on rents tracking national, not racing it.
Negotiation context
- It's been on market 33 days — a 3% lower offer ($281k) is reasonable based on typical stale-listing flexibility.
- 4 sale attempts since 7y ago; this cycle's ask is 18% above the opening price — seller raised mid-cycle; expect resistance to lowballs.
- Current owner paid $195k; 49% above their basis — modest negotiation headroom, anchor on the comps not their cost.
Risks & watch-outs
- Climate carrying-cost: severe wind risk, 98% chance of damaging wind over 30y; extreme-heat days projected 7→16/yr by 2055 (HVAC capex compounding) — expect insurance premiums to compound above CPI over the hold.
Questions for the listing agent
- What do current leases actually rent for vs. the listed asking? Can we see a recent rent roll and the last 12 months of T-12 income?
- It's been on market 33 days. Have you received any prior offers? Is the seller open to a 22% concession, seller financing, or rate buy-down credit?
- What does the HOA fee cover, when was the last increase, and are there any pending special assessments or reserve-fund shortfalls?
- Is there a deadline driving the sale (1031 exchange, divorce, estate, relocation)? That informs how much negotiation room exists.
- Schools are A-rated — typically a magnet for longer-tenancy family renters. What's the average tenant stay here, and is there a school-zone premium baked into asking?
- The area grade is low — what's the realistic commute time and amenity access for the typical tenant pool here? Any planned neighborhood developments (good or bad) we should know about?
- What's the average days-on-market for RENTAL listings here right now (not sales)? A rising rental-DOM trend means longer vacancies and softer asking-rent achievability than the comps imply.
- What's the recent tenant-quality profile in this submarket — average credit score on applications, eviction rate, late-payment / NSF rate, and stable-employment percentage? A property-management company in the area should have these aggregated.
- How much new for-sale + rental construction is in the pipeline within 1–3 miles? Heavy new supply typically softens prices + rents 12–24 months out; constrained supply supports both.
Investment metrics
- 1% rule
- 0.78% ✗
- Cap rate
- 5.97%
- Cash-on-cash
- -1.16%
- DSCR
- 0.95
- GRM
- 10.7
CMA / ARV
- ARV (on-the-fly)
- $313,035
- Comps found
- 12
Show comp detail 12 sales within ~0.75 mi
| Address | Dist | Beds/Ba | Sqft | Sold | Price | $/sf | Match |
|---|---|---|---|---|---|---|---|
| 3853 Chimney Creek Dr | 0.00mi | 3/2.5 | 1,527 (0%) | 1mo | $290,000 | $190 | 99 |
| 3817 Chimney Creek Dr | 0.08mi | 3/2.5 | 1,527 (0%) | 1mo | $285,000 | $187 | 96 |
| 3612 Essex Pond Quay | 0.09mi | 3/2.5 | 1,568 (+3%) | 1mo | $280,000 | $179 | 90 |
| 718 Woodbox Dr | 0.12mi | 2/2.5 (-1) | 1,391 (-9%) | 1mo | $275,000 | $198 | 74 |
| 906 Hunley Dr | 0.42mi | 3/2.5 | 1,595 (+4%) | 1mo | $350,000 | $219 | 72 |
| 887 Hunley Dr | 0.43mi | 3/2.5 | 1,595 (+4%) | 0mo | $366,000 | $229 | 72 |
| 716 Woodbox Dr | 0.13mi | 2/1.5 (-1) | 1,368 (-10%) | 0mo | $281,000 | $205 | 68 |
| 3781 Chancery Ln | 0.47mi | 3/2.5 | 1,632 (+7%) | 0mo | $311,000 | $191 | 66 |
| 3650 Arthur Ave | 0.41mi | 3/1.5 | 1,404 (-8%) | 1mo | $285,000 | $203 | 63 |
| 3920 Filbert Way | 0.54mi | 3/2.5 | 1,688 (+10%) | 1mo | $349,000 | $207 | 56 |
| 732 Garfield Ave | 0.52mi | 3/1.5 | 1,367 (-10%) | 1mo | $304,000 | $222 | 54 |
| 3911 Van Ness Dr | 0.62mi | 3/2.5 | 1,688 (+10%) | 0mo | $354,900 | $210 | 53 |
Match score weights: distance 35% · size 25% · config 20% · recency 20%. Top-matched comps best support the ARV.
Projected returns pro-forma
-3.0% appreciation · 5.61% rent growth · sell at horizon
- IRR
- -15.5%
- Equity multiple
- 0.43×
- Total profit
- $-45,935
- Equity at exit
- $43,240
- IRR
- -3.4%
- Equity multiple
- 0.75×
- Total profit
- $-20,194
- Equity at exit
- $25,074
Cash invested: $81,200 (down + closing). Projections, not guarantees.
Landlord ↔ Tenant lean methodology
- Overall (STATE)
- 55 Moderately Landlord-Leaning
- State Virginia
- 55 Moderately Landlord-Leaning · D+2
- County
- — inherits STATE
- City
- — inherits STATE
ZIP-level market 23462
- Rents YoY
- 5.6%
- Active inventory
- 235
- Price-to-rent
- 10.7×
Monthly cashflow live
- Estimated rent
- $2,267 high interval (Pro) →
- Mortgage (P&I)
- −$1,521
- Tax from tax record
- −$203 /mo · $2,434/yr
- Insurance
- −$121
- HOA
- −$25
- Lot rent
- −$0
- Vacancy / Maint / Mgmt
- −$476
- Net cashflow
- $-79
Break-even live
Sensitivity live
| Price | -10% $86 | -5% $4 | +0% $-79 | +5% $-161 | +10% $-243 |
|---|---|---|---|---|---|
| Rent | -10% $-258 | -5% $-168 | +0% $-79 | +5% $11 | +10% $101 |
| Rate | -1.0pp $68 | -0.5pp $-5 | base $-79 | +0.5pp $-154 | +1.0pp $-230 |
UW: 25.0% down · 7.5% · 30yr · 1.5% tax · 5.0% vac · 8.0% maint · 8.0% mgmt
Financing live
Cash to close
- Down payment
- $72,500
- Closing costs
- $8,700
- Reserves months
- —
- Total cash needed
- —
Loan-product check · same deal, 3 products live
Conventional
25% down · 7.5% · 30yr
- Down + closing
- —
- Monthly P&I
- —
- Monthly cashflow
- —
- DSCR
- —
- Eligible?
- —
Personal DTI + credit; lowest rate.
DSCR
20% down · 8.5% · 30yr
- Down + closing
- —
- Monthly P&I
- —
- Monthly cashflow
- —
- DSCR
- —
- Eligible?
- —
No personal income docs; deal must DSCR.
Hard money
10% down · 12.0% · 12mo
- Down + closing
- —
- Monthly P&I
- —
- Monthly cashflow
- —
- DSCR
- —
- Eligible?
- —
Short-term bridge; refi at stabilization.
Rent comps 40 comps
| Address | Beds | Baths | Sqft | Rent | $/sqft | DOM | Units | Dist |
|---|---|---|---|---|---|---|---|---|
| 724 Harbor Springs Trl Virginia Beach, VA | 2.0 | 2.0 | 1200 | $1,795 | $1.50 | 14d | 1 | 0.16mi |
| 3620 Dryden Ct Virginia Beach, VA | 3.0 | 2.5 | 1678 | $2,500 | $1.49 | 0d | 1 | 0.22mi |
| 3700 Snowdrift Cir Virginia Beach, VA | 1.0–3.0 | 1.0–2.0 | 887 | $2,599 | $2.93 | 26d | 1 | 0.23mi |
| 3841 Forrester Ln Virginia Beach, VA | 3.0 | 2.0 | 1522 | $2,300 | $1.51 | 26d | 1 | 0.30mi |
| 701 Arthur Ave Virginia Beach, VA | 4.0 | 1.5 | 1404 | $2,500 | $1.78 | 19d | 1 | 0.34mi |
| 717 Grant Ave Virginia Beach, VA | 3.0 | 2.5 | 1248 | $2,160 | $1.73 | 26d | 1 | 0.36mi |
| 640 Counselor Sq Virginia Beach, VA | 3.0 | 1.5 | 1320 | $2,000 | $1.52 | 17d | 1 | 0.38mi |
| 629 Counselor Sq Virginia Beach, VA | 3.0 | 1.5 | 1326 | $1,995 | $1.50 | 26d | 1 | 0.41mi |
| 846 Crashaw St Virginia Beach, VA | 2.0 | 2.0 | 1346 | $1,895 | $1.41 | 17d | 1 | 0.42mi |
| 3816 Banyan Grove Ln Virginia Beach, VA | 1.0–3.0 | 1.0–2.0 | 1021 | $3,082 | $3.02 | 0d | 17 | 0.44mi |
| 621 Chancery Sq Virginia Beach, VA | 3.0 | 1.0 | 1320 | $1,970 | $1.49 | 19d | 1 | 0.48mi |
| 713 Willow Lake Cir Virginia Beach, VA | 1.0–2.0 | 1.0–2.0 | 1041 | $2,475 | $2.38 | 26d | 1 | 0.48mi |
| 3923 Lake Front Cir Virginia Beach, VA | 1.0–2.0 | 1.0 | 918 | $1,845 | $2.01 | 13d | 1 | 0.60mi |
| 4016 Richard Lee Ct Virginia Beach, VA | 3.0 | 1.5 | 1470 | $2,100 | $1.43 | 4d | 1 | 0.61mi |
| 3564 Faraday Ln Virginia Beach, VA | 4.0 | 2.5 | 1700 | $2,600 | $1.53 | 26d | 1 | 0.61mi |
| 833 Tamarack Ct Virginia Beach, VA | 3.0 | 2.0 | 1650 | $2,100 | $1.27 | 18d | 1 | 0.69mi |
| 3560 Windmill Dr Virginia Beach, VA | 3.0 | 1.5 | 1080 | $2,000 | $1.85 | 0d | 1 | 0.82mi |
| 807 Foxmoore Ct Virginia Beach, VA | 2.0 | 2.5 | 1125 | $2,000 | $1.78 | 5d | 1 | 0.86mi |
| 643 Orangewood Dr Virginia Beach, VA | 3.0 | 2.0 | 1571 | $2,495 | $1.59 | 26d | 1 | 0.87mi |
| 3596 Windmill Dr Virginia Beach, VA | 2.0 | 1.5 | 1088 | $1,850 | $1.70 | 0d | 1 | 0.89mi |
| 4217 S Plaza Trl Virginia Beach, VA | 1.0–2.0 | 1.0–2.0 | 1450 | $2,325 | $1.60 | 13d | 1 | 0.93mi |
| 3504 Shawn Ct Virginia Beach, VA | 4.0 | 2.5 | 1669 | $2,650 | $1.59 | 26d | 1 | 0.99mi |
| 3632 Silina Dr Virginia Beach, VA | 4.0 | 2.5 | 1666 | $2,495 | $1.50 | 10d | 1 | 1.10mi |
| 4133 Shoreline Cir Virginia Beach, VA | 1.0–2.0 | 1.0–2.0 | 964 | $2,000 | $2.07 | 13d | 1 | 1.20mi |
| 1500 Chase Arbor Cmn Virginia Beach, VA | 1.0–3.0 | 1.0–2.0 | 1095 | $2,629 | $2.40 | 0d | 27 | 1.20mi |
| 4119 Eastham Rd Virginia Beach, VA | 3.0 | 2.0 | 1505 | $3,800 | $2.52 | 26d | 1 | 1.22mi |
| 3517 Plum Cres Virginia Beach, VA | 3.0 | 2.0 | 1450 | $2,200 | $1.52 | 14d | 1 | 1.23mi |
| 1409 Northface Ct Virginia Beach, VA | 2.0 | 1.5 | 1178 | $1,750 | $1.49 | 10d | 1 | 1.25mi |
| 3521 Sierra Arch Virginia Beach, VA | 3.0 | 1.5 | 1420 | $1,650 | $1.16 | 26d | 1 | 1.25mi |
| 1401 Wendfield Dr #103 Virginia Beach, VA | 3.0 | 1.5 | 1344 | $1,850 | $1.38 | 22d | 1 | 1.28mi |
| 1404 Wendfield Dr #102 Virginia Beach, VA | 3.0 | 1.5 | 1344 | $2,000 | $1.49 | 26d | 1 | 1.29mi |
| 1404 Wendfield Dr #102 Virginia Beach, VA | 3.0 | 1.5 | 1344 | $2,000 | $1.49 | 6d | 1 | 1.29mi |
| 1404 Wendfield Dr Virginia Beach, VA | 3.0 | 1.5 | 1344 | $2,000 | $1.49 | 6d | 1 | 1.29mi |
| 4221 Old Lyne Rd Virginia Beach, VA | 3.0 | 2.5 | 1615 | $2,095 | $1.30 | 26d | 1 | 1.32mi |
| 3444 Terrazzo Trl Virginia Beach, VA | 3.0 | 2.0 | 1217 | $1,650 | $1.36 | 6d | 1 | 1.33mi |
| 4425 Duffy Dr Virginia Beach, VA | 2.0 | 2.5 | 1388 | $2,050 | $1.48 | 14d | 1 | 1.42mi |
| 3304 Weeping Willow Ln Virginia Beach, VA | 3.0 | 1.5 | 1254 | $1,750 | $1.40 | 26d | 1 | 1.44mi |
| 408 Lineberry Rd Virginia Beach, VA | 4.0 | 2.0 | 1561 | $2,700 | $1.73 | 26d | 1 | 1.46mi |
| 1523 Penrose Arch Virginia Beach, VA | 2.0 | 2.0 | 1126 | $1,550 | $1.38 | 6d | 1 | 1.47mi |
| 220 S Rosemont Rd Virginia Beach, VA | 4.0 | 2.0 | 1350 | $2,650 | $1.96 | 26d | 1 | 1.48mi |
HOA detail
- Monthly dues
- $25 · $300/yr
- Likely covers
- pool
Listing history 15 events
-
2026-03-17status Under Contract
-
2026-02-23historical Active Under Contract
-
2026-02-21price $290,000
-
2026-02-16price $275,000
-
2026-02-12$245,000 Active
-
2020-04-21soldstatus $195,000
-
2020-04-06status Under Contract
-
2020-03-09historical Active Under Contract
-
2020-03-04$195,000 Active
-
2020-01-03status Under Contract
-
2019-11-29historical Active Under Contract
-
2019-11-22$151,000 Active
-
2019-11-22$151 Active
-
2019-11-22historical
-
1989-01-23soldstatus $63,500
ⓘ Source: listings_history table (triggers on properties + properties_extension) + one-shot
backfill from property_details.listing_events for pre-trigger history.
Tax reassessment forecast VA · Resets to sale price
- Current annual tax
- $2,434 · $203/mo
- Projected year-2 tax
- $2,434 · $203/mo
- Expected delta
- $0/yr ($0/mo · 0.0%)
ⓘ Screening estimate from a state-policy table — verify with the county assessor before closing.
Climate risk First Street
- Flood 1/10 Low FEMA zone X (unshaded) · 0% chance over 30 yrs
- Wildfire 1/10 Low
- Heat 9/10 Extreme 7 d/yr ≥104°F today · 16 d/yr by 30 yrs out
- Wind 8/10 Severe 98% chance of damaging wind over 30 yrs
- Air quality 3/10 Moderate 2 unhealthy d/yr today · 4 by 30 yrs out
Nearby sold comps map
Loading sold comps map…
Walkable amenities ~0.75 mi
Loading nearby amenities…
Taxation est. · year 1
- Rental income
- $27,204
- − Mortgage interest
- −$16,245
- − Property taxes
- −$2,434
- − Insurance
- −$1,450
- − Repairs & maintenance
- −$2,176
- − Management
- −$2,176
- − HOA
- −$300
- − Depreciation
- −$8,436
- Taxable loss
- −$6,014
- Est. tax savings @ 24.0%
- +$1,443
- After-tax cash flow
- $501/yr
For passive investors: Depreciation is non-cash, so a rental often shows a tax loss while cash-flowing — sheltering income. Rental losses are passive: they offset passive income freely, and up to $25,000/yr can offset ordinary (W-2) income if you actively participate and your MAGI is under $100k (phasing out to $0 by $150k); unused losses carry forward. On sale, claimed depreciation is recaptured at up to 25%, and gains may owe capital-gains tax (a 1031 exchange can defer both). Figures are a year-1 estimate at your 24.0% rate — not tax advice; consult a CPA.
Schools (NCES district)
- District
- Va Beach City Public School District
- NCES district ID
- 5103840
- Math proficiency
- 69% ▼ -19.00%
- Reading proficiency
- 78% ▼ -7.00%
- Median HH income
- $66,452
- Composite
- 63.81/100
- National rank
- #594
- State rank
- #10 of 131 in VA
Livability — Virginia Beach
- Score
- 83/100
- State rank
- #38
- US rank
- #880
Category grades
Schools grade is shown separately in the Schools card above.
Census & demographics
- Census place
- Virginia Beach, VA
- County
- Virginia Beach City · 448,227 people
- City population
- 448,227
- Metro
- Virginia Beach-Norfolk-Newport News, VA-NC
- Population (ZIP)
- 66,151
- Household income
- $69,040
- Rent vs Own
- Severe rent burden
- 3906.0
Population outlook (Virginia Beach County) Hauer SSP2
- Today (2025)
- 480,401 people
- By 2030
- 491,221 · +2.3%
- By 2040
- 504,882 · +5.1%
- By 2050
- 508,847 · +5.9%
- By 2075
- 504,831 · +5.1%
- By 2100
- 465,867 · -3.0%
Race, ethnicity, and origin ACS 2023
- Neighborhood character
- Diverse neighborhood (Simpson 0.68)
- Race & ethnicity
- White 45% Black 32% Hispanic / Latino 12% Two or more races 10% Asian 5%
- Hispanic origin (detail)
- Mexican 4% Puerto Rican 3%
- Common ancestry
- Romanian 2% Italian 1% Slovak 1%
- Foreign-born
- 9% · Canada, China, Vietnam
- Languages at home
- 87% English-only · Spanish 6% Tagalog/Filipino 2% Other Asian/Pacific 1%
Political lean MEDSL · Virginia Beach
- 2024 margin
- Toss-up / Even · D 50.7% · R 48.0% · Other 1.3%
- 2008→2024 swing
- +3.4pp toward D · 2008: -0.7pp · 2024: 2.6pp
- All cycles
- 2024: D+2.6 2020: D+5.4 2016: R+4.5 2012: R+2.5 2008: R+0.7
Not yet ingested
- Civics
- —
Market trends
- HPI YoY
- ▼ -269.19%
- Current HPI
- 333.1908
- Rent YoY
- ▲ 5.61%
- Metro
- Virginia Beach-Norfolk-Newport News, VA-NC
- State GDP YoY
- ▲ 2.40%
- F500 in state
- 50
Industry mix (Fortune 500 HQ in VA)
| Industry | F500 HQs | Revenue |
|---|---|---|
| Aerospace / Defense | 4 | $236B |
|
||
| Technology / Defense | 3 | $32B |
|
||
| Financial Services | 2 | $176B |
|
||
| Utilities | 2 | $27B |
|
||
| Insurance | 2 | $25B |
|
||
| Technology | 2 | $15B |
|
||
Price history
+356.7% since first listed15 events — show timeline
- 2026-03-17 Pending — REINMLS
- 2026-02-23 Contingent — REINMLS
- 2026-02-21 Price Changed $290,000 REINMLS
- 2026-02-16 Price Changed $275,000 REINMLS
- 2026-02-12 Listed $245,000 REINMLS
- 2020-04-21 Sold (Public Records) $195,000 Public Records
- 2020-04-06 Pending — REINMLS
- 2020-03-09 Contingent — REINMLS
- 2020-03-04 Listed $195,000 REINMLS
- 2020-01-03 Pending — REINMLS
- 2019-11-29 Contingent — REINMLS
- 2019-11-22 Listing Removed — REINMLS
- 2019-11-22 Listed $151 REINMLS
- 2019-11-22 Listed $151,000 REINMLS
- 1989-01-23 Sold (Public Records) $63,500 Public Records
Property tax history
+4.7%/yrLatest (2025): $2,434 · +4.0% YoY. Source: county tax records.
Cash-flow waterfall
monthlySold comps — $/sqft
last 12 mo · ≤1 miLoading sold comps…