40 74th St · Guttenberg, NJ
Flood risk No data
- FEMA flood zone
- —
- Chance of flooding over 30 yrs
- —
- Est. flood insurance / yr
- —
Fire risk No data
- Est. fire insurance / yr
- —
Heat risk No data
- Hot days now (above threshold)
- —
- Hot days in 30 yrs
- —
Wind risk No data
- Chance of severe wind over 30 yrs
- —
Air-quality risk No data
- Unhealthy air days now
- —
- Unhealthy air days in 30 yrs
- —
Risk factors via First Street. Map © Google.
Why this score? — see what drove the D grade
The composite is a weighted blend of 9 inputs, each scored 0–100. Each bar is that input's sub-score; the figure is the points it added to the 100-point composite (weight × sub-score).
- Cash flow +14.7/30.0
- ARV discount +7.5/15.0
- DSCR +4.5/10.0
- Livability +4.1/5.0
- Rent growth +3.7/5.0
- 1% rule +3.2/10.0
- Condition / age +2.5/5.0
- Schools +2.2/10.0
- Appreciation +0.0/10.0
$357,000
🖨 Deal sheet (PDF) 📄 Offer letter ✓ Due diligence
Listing remarks
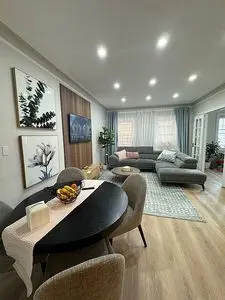
Experience modern living in this stunning 2-bedroom, 921-square-foot condominium, designed for comfort and style. Renovated in 2022, this spacious open-concept home features high ceilings, recessed lighting, and abundant natural light throughout. The fully furnished kitchen boasts contemporary appliances, while elegant wood paneling adds warmth and sophistication to the living room and bedrooms. Perfectly positioned right on Boulevard East, this residence offers breathtaking, unobstructed views of New York City. Steps from express bus transportation to Manhattan and just five streets from James J. Braddock North Hudson County Park & acirc; & euro; & rdquo; featuring tennis court
Key facts
- Built 1947
Neighborhood map
What this means for you Summary
Snapshot
- This is a 2-bed/1.0-bath single-family listed at $357k.
Deal economics
- At list price, monthly cash flow is $91 ($1k/yr) — positive.
- The deal already cash-flows at list — no discount required.
- To meet the 1% rule (rent ≥ 1% of price), the offer needs to be $293k (18.0% below list).
- Recommended offer: $293k (18.0% below list) — sets the bar for 1% rule.
- Cap rate 6.6% vs local median 2.3% in Guttenberg — top-decile yield for the area; either an underpriced asset or a hidden risk that comps aren't pricing in. Stress-test before assuming the spread holds.
Location & tenants
- Location reads 82/100 on livability (#51 in NJ, #1,253 nationally) — a professional / high-income tenant draw. Strengths: amenities A+, commute A+, health & safety A; Watch: cost of living F.
- North Bergen School District (suburban): math 12% / reading 37% proficiency, ranked #393 of 472 in NJ (top 83%) — low school quality limits family demand, transient renter base, plan for 1-2y turnover.
- Zoned schools: Robert Fulton Elementary School (math 16% / reading 44%, grade F, #721 of 1,303 statewide, top 56%, 880 students, 52% FRL); North Bergen High School (math 13% / reading 36%, grade F, #327 of 399 statewide, top 82%, 2,355 students, 50% FRL) — zoned schools at 51% FRL track the district average.
- Market conditions: Rents rising fast (+5.0%/yr); 210 active listings in the ZIP; 40 comparable units currently listed for rent nearby; rentals at typical pace (median 27d on market — plan ~3-4 weeks tenant-placement turnaround); solid renter incomes; 5,310 units permitted in Hudson County in 2024 (4,154 in 5+ unit buildings).
- This rent runs 44% of the median local income ($79k/yr) — at the standard rent-burdened threshold; future hikes will face affordability resistance.
Forward outlook
- Local home prices are declining (-3.0%/yr); year-one equity from $2k of loan paydown is wiped out by about $11k of value loss. Plan a longer hold.
- Hudson County population projected at +29% by 2050 — long-run rental-demand tailwind backs the buy-and-hold thesis.
Negotiation context
- Only 0 days on market — expect competitive offers; lowballing is unlikely to land.
- 4 sale attempts since 24y ago with the ask held roughly flat each time — persistent listings suggest the price (not the market) is what's stuck; bring a comps-based counter.
- Current owner paid $241k; 48% above their basis — modest negotiation headroom, anchor on the comps not their cost.
Risks & watch-outs
- Watch-outs: built in 1947 — expect roof / HVAC / electrical / plumbing capex.
Questions for the listing agent
- Built in 1947 — when were the roof, HVAC, electrical panel, plumbing, and water heater last replaced?
- Is there a deadline driving the sale (1031 exchange, divorce, estate, relocation)? That informs how much negotiation room exists.
- The area grade is low — what's the realistic commute time and amenity access for the typical tenant pool here? Any planned neighborhood developments (good or bad) we should know about?
- What's the average days-on-market for RENTAL listings here right now (not sales)? A rising rental-DOM trend means longer vacancies and softer asking-rent achievability than the comps imply.
- What's the recent tenant-quality profile in this submarket — average credit score on applications, eviction rate, late-payment / NSF rate, and stable-employment percentage? A property-management company in the area should have these aggregated.
- How much new for-sale + rental construction is in the pipeline within 1–3 miles? Heavy new supply typically softens prices + rents 12–24 months out; constrained supply supports both.
Investment metrics
- 1% rule
- 0.82% ✗
- Cap rate
- 6.60%
- Cash-on-cash
- 1.09%
- DSCR
- 1.05
- GRM
- 10.2
CMA / ARV
No comps found within radius.
Projected returns pro-forma
-3.0% appreciation · 4.99% rent growth · sell at horizon
- IRR
- -12.6%
- Equity multiple
- 0.54×
- Total profit
- $-46,175
- Equity at exit
- $53,230
- IRR
- -1.0%
- Equity multiple
- 0.92×
- Total profit
- $-7,632
- Equity at exit
- $30,867
Cash invested: $99,960 (down + closing). Projections, not guarantees.
Landlord ↔ Tenant lean methodology
- Overall (STATE)
- 21 Tenant-Leaning
- State New Jersey
- 21 Tenant-Leaning · D+6
- County
- — inherits STATE
- City
- — inherits STATE
ZIP-level market 07047
- Home prices YoY
- -31.5%
- Rents YoY
- 5.0%
- Active inventory
- 210
- Price-to-rent
- 10.2×
Monthly cashflow live
- Estimated rent
- $2,926 high interval (Pro) →
- Mortgage (P&I)
- −$1,872
- Tax from tax record
- −$200 /mo · $2,394/yr
- Insurance
- −$149
- HOA
- −$0
- Vacancy / Maint / Mgmt
- −$614
- Net cashflow
- $91
Break-even live
Sensitivity live
| Price | -10% $293 | -5% $192 | +0% $91 | +5% $-10 | +10% $-111 |
|---|---|---|---|---|---|
| Rent | -10% $-140 | -5% $-24 | +0% $91 | +5% $207 | +10% $322 |
| Rate | -1.0pp $271 | -0.5pp $182 | base $91 | +0.5pp $-1 | +1.0pp $-95 |
UW: 25.0% down · 7.5% · 30yr · 1.5% tax · 5.0% vac · 8.0% maint · 8.0% mgmt
Financing live
Cash to close
- Down payment
- $89,250
- Closing costs
- $10,710
- Reserves months
- —
- Total cash needed
- —
Loan-product check · same deal, 3 products live
Conventional
25% down · 7.5% · 30yr
- Down + closing
- —
- Monthly P&I
- —
- Monthly cashflow
- —
- DSCR
- —
- Eligible?
- —
Personal DTI + credit; lowest rate.
DSCR
20% down · 8.5% · 30yr
- Down + closing
- —
- Monthly P&I
- —
- Monthly cashflow
- —
- DSCR
- —
- Eligible?
- —
No personal income docs; deal must DSCR.
Hard money
10% down · 12.0% · 12mo
- Down + closing
- —
- Monthly P&I
- —
- Monthly cashflow
- —
- DSCR
- —
- Eligible?
- —
Short-term bridge; refi at stabilization.
Rent comps 40 comps
| Address | Beds | Baths | Sqft | Rent | $/sqft | DOM | Units | Dist |
|---|---|---|---|---|---|---|---|---|
| 7430 Boulevard E Unit 4A North Bergen, NJ | 2.0 | 1.0 | 991 | $3,500 | $3.53 | 26d | 1 | 0.12mi |
| 116 71st St #14 Guttenberg, NJ | 2.0 | 1.0 | 700 | $2,500 | $3.57 | 9d | 1 | 0.16mi |
| 134 71st St Unit GR Guttenberg, NJ | 1.0 | 1.0 | 1000 | $1,750 | $1.75 | 26d | 1 | 0.17mi |
| 140 71st St Unit 8 Guttenberg, NJ | 3.0 | 2.0 | 1100 | $2,750 | $2.50 | 19d | 1 | 0.18mi |
| 7855 Boulevard East North Bergen, NJ | 1.0 | 1.0–1.5 | 781 | $2,775 | $3.55 | 23d | 3 | 0.20mi |
| 7601 River Rd North Bergen, NJ | 1.0–3.0 | 1.0–3.0 | 1300 | $5,198 | $4.00 | 0d | 16 | 0.21mi |
| 7606 River Rd Unit 02 North Bergen, NJ | 1.0 | 1.0 | 900 | $3,490 | $3.88 | 26d | 1 | 0.22mi |
| 148 70th St Unit 401 Guttenberg, NJ | 2.0 | 2.0 | 1100 | $3,250 | $2.95 | 19d | 1 | 0.24mi |
| 148 70th St Unit 401 Guttenberg, NJ | 2.0 | 2.0 | 1100 | $3,250 | $2.95 | 26d | 1 | 0.24mi |
| 148 70th St Unit 303 Guttenberg, NJ | 1.0 | 1.0 | 753 | $2,400 | $3.19 | 19d | 1 | 0.24mi |
| 148 70th St Unit 303 Guttenberg, NJ | 1.0 | 1.0 | 753 | $2,400 | $3.19 | 26d | 1 | 0.24mi |
| 74 69th St Unit 3B Guttenberg, NJ | 1.0 | 1.0 | 535 | $2,050 | $3.83 | 26d | 1 | 0.24mi |
| 139 70th St Unit 3 Guttenberg, NJ | 1.0 | 1.0 | 525 | $1,775 | $3.38 | 17d | 1 | 0.24mi |
| 62 69th St Guttenberg, NJ | 1.0 | 1.0 | 829 | $2,495 | $3.01 | 19d | 1 | 0.25mi |
| 7004 JFK Blvd E Unit 29D Guttenberg, NJ | 1.0 | 1.5 | 1003 | $3,300 | $3.29 | 14d | 1 | 0.27mi |
| 7650 River Rd Unit 812 North Bergen, NJ | 1.0 | 1.0 | 900 | $3,350 | $3.72 | 26d | 1 | 0.29mi |
| 7650 River Rd Unit 842 North Bergen, NJ | 1.0 | 1.0 | 900 | $3,395 | $3.77 | 26d | 1 | 0.29mi |
| 110 68th St Apt 2E Guttenberg, NJ | 1.0 | 1.0 | 700 | $1,800 | $2.57 | 26d | 1 | 0.30mi |
| 7900 River Rd Unit 1012 2 Bedroom North Bergen, NJ | 2.0 | 2.0 | 1125 | $3,700 | $3.29 | 26d | 1 | 0.30mi |
| 7900 River Rd Unit 912 2 Bedroom North Bergen, NJ | 2.0 | 2.0 | 1125 | $2,725 | $2.42 | 26d | 1 | 0.31mi |
| 60 68th St Unit 505 Guttenberg, NJ | 1.0 | 1.0 | 670 | $2,550 | $3.81 | 15d | 1 | 0.31mi |
| 60 68th St Unit 406 Guttenberg, NJ | 1.0 | 1.0 | 700 | $2,600 | $3.71 | 15d | 1 | 0.31mi |
| 7602 River Rd Unit 1 Bdrm 900sf Guttenberg, NJ | 1.0 | 1.0 | 900 | $3,395 | $3.77 | 26d | 1 | 0.31mi |
| 7602 River Rd Unit 411 Guttenberg, NJ | 1.0 | 1.0 | 900 | $3,750 | $4.17 | 26d | 1 | 0.31mi |
| 7602 River Rd Unit 311 Guttenberg, NJ | 1.0 | 1.0 | 900 | $3,450 | $3.83 | 26d | 1 | 0.31mi |
| 7602 River Rd Unit 1 Guttenberg, NJ | 1.0 | 1.0 | 900 | $3,550 | $3.94 | 26d | 1 | 0.31mi |
| 7000 JFK Blvd E Unit 22A West New York, NJ | 1.0 | 1.0 | 875 | $3,000 | $3.43 | 26d | 1 | 0.32mi |
| 7000 JFK Blvd E Unit 22C Guttenberg, NJ | 1.0 | 1.5 | 932 | $3,198 | $3.43 | 24d | 1 | 0.32mi |
| 7000 JFK Blvd E Unit 22C Guttenberg, NJ | 1.0 | 1.5 | 932 | $3,198 | $3.43 | 15d | 1 | 0.32mi |
| 7000 JFK Blvd E Unit 23F West New York, NJ | 1.0 | 1.0 | 875 | $2,850 | $3.26 | 26d | 1 | 0.32mi |
| 7812 Hudson Ave Unit B1 North Bergen, NJ | 2.0 | 1.0 | 750 | $2,100 | $2.80 | 15d | 1 | 0.33mi |
| 7000 JFK Blvd E Unit 42H West New York, NJ | 1.0 | 1.5 | 970 | $2,950 | $3.04 | 19d | 1 | 0.33mi |
| 6710 Park Ave #205 Guttenberg, NJ | 1.0 | 1.0 | 700 | $2,550 | $3.64 | 26d | 1 | 0.33mi |
| 6710 Park Ave #203 Guttenberg, NJ | 1.0 | 1.0 | 700 | $2,500 | $3.57 | 26d | 1 | 0.33mi |
| 7002 JFK Blvd E Unit 15B Guttenberg, NJ | 1.0 | 1.5 | 932 | $3,100 | $3.33 | 26d | 1 | 0.34mi |
| 7002 JFK Blvd E Unit 41J Guttenberg, NJ | 1.0 | 1.5 | 840 | $2,600 | $3.10 | 1d | 1 | 0.34mi |
| 7002 JFK Blvd E Unit 14B Guttenberg, NJ | 1.0 | 1.5 | 950 | $3,150 | $3.32 | 26d | 1 | 0.34mi |
| 7912 River Rd North Bergen, NJ | 1.0–3.0 | 1.0–2.0 | 1136 | $4,242 | $3.73 | 1d | 13 | 0.34mi |
| 301 79th St Unit A9 North Bergen, NJ | 1.0 | 1.0 | 618 | $1,850 | $2.99 | 26d | 1 | 0.34mi |
| 310 70th St Guttenberg, NJ | 1.0 | 1.0 | 600 | $1,850 | $3.08 | 26d | 1 | 0.35mi |
Listing history 12 events
-
2026-05-26$357,000
-
2022-11-27historical
-
2017-11-09soldstatus $241,000 Sold
-
2017-09-21historical
-
2017-09-06$240,000 Active
-
2003-03-27historical
-
2003-03-12$169,900
-
2002-09-30historical
-
2002-06-10$139,900
-
2000-11-16soldstatus $70,000
-
1999-06-09soldstatus $50,000
-
1998-10-16soldstatus $50,000
ⓘ Source: listings_history table (triggers on properties + properties_extension) + one-shot
backfill from property_details.listing_events for pre-trigger history.
Tax reassessment forecast NJ · Partial reset (capped growth)
- Current annual tax
- $2,394 · $200/mo
- Projected year-2 tax
- $5,642 · $470/mo
- Expected delta
- +$3,248/yr (+$271/mo · 135.7%)
ⓘ Screening estimate from a state-policy table — verify with the county assessor before closing.
Nearby sold comps map
Loading sold comps map…
Walkable amenities ~0.75 mi
Loading nearby amenities…
Taxation est. · year 1
- Rental income
- $35,112
- − Mortgage interest
- −$19,998
- − Property taxes
- −$2,394
- − Insurance
- −$1,785
- − Repairs & maintenance
- −$2,809
- − Management
- −$2,809
- − Depreciation
- −$10,385
- Taxable loss
- −$5,068
- Est. tax savings @ 24.0%
- +$1,216
- After-tax cash flow
- $2,310/yr
For passive investors: Depreciation is non-cash, so a rental often shows a tax loss while cash-flowing — sheltering income. Rental losses are passive: they offset passive income freely, and up to $25,000/yr can offset ordinary (W-2) income if you actively participate and your MAGI is under $100k (phasing out to $0 by $150k); unused losses carry forward. On sale, claimed depreciation is recaptured at up to 25%, and gains may owe capital-gains tax (a 1031 exchange can defer both). Figures are a year-1 estimate at your 24.0% rate — not tax advice; consult a CPA.
Schools (NCES district)
- District
- North Bergen School District
- NCES district ID
- 3411460
- Math proficiency
- 12% ▼ -16.00%
- Reading proficiency
- 37% ▼ -10.00%
- Median HH income
- $54,275
- Composite
- 21.95/100
- National rank
- #8221
- State rank
- #393 of 472 in NJ
Livability — Guttenberg
- Score
- 82/100
- State rank
- #51
- US rank
- #1253
Category grades
Schools grade is shown separately in the Schools card above.
Census & demographics
- County
- Hudson County · 718,323 people
- Metro
- New York-Newark-Jersey City, NY-NJ-PA
- Population (ZIP)
- 61,250
- Household income
- $78,911
- Rent vs Own
- Severe rent burden
- 3908.0
Population outlook (Hudson County) Hauer SSP2
- Today (2025)
- 771,834 people
- By 2030
- 818,028 · +6.0%
- By 2040
- 907,866 · +17.6%
- By 2050
- 994,480 · +28.8%
- By 2075
- 1,163,301 · +50.7%
- By 2100
- 1,254,703 · +62.6%
Race, ethnicity, and origin ACS 2023
- Neighborhood character
- Predominantly Hispanic (69%)
- Race & ethnicity
- Hispanic / Latino 69% Two or more races 26% White 20% Asian 7% Black 3% Native American 1%
- Hispanic origin (detail)
- Mexican 2% Puerto Rican 7% Cuban 11% Dominican 12%
- Common ancestry
- Romanian 1% Lithuanian 1%
- Foreign-born
- 50% · Canada, Jamaica, South Korea
- Languages at home
- 27% English-only · Spanish 61% Other Indo-European 4% Arabic 3%
Political lean MEDSL · Hudson
- 2024 margin
- Strong D (+28.1) · D 62.6% · R 34.6% · Other 2.8%
- 2008→2024 swing
- -18.7pp toward R · 2008: 46.7pp · 2024: 28.1pp
- All cycles
- 2024: D+28.1 2020: D+46.2 2016: D+51.8 2012: D+55.7 2008: D+46.7
Not yet ingested
- Civics
- —
Market trends
- HPI YoY
- ▼ -192.36%
- Current HPI
- 419.0283
- Rent YoY
- ▲ 4.99%
- Metro
- New York-Newark-Jersey City, NY-NJ-PA
- State GDP YoY
- ▲ 2.05%
- F500 in state
- 34
Industry mix (Fortune 500 HQ in NJ)
| Industry | F500 HQs | Revenue |
|---|---|---|
| Consumer Goods | 3 | $31B |
|
||
| Pharmaceuticals | 2 | $153B |
|
||
| Technology | 2 | $21B |
|
||
| Insurance | 2 | $20B |
|
||
| Healthcare | 2 | $19B |
|
||
| Financial Services | 1 | $70B |
|
||
Price history
+614.0% since first listed12 events — show timeline
- 2026-05-26 Listed $357,000 FSBO.com
- 2022-11-27 Rental Removed — NJMLS
- 2017-11-09 Sold (MLS) $241,000 GSMLS
- 2017-09-21 Delisted — GSMLS
- 2017-09-06 Listed $240,000 GSMLS
- 2003-03-27 Listing Removed — HCMLS
- 2003-03-12 Listed $169,900 HCMLS
- 2002-09-30 Listing Removed — HCMLS
- 2002-06-10 Listed $139,900 HCMLS
- 2000-11-16 Sold (Public Records) $70,000 Public Records
- 1999-06-09 Sold (Public Records) $50,000 Public Records
- 1998-10-16 Sold (Public Records) $50,000 Public Records
Property tax history
+0.0%/yrLatest (2010): $2,394 · +0.0% YoY. Source: county tax records.
Cash-flow waterfall
monthlySold comps — $/sqft
last 12 mo · ≤1 miLoading sold comps…