43539 Corte Del Oro · La Quinta, CA
Flood risk 1/10 · Minimal
- FEMA flood zone
- X (unshaded)
- Chance of flooding over 30 yrs
- 0.0%
- Est. flood insurance / yr
- $507 – $1,088
Fire risk 6/10 · Moderate
- Est. fire insurance / yr
- $659 – $1,223
Heat risk 10/10 · Severe
- Hot days now (above 114°F)
- 7 days/yr
- Hot days in 30 yrs
- 17 days/yr
Wind risk 1/10 · Minimal
- Chance of severe wind over 30 yrs
- —
Air-quality risk 4/10 · Minor
- Unhealthy air days now
- 4 days/yr
- Unhealthy air days in 30 yrs
- 5 days/yr
Risk factors via First Street. Map © Google.
Why this score? — see what drove the D grade
The composite is a weighted blend of 9 inputs, each scored 0–100. Each bar is that input's sub-score; the figure is the points it added to the 100-point composite (weight × sub-score).
- ARV discount +15.0/15.0
- Cash flow +10.6/30.0
- Rent growth +4.1/5.0
- Schools +3.8/10.0
- DSCR +3.1/10.0
- 1% rule +3.0/10.0
- Livability +2.9/5.0
- Condition / age +2.5/5.0
- Appreciation +0.0/10.0
$599,000
🖨 Deal sheet (PDF) 📄 Offer letter ✓ Due diligence
Listing remarks
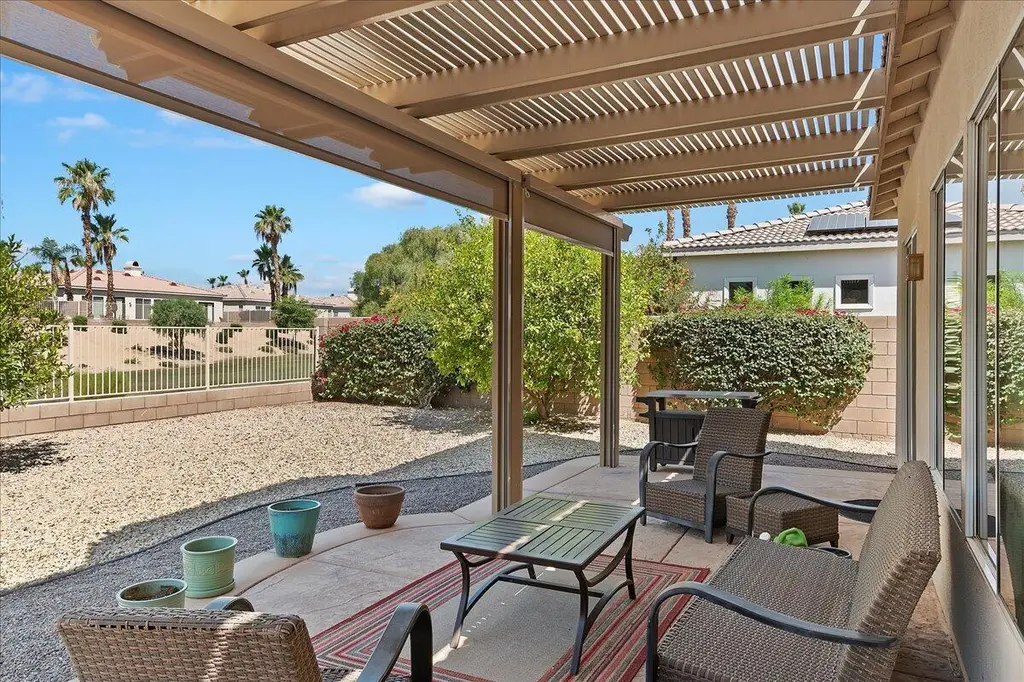
Welcome to Corte Del Oro in the Esplanade community of La Quinta, where mountain views and everyday convenience come together. Situated on an elevated lot with southwest-facing mountain and greenbelt views, this well-maintained home offers comfortable desert living in a gated community. Inside, you will find three spacious bedrooms plus a versatile den that may serve as a home office, guest room, or additional sleeping space. The inviting living room features a fireplace, creating a comfortable space to relax or gather with family and friends. Step outside to the covered Alumawood patio with manual shades, offering a welcoming setting for outdoor dining, entertaining, or enjoying the surrou
Key facts
- Gated community
- Greenbelt views
- Mountain views
Tags
Property features AI
Finance
- Other: Short-term rentals not permitted; Will not consider lease; Home warranty plan disclosed
- Financial info: Listing accepts Conventional, FHA, and Cash financing
- HOA & community: Monthly HOA fee of $225; HOA provides controlled access and management; Association has pet rules
Exterior
- Parking: Attached 2-car garage with garage door opener; Driveway; total parking for 2 vehicles
- Security: Gated community; Community has controlled access
- Utilities: Water provided by a water district (Coachella Valley Water District); Sewer is connected and paid; Natural gas available
- Home design: Traditional single-family detached home; One story; Front door faces north and south
- Construction: Stucco exterior; Concrete roof; Slab foundation; Year built (assessor source)
- Exterior features: Covered patio; Block and wrought-iron fencing; Drip irrigation system; Sprinklers; Mountain and park/greenbelt views; Located in a gated community
Interior
- Kitchen: Ceramic counters; Gas range; Range hood; Refrigerator; Water line to refrigerator
- Bedrooms: Bedrooms with walk-in closet
- Flooring: Carpet; Ceramic tile
- Bathrooms: 2 full bathrooms; Shower and tub combinations
- Heating & cooling: Central heating (natural gas); Central air conditioning
- Interior features: Ground-level entry with no steps; Unfurnished; Blinds; Gas-log fireplace in the living room (1 fireplace)
- Laundry & utility: Washer and dryer in a dedicated laundry room
Neighborhood map
What this means for you Summary
Snapshot
- This is a 4-bed/2.0-bath single-family listed at $599k.
Deal economics
- At list price, monthly cash flow is $-294 ($-4k/yr) — negative.
- To cash-flow at today's rent, offer at most $547k (8.7% below list).
- To meet the 1% rule (rent ≥ 1% of price), the offer needs to be $478k (20.2% below list).
- Recommended offer: $478k (20.2% below list) — sets the bar for 1% rule.
- Cap rate 5.7% vs local median 3.3% in La Quinta — top-decile yield for the area; either an underpriced asset or a hidden risk that comps aren't pricing in. Stress-test before assuming the spread holds.
Location & tenants
- Location reads 58/100 on livability (#694 in CA) — a working-class tenant base; expect higher turnover. Strengths: commute A-, employment B+, housing B+; Watch: amenities F, cost of living F, health & safety F.
- Desert Sands Unified (suburban): math 31% / reading 56% proficiency, ranked #199 of 517 in CA (top 38%) — families likely to look elsewhere, expect single-tenant / working-renter base with shorter leases.
- Zoned schools: James Monroe Elementary (581 students, 64% FRL); Colonel Mitchell Paige Middle (math 10% / reading 10%, grade F, #474 of 498 statewide, top 99%, 436 students, 74% FRL); Palm Desert High (math 42% / reading 67%, grade C-, #256 of 1,170 statewide, top 24%, 2,050 students, 57% FRL).
- Market conditions: Rents rising fast (+6.5%/yr); 660 active listings in the ZIP; 40 comparable units currently listed for rent nearby; rentals lingering (median 46d on market — plan ~5-8 weeks vacancy on turnover, expect pricing pressure); 58% of comp listings sitting > 30 days — soft ceiling on asking rent; solid renter incomes; 9,195 units permitted in Riverside County in 2024 (1,512 in 5+ unit buildings).
- At $4,779/mo this rent would consume 58% of the median local household income ($99k/yr) (locally 1078% of renters already pay >50% of income on rent) — very limited rent-growth headroom before tenants either downsize or default.
Forward outlook
- Local home prices are declining (-3.0%/yr); year-one equity from $4k of loan paydown is wiped out by about $18k of value loss. Plan a longer hold.
- Riverside County population projected at +22% by 2050 — long-run rental-demand tailwind backs the buy-and-hold thesis.
Negotiation context
- It's been on market 18 days — a 2% lower offer ($590k) is reasonable based on typical stale-listing flexibility.
- 3 sale attempts since 11y ago; this cycle's ask has dropped $51k (8%) from the opening price — seller is motivated, your offer sets the floor, not the list.
- Current owner paid $294k; list at $599k implies a 103% gain — meaningful room to come down on a strong offer.
Risks & watch-outs
- Climate carrying-cost: major wildfire risk; extreme-heat days projected 7→17/yr by 2055 (HVAC capex compounding) — expect insurance premiums to compound above CPI over the hold.
Questions for the listing agent
- What do current leases actually rent for vs. the listed asking? Can we see a recent rent roll and the last 12 months of T-12 income?
- What does the HOA fee cover, when was the last increase, and are there any pending special assessments or reserve-fund shortfalls?
- Is there a deadline driving the sale (1031 exchange, divorce, estate, relocation)? That informs how much negotiation room exists.
- Schools are D-rated, which usually means shorter tenancies and higher turnover. Who's the typical renter profile here, and what's been the actual vacancy rate?
- The area grade is low — what's the realistic commute time and amenity access for the typical tenant pool here? Any planned neighborhood developments (good or bad) we should know about?
- What's the average days-on-market for RENTAL listings here right now (not sales)? A rising rental-DOM trend means longer vacancies and softer asking-rent achievability than the comps imply.
- What's the recent tenant-quality profile in this submarket — average credit score on applications, eviction rate, late-payment / NSF rate, and stable-employment percentage? A property-management company in the area should have these aggregated.
- How much new for-sale + rental construction is in the pipeline within 1–3 miles? Heavy new supply typically softens prices + rents 12–24 months out; constrained supply supports both.
Investment metrics
- 1% rule
- 0.80% ✗
- Cap rate
- 5.70%
- Cash-on-cash
- -2.11%
- DSCR
- 0.91
- GRM
- 10.4
CMA / ARV
- ARV (median comp)
- $759,742
- List price
- $599,000
- Delta
- -17.74%
- Verdict
- UNDERPRICED
- Comps
- 20 within 1.0 mi
Show comp detail 12 sales within ~0.75 mi
| Address | Dist | Beds/Ba | Sqft | Sold | Price | $/sf | Match |
|---|---|---|---|---|---|---|---|
| 79925 Corte Calero | 0.07mi | 4/3.5 | 2,060 (-2%) | 3mo | $760,000 | $369 | 84 |
| 43251 Corte Del Oro | 0.18mi | 4/2.0 | 2,172 (+3%) | 6mo | $685,000 | $315 | 82 |
| 43460 Old Harbour Dr | 0.38mi | 3/3.0 (-1) | 2,124 (+1%) | 3mo | $829,000 | $390 | 70 |
| 43363 N Heritage Palms Dr | 0.41mi | 3/2.0 (-1) | 2,032 (-4%) | 4mo | $575,000 | $283 | 66 |
| 44150 Sweet Bush Ln | 0.35mi | 4/2.0 | 1,887 (-11%) | 5mo | $605,000 | $321 | 62 |
| 80535 Anacapa Dr | 0.62mi | 4/2.5 | 2,204 (+4%) | 2mo | $592,900 | $269 | 60 |
| 42481 Isla Ct | 0.62mi | 4/2.5 | 2,204 (+4%) | 2mo | $599,900 | $272 | 60 |
| 80523 Anacapa Dr | 0.59mi | 4/2.0 | 1,934 (-8%) | 0mo | $564,900 | $292 | 58 |
| 42490 Isla Ct | 0.63mi | 4/2.0 | 1,934 (-8%) | 2mo | $564,900 | $292 | 55 |
| 44584 S Heritage Palms Dr | 0.75mi | 3/2.0 (-1) | 2,258 (+7%) | 2mo | $590,000 | $261 | 47 |
| 79528 Morning Glory Ct | 0.68mi | 3/3.0 (-1) | 2,237 (+6%) | 5mo | $540,000 | $241 | 45 |
| 44800 Calle Santa Barbara | 0.72mi | 4/3.0 | 2,292 (+8%) | 4mo | $590,000 | $257 | 45 |
Match score weights: distance 35% · size 25% · config 20% · recency 20%. Top-matched comps best support the ARV.
Projected returns pro-forma
-3.0% appreciation · 6.45% rent growth · sell at horizon
- IRR
- -16.1%
- Equity multiple
- 0.41×
- Total profit
- $-98,621
- Equity at exit
- $89,313
- IRR
- -2.6%
- Equity multiple
- 0.80×
- Total profit
- $-34,294
- Equity at exit
- $51,791
Cash invested: $167,720 (down + closing). Projections, not guarantees.
Landlord ↔ Tenant lean methodology
- Overall (STATE)
- 18 Strongly Tenant-Friendly
- State California
- 18 Strongly Tenant-Friendly · D+13
- County
- — inherits STATE
- City
- — inherits STATE
ZIP-level market 92253
- Rents YoY
- 6.5%
- Active inventory
- 660
- Price-to-rent
- 10.4×
Monthly cashflow live
- Estimated rent
- $4,779 high interval (Pro) →
- Mortgage (P&I)
- −$3,141
- Tax from tax record
- −$454 /mo · $5,444/yr
- Insurance
- −$250
- HOA
- −$225
- Vacancy / Maint / Mgmt
- −$1,004
- Net cashflow
- $-294
Break-even live
Sensitivity live
| Price | -10% $45 | -5% $-125 | +0% $-294 | +5% $-464 | +10% $-633 |
|---|---|---|---|---|---|
| Rent | -10% $-672 | -5% $-483 | +0% $-294 | +5% $-106 | +10% $83 |
| Rate | -1.0pp $7 | -0.5pp $-142 | base $-294 | +0.5pp $-450 | +1.0pp $-607 |
UW: 25.0% down · 7.5% · 30yr · 1.5% tax · 5.0% vac · 8.0% maint · 8.0% mgmt
Financing live
Cash to close
- Down payment
- $149,750
- Closing costs
- $17,970
- Reserves months
- —
- Total cash needed
- —
Loan-product check · same deal, 3 products live
Conventional
25% down · 7.5% · 30yr
- Down + closing
- —
- Monthly P&I
- —
- Monthly cashflow
- —
- DSCR
- —
- Eligible?
- —
Personal DTI + credit; lowest rate.
DSCR
20% down · 8.5% · 30yr
- Down + closing
- —
- Monthly P&I
- —
- Monthly cashflow
- —
- DSCR
- —
- Eligible?
- —
No personal income docs; deal must DSCR.
Hard money
10% down · 12.0% · 12mo
- Down + closing
- —
- Monthly P&I
- —
- Monthly cashflow
- —
- DSCR
- —
- Eligible?
- —
Short-term bridge; refi at stabilization.
Rent comps 40 comps
| Address | Beds | Baths | Sqft | Rent | $/sqft | DOM | Units | Dist |
|---|---|---|---|---|---|---|---|---|
| 79862 Amora Dr La Quinta, CA | 4.0 | 3.0 | 2060 | $3,500 | $1.70 | 14d | 1 | 0.09mi |
| 43541 Parkway Esplanade E La Quinta, CA | 4.0 | 3.0 | 2540 | $6,500 | $2.56 | 45d | 1 | 0.10mi |
| 43419 Corte del Oro La Quinta, CA | 3.0 | 2.0 | 1829 | $7,000 | $3.83 | 19d | 1 | 0.10mi |
| 43424 Bordeaux Dr La Quinta, CA | 3.0 | 2.0 | 2172 | $6,000 | $2.76 | 45d | 1 | 0.16mi |
| 79882 Viento Dr La Quinta, CA | 4.0 | 2.0 | 2172 | $3,195 | $1.47 | 16d | 1 | 0.20mi |
| 79704 Castille Dr La Quinta, CA | 4.0 | 3.0 | 2060 | $3,200 | $1.55 | 7d | 1 | 0.26mi |
| 79704 Castille Dr La Quinta, CA | 4.0 | 3.0 | 2060 | $3,200 | $1.55 | 26d | 1 | 0.26mi |
| 43480 Port Maria Rd Bermuda Dunes, CA | 3.0 | 3.0 | 2096 | $6,500 | $3.10 | 7d | 1 | 0.27mi |
| 43480 Port Maria Rd Bermuda Dunes, CA | 3.0 | 3.0 | 2096 | $6,500 | $3.10 | 45d | 1 | 0.27mi |
| 44060 Mariposa Ct La Quinta, CA | 3.0 | 2.0 | 1621 | $3,250 | $2.00 | 45d | 1 | 0.36mi |
| 44030 Mariposa Ct La Quinta, CA | 4.0 | 2.0 | 1633 | $3,300 | $2.02 | 45d | 1 | 0.37mi |
| 42655 Delhi Pl Bermuda Dunes, CA | 3.0 | 2.5 | 1988 | $8,000 | $4.02 | 20d | 1 | 0.48mi |
| 80425 Enclave Ct Indio, CA | 4.0 | 2.5 | 2204 | $3,195 | $1.45 | 45d | 1 | 0.48mi |
| 44658 Franklin Ct La Quinta, CA | 4.0 | 3.0 | 2325 | $4,000 | $1.72 | 45d | 1 | 0.52mi |
| 79940 Hancock Ct La Quinta, CA | 5.0 | 2.5 | 2591 | $3,950 | $1.52 | 26d | 1 | 0.55mi |
| 42391 Palisades Dr Indio, CA | 3.0 | 2.0 | 1679 | $2,975 | $1.77 | 45d | 1 | 0.55mi |
| 79554 Morning Glory Ct La Quinta, CA | 4.0 | 3.0 | 2510 | $4,500 | $1.79 | 20d | 1 | 0.65mi |
| 80149 Royal Birkdale Dr Indio, CA | 3.0 | 2.0 | 2466 | $6,000 | $2.43 | 45d | 1 | 0.71mi |
| 79948 Bethpage Ave Indio, CA | 3.0 | 2.0 | 1529 | $4,500 | $2.94 | 45d | 1 | 0.72mi |
| 44270 Camino Lavanda La Quinta, CA | 3.0 | 2.0 | 2216 | $5,797 | $2.62 | 45d | 1 | 0.73mi |
| 79535 Dandelion Dr La Quinta, CA | 3.0 | 3.0 | 2237 | $3,950 | $1.77 | 45d | 1 | 0.73mi |
| 44185 Camino Lavanda La Quinta, CA | 4.0 | 3.0 | 2436 | $5,275 | $2.17 | 45d | 1 | 0.74mi |
| 79188 Bog Walk Ct Bermuda Dunes, CA | 3.0 | 3.0 | 2748 | $3,000 | $1.09 | 4d | 1 | 0.75mi |
| 80585 Virginia Ave Indio, CA | 5.0 | 3.0 | 2652 | $3,900 | $1.47 | 45d | 1 | 0.76mi |
| 80055 Jasper Park Ave Indio, CA | 3.0 | 2.5 | 2162 | $4,000 | $1.85 | 45d | 1 | 0.77mi |
| 44700 Calle Placido La Quinta, CA | 4.0 | 3.0 | 2292 | $4,300 | $1.88 | 45d | 1 | 0.78mi |
| 45140 Coeur Dalene Dr Indio, CA | 4.0 | 4.0 | 2382 | $8,500 | $3.57 | 23d | 1 | 0.78mi |
| 45168 Coeur Dalene Dr Indio, CA | 3.0 | 3.0 | 2719 | $9,000 | $3.31 | 26d | 1 | 0.80mi |
| 80641 Philadelphia Ave Indio, CA | 4.0 | 2.5 | 2652 | $3,700 | $1.40 | 7d | 1 | 0.81mi |
| 45233 Big Canyon St Indio, CA | 3.0 | 2.0 | 1529 | $6,000 | $3.92 | 45d | 1 | 0.81mi |
| 80655 Philadelphia Ave Indio, CA | 4.0 | 2.0 | 2215 | $3,295 | $1.49 | 45d | 1 | 0.82mi |
| 43465 Liberty St Indio, CA | 3.0 | 2.0 | 2200 | $4,200 | $1.91 | 45d | 1 | 0.83mi |
| 80632 Thornhill Ct Indio, CA | 4.0 | 4.0 | 2611 | $5,500 | $2.11 | 45d | 1 | 0.87mi |
| 45338 Coeur Dalene Dr Indio, CA | 3.0 | 3.0 | 1898 | $6,500 | $3.42 | 45d | 1 | 0.88mi |
| 79150 Ocotillo Dr La Quinta, CA | 4.0 | 3.0 | 2700 | $4,125 | $1.53 | 16d | 1 | 0.88mi |
| 79150 Ocotillo Dr La Quinta, CA | 4.0 | 3.0 | 2700 | $4,125 | $1.53 | 26d | 1 | 0.88mi |
| 45385 Big Canyon St Indio, CA | 3.0 | 2.0 | 1529 | $3,200 | $2.09 | 45d | 1 | 0.89mi |
| 42430 Adams St Bermuda Dunes, CA | 3.0 | 3.0 | 2058 | $3,000 | $1.46 | 26d | 1 | 0.92mi |
| 78987 Yorkville Ln Indio, CA | 4.0 | 4.0 | 2822 | $3,795 | $1.34 | 7d | 1 | 0.92mi |
| 41740 Jamaica Sands Dr Bermuda Dunes, CA | 5.0 | 2.0 | 2072 | $4,999 | $2.41 | 45d | 1 | 0.96mi |
HOA detail
- Monthly dues
- $225 · $2,700/yr
- Likely covers
- security
Listing history 18 events
-
2026-06-21days on market $599,000 Active 18 DOM
-
2026-06-18days on market $599,000 Active 15 DOM
-
2026-06-17days on market $599,000 Active 14 DOM
-
2026-06-16days on market $599,000 Active 13 DOM
-
2026-06-15days on market $599,000 Active 12 DOM
-
2026-06-13days on market $599,000 Active 10 DOM
-
2026-06-09days on market $599,000 Active 6 DOM
-
2026-06-08days on market $599,000 Active 5 DOM
-
2026-06-07days on market $599,000 Active 4 DOM
-
2026-06-04remarks 699-char remark
-
2026-06-04pricestatusdays on market $599,000 Active 1 DOM
-
2026-05-16price $599,000
-
2026-02-10price $625,000
-
2025-12-09price $635,000
-
2025-06-23$650,000 Active
-
2015-10-19historical
-
2015-07-21$365,000 Active
-
2004-07-08soldstatus $294,500
ⓘ Source: listings_history table (triggers on properties + properties_extension) + one-shot
backfill from property_details.listing_events for pre-trigger history.
Tax reassessment forecast CA · Resets to sale price
- Current annual tax
- $5,444 · $454/mo
- Projected year-2 tax
- $5,444 · $454/mo
- Expected delta
- $0/yr ($0/mo · 0.0%)
ⓘ Screening estimate from a state-policy table — verify with the county assessor before closing.
Climate risk First Street
- Flood 1/10 Low FEMA zone X (unshaded) · 0% chance over 30 yrs
- Wildfire 6/10 Major
- Heat 10/10 Extreme 7 d/yr ≥114°F today · 17 d/yr by 30 yrs out
- Wind 1/10 Low
- Air quality 4/10 Moderate 4 unhealthy d/yr today · 5 by 30 yrs out
Nearby sold comps map
Loading sold comps map…
Walkable amenities ~0.75 mi
Loading nearby amenities…
Taxation est. · year 1
- Rental income
- $57,344
- − Mortgage interest
- −$33,553
- − Property taxes
- −$5,444
- − Insurance
- −$2,995
- − Repairs & maintenance
- −$4,588
- − Management
- −$4,588
- − HOA
- −$2,700
- − Depreciation
- −$17,425
- Taxable loss
- −$13,949
- Est. tax savings @ 24.0%
- +$3,348
- After-tax cash flow
- $-184/yr
For passive investors: Depreciation is non-cash, so a rental often shows a tax loss while cash-flowing — sheltering income. Rental losses are passive: they offset passive income freely, and up to $25,000/yr can offset ordinary (W-2) income if you actively participate and your MAGI is under $100k (phasing out to $0 by $150k); unused losses carry forward. On sale, claimed depreciation is recaptured at up to 25%, and gains may owe capital-gains tax (a 1031 exchange can defer both). Figures are a year-1 estimate at your 24.0% rate — not tax advice; consult a CPA.
Schools (NCES district)
- District
- Desert Sands Unified
- NCES district ID
- 0611110
- Math proficiency
- 31% ▼ -4.00%
- Reading proficiency
- 56% ▲ 7.00%
- Median HH income
- $54,957
- Composite
- 37.77/100
- National rank
- #4346
- State rank
- #199 of 517 in CA
Livability — La Quinta
- Score
- 58/100
- State rank
- #694
- US rank
- #21080
Category grades
Schools grade is shown separately in the Schools card above.
Census & demographics
- Census place
- La Quinta, CA
- County
- Riverside County · 2,287,001 people
- City population
- 38,666
- Metro
- Riverside-San Bernardino-Ontario, CA
- Population (ZIP)
- 38,666
- Household income
- $99,277
- Rent vs Own
- Severe rent burden
- 1078.0
Population outlook (Riverside County) Hauer SSP2
- Today (2025)
- 2,664,475 people
- By 2030
- 2,802,692 · +5.2%
- By 2040
- 3,050,904 · +14.5%
- By 2050
- 3,256,783 · +22.2%
- By 2075
- 3,655,058 · +37.2%
- By 2100
- 3,766,594 · +41.4%
Race, ethnicity, and origin ACS 2023
- Neighborhood character
- Diverse neighborhood (Simpson 0.57)
- Race & ethnicity
- White 54% Hispanic / Latino 37% Two or more races 19% Asian 4% Native American 1% Black 1%
- Hispanic origin (detail)
- Mexican 34%
- Common ancestry
- Romanian 2% Lithuanian 2% Slovak 1%
- Foreign-born
- 15% · Canada, China, Vietnam
- Languages at home
- 71% English-only · Spanish 24% Tagalog/Filipino 1% Chinese 1%
Political lean MEDSL · Riverside
- 2024 margin
- Toss-up / Even · D 48.0% · R 49.3% · Other 2.6%
- 2008→2024 swing
- -3.6pp toward R · 2008: 2.3pp · 2024: -1.3pp
- All cycles
- 2024: R+1.3 2020: D+8.0 2016: D+4.3 2012: R+0.4 2008: D+2.3
Not yet ingested
- Civics
- —
Market trends
- HPI YoY
- ▼ -263.65%
- Current HPI
- 281.8665
- Rent YoY
- ▲ 6.45%
- Metro
- Riverside-San Bernardino-Ontario, CA
- State GDP YoY
- ▲ 3.21%
- F500 in state
- 116
Industry mix (Fortune 500 HQ in CA)
| Industry | F500 HQs | Revenue |
|---|---|---|
| Technology | 27 | $1,492B |
|
||
| Financial Services | 3 | $174B |
|
||
| Retail | 3 | $44B |
|
||
| Insurance | 3 | $26B |
|
||
| Media / Entertainment | 2 | $115B |
|
||
| Pharmaceuticals / Biotech | 2 | $62B |
|
||
Price history
+103.4% since first listed8 events — show timeline
- 2026-05-16 Price Changed $599,000 GPSMLS
- 2026-02-10 Price Changed $625,000 GPSMLS
- 2025-12-09 Price Changed $635,000 GPSMLS
- 2025-06-23 Listed $650,000 GPSMLS
- 2025-06-01 Listed $599,000 GPSMLS
- 2015-10-19 Listing Removed — GPSMLS
- 2015-07-21 Listed $365,000 GPSMLS
- 2004-07-08 Sold (Public Records) $294,500 Public Records
Property tax history
+2.3%/yrLatest (2025): $5,444 · +2.7% YoY. Source: county tax records.
Cash-flow waterfall
monthlySold comps — $/sqft
last 12 mo · ≤1 miLoading sold comps…