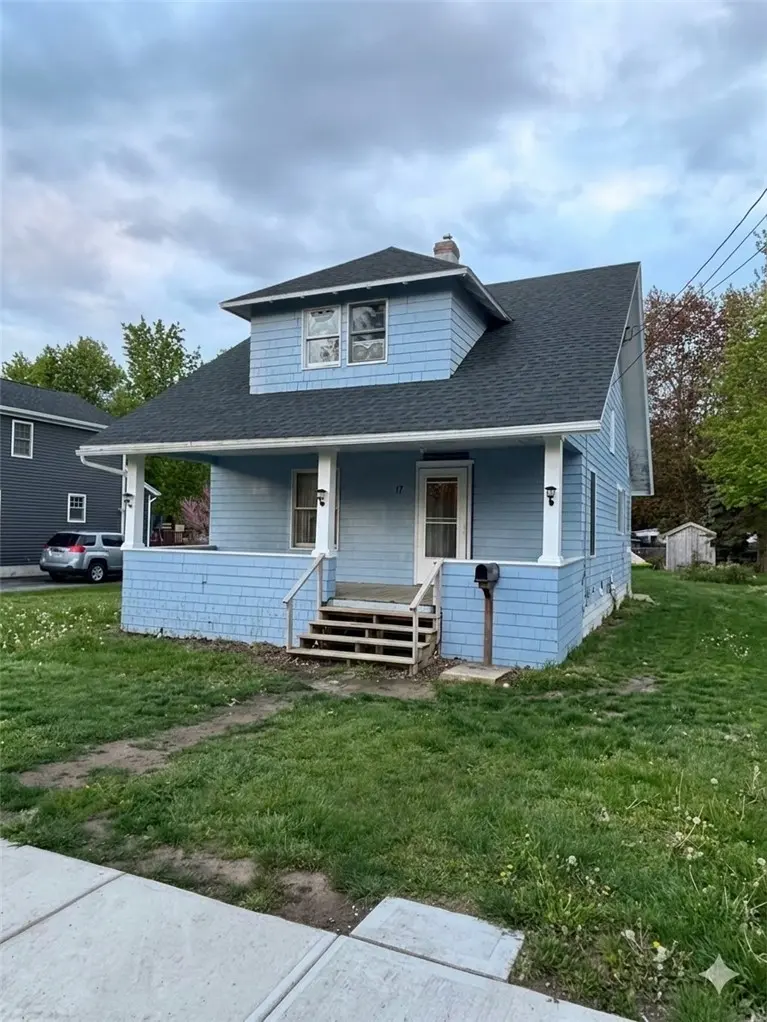
17 Elmwood Ave · Sodus, NY
Flood risk 4/10 · Minor
- FEMA flood zone
- —
- Chance of flooding over 30 yrs
- 0.22%
- Est. flood insurance / yr
- —
Fire risk 3/10 · Minor
- Est. fire insurance / yr
- $691 – $1,283
Heat risk 2/10 · Minimal
- Hot days now (above 95°F)
- 7 days/yr
- Hot days in 30 yrs
- 16 days/yr
Wind risk 1/10 · Minimal
- Chance of severe wind over 30 yrs
- 1.0%
Air-quality risk 2/10 · Minimal
- Unhealthy air days now
- 1 days/yr
- Unhealthy air days in 30 yrs
- 3 days/yr
Risk factors via First Street. Map © Google.
Why this score? — see what drove the B+ grade
The composite is a weighted blend of 9 inputs, each scored 0–100. Each bar is that input's sub-score; the figure is the points it added to the 100-point composite (weight × sub-score).
- Cash flow +30.0/30.0
- ARV discount +15.0/15.0
- 1% rule +10.0/10.0
- DSCR +10.0/10.0
- Schools +3.8/10.0
- Livability +3.5/5.0
- Rent growth +2.5/5.0
- Condition / age +2.5/5.0
- Appreciation +0.0/10.0
$84,900
🖨 Deal sheet 📄 Offer letter ✓ Due diligence
Listing remarks
Charming Sodus Village home with major mechanical updates already done! Bring your finishing touches and build instant equity. This property features a structural head start with newer roof (2 Years), Central air (2 years ) , and Hot water tank (4years). The interior is a blank canvas ready for cosmetic updates, Needing personal style, Trim work, and renovations in Kitchen and bedrooms. Perfect for investors, flippers or ambitious hand home owner looking to customize their space. Being sold as is Schedule your tour today!
Key facts
- 7,841 sq ft lot
- Built 1917
- Listed 9 days
Property features AI
Exterior
- Parking: No garage
- Utilities: Public water connected; Sewer connected
- Home design: 2-story existing structure; Resale property
- Construction: Block foundation; Block and concrete construction
- Exterior features: Gravel driveway; City street frontage; Rectangular residential lot; Agricultural zoning characteristics
Interior
- Kitchen: Gas water heater (appliance listed; see remarks)
- Bedrooms: One main-level bedroom
- Flooring: Hardwood; Varies
- Bathrooms: One full bathroom; One half bathroom; One main-level bathroom
- Heating & cooling: Gas forced-air heating; Central air conditioning
- Interior features: Hardwood and varied flooring throughout; Full basement
- Laundry & utility: See remarks
Neighborhood map
What this means for you Summary
Snapshot
- This is a 3-bed/1.5-bath single-family listed at $85k.
Deal economics
- At list price, monthly cash flow is $435 ($5k/yr) — positive.
- The deal already cash-flows at list — no discount required.
- Meets the 1% rule at list price ($1k rent vs $85k).
Location & tenants
- Location reads 70/100 on livability (#428 in NY) — a middle-class / working-renter tenant base. Strengths: cost of living A+, housing A+, crime A-; Watch: schools F, amenities F, employment D-.
- Sodus Central School District (rural): math 45% / reading 45% proficiency, ranked #462 of 590 in NY (top 78%) — families likely to look elsewhere, expect single-tenant / working-renter base with shorter leases.
- Market conditions: 29 active listings in the ZIP; 259 units permitted in Wayne County in 2024 (90 in 5+ unit buildings).
Forward outlook
- Local home prices are declining (-3.0%/yr); year-one equity from $587 of loan paydown is wiped out by about $3k of value loss. Plan a longer hold.
- Wayne County population projected at -24% by 2050 — secular population decline; favor cash flow + early exit over multi-decade hold.
- At projected returns (-3.0% appreciation + 3.0% rent growth), your $24k cash investment doubles in ~6 years — after that, you're playing with house money.
Negotiation context
- Only 9 days on market — expect competitive offers; lowballing is unlikely to land.
- Current owner paid $57k; 49% above their basis — modest negotiation headroom, anchor on the comps not their cost.
Risks & watch-outs
- Watch-outs: built in 1917 — expect roof / HVAC / electrical / plumbing capex.
Questions for the listing agent
- Built in 1917 — when were the roof, HVAC, electrical panel, plumbing, and water heater last replaced?
- Is there a deadline driving the sale (1031 exchange, divorce, estate, relocation)? That informs how much negotiation room exists.
- Schools are F-rated, which usually means shorter tenancies and higher turnover. Who's the typical renter profile here, and what's been the actual vacancy rate?
- What's the average days-on-market for RENTAL listings here right now (not sales)? A rising rental-DOM trend means longer vacancies and softer asking-rent achievability than the comps imply.
- What's the recent tenant-quality profile in this submarket — average credit score on applications, eviction rate, late-payment / NSF rate, and stable-employment percentage? A property-management company in the area should have these aggregated.
- How much new for-sale + rental construction is in the pipeline within 1–3 miles? Heavy new supply typically softens prices + rents 12–24 months out; constrained supply supports both.
Investment metrics
- 1% rule
- 1.62% ✓
- Cap rate
- 12.44%
- Cash-on-cash
- 21.95%
- DSCR
- 1.98
- GRM
- 5.1
CMA / ARV
- ARV (on-the-fly)
- $156,480
- Comps found
- 7
Show comp detail 7 sales within ~0.75 mi
| Address | Dist | Beds/Ba | Sqft | Sold | Price | $/sf | Match |
|---|---|---|---|---|---|---|---|
| 42 Mill St | 0.39mi | 4/1.5 (+1) | 1,288 (-1%) | 1mo | $110,000 | $85 | 74 |
| 5 Belden Ave | 0.22mi | 4/1.0 (+1) | 1,440 (+10%) | 3mo | $90,000 | $63 | 62 |
| 24 Sergeant St | 0.25mi | 4/1.5 (+1) | 1,227 (-6%) | 13mo | $179,000 | $146 | 62 |
| 63 Belden Ave | 0.53mi | 4/1.5 (+1) | 1,320 (+1%) | 8mo | $194,000 | $147 | 62 |
| 48 Sergeant St | 0.12mi | 3/1.0 | 1,494 (+15%) | 17mo | $180,000 | $120 | 54 |
| 42 Curtiss Ave | 0.33mi | 3/1.0 | 1,400 (+7%) | 20mo | $182,500 | $130 | 54 |
| 80 Maple Ave | 0.64mi | 2/1.0 (-1) | 1,449 (+11%) | 14mo | $40,000 | $28 | 33 |
Match score weights: distance 35% · size 25% · config 20% · recency 20%. Top-matched comps best support the ARV.
Projected returns pro-forma
-3.0% appreciation · 3.0% rent growth · sell at horizon
- IRR
- 14.7%
- Equity multiple
- 1.59×
- Total profit
- $14,003
- Equity at exit
- $12,659
- IRR
- 23.5%
- Equity multiple
- 3.02×
- Total profit
- $48,114
- Equity at exit
- $7,341
Cash invested: $23,772 (down + closing). Projections, not guarantees.
Landlord ↔ Tenant lean methodology
- Overall (STATE)
- 15 Strongly Tenant-Friendly
- State New York
- 15 Strongly Tenant-Friendly · D+10
- County
- — inherits STATE
- City
- — inherits STATE
ZIP-level market 14551
- Home prices YoY
- -13.9%
- Active inventory
- 29
- Price-to-rent
- 5.1×
Monthly cashflow live
- Estimated rent
- $1,379 medium interval (Pro) →
- Mortgage (P&I)
- −$445
- Tax from tax record
- −$174 /mo · $2,090/yr
- Insurance
- −$35
- HOA
- −$0
- Vacancy / Maint / Mgmt
- −$290
- Net cashflow
- $435
Break-even live
UW: 25.0% down · 7.5% · 30yr · 1.5% tax · 5.0% vac · 8.0% maint · 8.0% mgmt
Financing live
Cash to close
- Down payment
- $21,225
- Closing costs
- $2,547
- Reserves months
- —
- Total cash needed
- —
Loan-product check · same deal, 3 products live
Conventional
25% down · 7.5% · 30yr
- Down + closing
- —
- Monthly P&I
- —
- Monthly cashflow
- —
- DSCR
- —
- Eligible?
- —
Personal DTI + credit; lowest rate.
DSCR
20% down · 8.5% · 30yr
- Down + closing
- —
- Monthly P&I
- —
- Monthly cashflow
- —
- DSCR
- —
- Eligible?
- —
No personal income docs; deal must DSCR.
Hard money
10% down · 12.0% · 12mo
- Down + closing
- —
- Monthly P&I
- —
- Monthly cashflow
- —
- DSCR
- —
- Eligible?
- —
Short-term bridge; refi at stabilization.
Listing history 2 events
-
2026-05-16$84,900 Active
-
1995-03-06soldstatus $57,000
ⓘ Source: listings_history table (triggers on properties + properties_extension) + one-shot
backfill from property_details.listing_events for pre-trigger history.
Tax reassessment forecast NY · Partial reset (capped growth)
- Current annual tax
- $2,090 · $174/mo
- Projected year-2 tax
- $2,090 · $174/mo
- Expected delta
- $0/yr ($0/mo · 0.0%)
ⓘ Screening estimate from a state-policy table — verify with the county assessor before closing.
Climate risk First Street
- Flood 4/10 Moderate 22% chance over 30 yrs
- Wildfire 3/10 Moderate
- Heat 2/10 Low 7 d/yr ≥95°F today · 16 d/yr by 30 yrs out
- Wind 1/10 Low 100% chance of damaging wind over 30 yrs
- Air quality 2/10 Low 1 unhealthy d/yr today · 3 by 30 yrs out
Nearby sold comps map
Loading sold comps map…
Walkable amenities ~0.75 mi
Loading nearby amenities…
Taxation est. · year 1
- Rental income
- $16,552
- − Mortgage interest
- −$4,756
- − Property taxes
- −$2,090
- − Insurance
- −$424
- − Repairs & maintenance
- −$1,324
- − Management
- −$1,324
- − Depreciation
- −$2,470
- Taxable income
- $4,163
- Est. tax owed @ 24.0%
- −$999
- After-tax cash flow
- $4,219/yr
For passive investors: Depreciation is non-cash, so a rental often shows a tax loss while cash-flowing — sheltering income. Rental losses are passive: they offset passive income freely, and up to $25,000/yr can offset ordinary (W-2) income if you actively participate and your MAGI is under $100k (phasing out to $0 by $150k); unused losses carry forward. On sale, claimed depreciation is recaptured at up to 25%, and gains may owe capital-gains tax (a 1031 exchange can defer both). Figures are a year-1 estimate at your 24.0% rate — not tax advice; consult a CPA.
Schools (NCES district)
- District
- Sodus Central School District
- NCES district ID
- 3627120
- Math proficiency
- 45% ▲ 7.00%
- Reading proficiency
- 45% ▲ 9.00%
- Median HH income
- $46,269
- Composite
- 38.29/100
- National rank
- #4233
- State rank
- #462 of 590 in NY
Livability — Sodus
- Score
- 70/100
- State rank
- #428
- US rank
- #7433
Category grades
Schools grade is shown separately in the Schools card above.
Census & demographics
- Census place
- Sodus, NY
- Population (ZIP)
- 4,969
Population outlook (Wayne County) Hauer SSP2
- Today (2025)
- 85,662 people
- By 2030
- 81,945 · -4.3%
- By 2040
- 73,735 · -13.9%
- By 2050
- 65,029 · -24.1%
- By 2075
- 47,451 · -44.6%
- By 2100
- 31,574 · -63.1%
Race, ethnicity, and origin ACS 2023
- Neighborhood character
- Predominantly White (76%)
- Race & ethnicity
- White 76% Black 12% Two or more races 8% Hispanic / Latino 5%
- Common ancestry
- Iranian 11% Romanian 3% Slovak 2%
- Foreign-born
- 3% · Canada
- Languages at home
- 92% English-only · Spanish 3% German/W. Germanic 3% French/Haitian/Cajun 1%
Political lean MEDSL · Wayne
- 2024 margin
- Strong R (+23.1) · D 38.5% · R 61.5%
- 2008→2024 swing
- -13.2pp toward R · 2008: -9.9pp · 2024: -23.1pp
- All cycles
- 2024: R+23.1 2020: R+19.6 2016: R+26.1 2012: R+9.3 2008: R+9.9
Not yet ingested
- Civics
- —
Market trends
- HPI YoY
- ▼ -36.35%
- Current HPI
- 224.7978
- Rent YoY
- —
- Metro
- —
- State GDP YoY
- ▲ 2.60%
- F500 in state
- 92
Industry mix (Fortune 500 HQ in NY)
| Industry | F500 HQs | Revenue |
|---|---|---|
| Financial Services | 10 | $950B |
|
||
| Consumer Goods | 9 | $162B |
|
||
| Insurance | 4 | $225B |
|
||
| Telecommunications | 2 | $144B |
|
||
| Pharmaceuticals | 2 | $112B |
|
||
| Media / Entertainment | 2 | $69B |
|
||
Price history
+48.9% since first listed2 events — show timeline
- 2026-05-16 Listed $84,900 UNYREIS
- 1995-03-06 Sold (Public Records) $57,000 Public Records
Property tax history
-0.0%/yrLatest (2025): $2,090 · +2.5% YoY. Source: county tax records.
Cash-flow waterfall
monthlySold comps — $/sqft
last 12 mo · ≤1 miLoading sold comps…