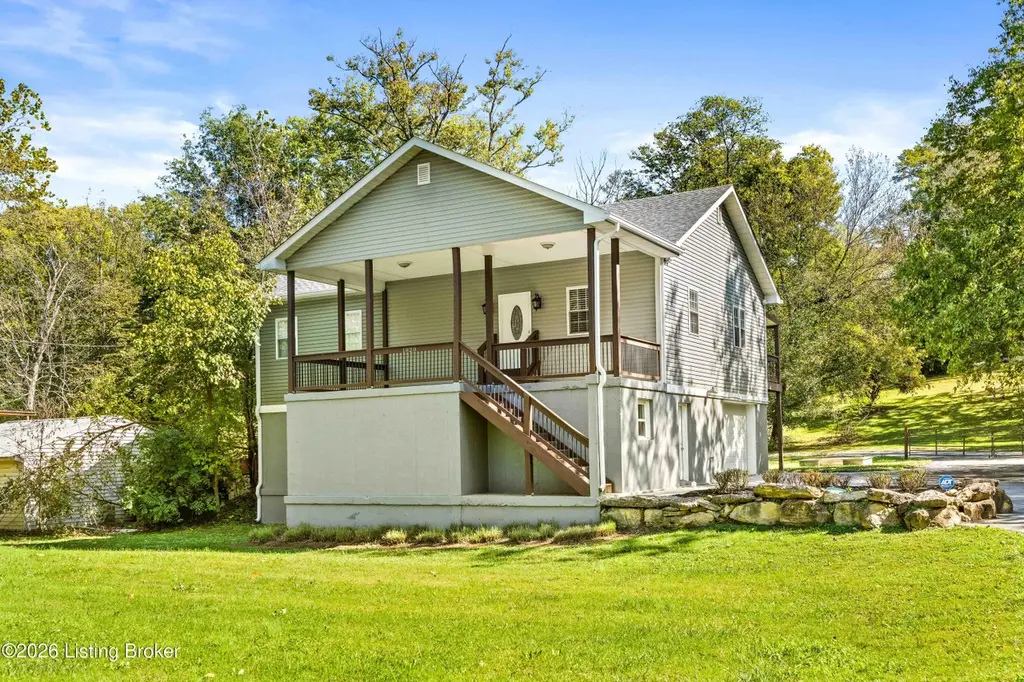
1820 Huckleberry Ln · Charlestown, IN
Flood risk 8/10 · Major
- FEMA flood zone
- AE
- Chance of flooding over 30 yrs
- 0.99%
- Est. flood insurance / yr
- $2,026 – $9,024
Fire risk 3/10 · Minor
- Est. fire insurance / yr
- $839 – $1,559
Heat risk 4/10 · Minor
- Hot days now (above 105°F)
- 7 days/yr
- Hot days in 30 yrs
- 20 days/yr
Wind risk 2/10 · Minimal
- Chance of severe wind over 30 yrs
- 2.0%
Air-quality risk 3/10 · Minor
- Unhealthy air days now
- 2 days/yr
- Unhealthy air days in 30 yrs
- 4 days/yr
Risk factors via First Street. Map © Google.
Why this score? — see what drove the D+ grade
The composite is a weighted blend of 9 inputs, each scored 0–100. Each bar is that input's sub-score; the figure is the points it added to the 100-point composite (weight × sub-score).
- ARV discount +15.0/15.0
- Cash flow +13.1/30.0
- Schools +4.7/10.0
- DSCR +3.9/10.0
- Rent growth +3.7/5.0
- Livability +3.2/5.0
- 1% rule +2.7/10.0
- Condition / age +2.5/5.0
- Appreciation +0.0/10.0
$379,950
🖨 Deal sheet (PDF) 📄 Offer letter ✓ Due diligence
Listing remarks MLS
RIVERSIDE COMMUNITY CLOSE TO THE OHIO RIVER. THIS SPACIOUS 3 BEDROOM, 2 BATH RAISED RANCH HOME WITH FULL UNFINISHED BASEMENT. THERE IS A NICE SIZED FRONT PORCH, LARGE DECK AND A COVER PATIO AREA. LOOKS CUSTOM BUILT. HAS OVER 1500 SQFT ON THE MAIN FLOOR. GREAT ROOM IS OPEN TO KITCHEN AND DINING AREAS.THERE IS AN ATTACHED GARAGE (OPEN TO BASEMENT AREA) WITH SIDE ENTRY. THE HOME ALSO HAS A ROUGHED IN BATH AND BAR AREA OR KITCHENETTE AREA IN THE WALK OUT BASEMENT. THE HOME HAS A BUILT-IN SAFE (LOCKED WITH NO AVAILABLE CODE OR COMBINATION).
Key facts
- Fire pit
- Custom tiled
- Boat launch nearby
Tags
Property features AI
Finance
- Other: Lot is approximately 0.44 acres; Lot is cleared, level and on a dead-end road; Flood insurance required; see remarks
- HOA & community: No association fee
Exterior
- Parking: Attached 2-car garage with side entry
- Utilities: Electricity connected
- Home design: Single-family residence; Raised ranch style; One story; Built in 2005
- Construction: Vinyl siding; Shingle roof; Poured concrete foundation
- Exterior features: Balcony
Interior
- Kitchen: Kitchen on the first floor; Dining area adjacent to the kitchen
- Bedrooms: 3 bedrooms total; Primary bedroom on the first floor; All bedrooms located on the first floor
- Bathrooms: 3 full bathrooms; Primary bathroom on the first floor; Additional full bathroom in the basement
- Heating & cooling: Electric heating (1 HVAC unit); Central air conditioning (1 HVAC unit)
- Interior features: Finished walkout basement with outside entry; Basement includes a media room, office and additional finished space; Dining area; Great room; Total of 7 main rooms (13 total rooms); 4 closets
- Laundry & utility: Laundry room on the first floor; First-floor laundry
Neighborhood map
What this means for you Summary
Snapshot
- This is a 3-bed/3.0-bath single-family listed at $380k.
Deal economics
- At list price, monthly cash flow is $-475 ($-6k/yr) — negative.
- To cash-flow at today's rent, offer at most $296k (22.1% below list).
- To meet the 1% rule (rent ≥ 1% of price), the offer needs to be $291k (23.4% below list).
- Recommended offer: $291k (23.4% below list) — sets the bar for 1% rule.
- Cap rate 6.2% vs local median 3.2% in Charlestown — top-decile yield for the area; either an underpriced asset or a hidden risk that comps aren't pricing in. Stress-test before assuming the spread holds.
Location & tenants
- Location reads 65/100 on livability (#352 in IN) — a middle-class / working-renter tenant base. Strengths: crime A+, cost of living A+, housing A+; Watch: amenities F, commute F, health & safety F.
- Oldham County (suburban): math 48% / reading 55% proficiency, ranked #6 of 165 in KY (top 4%) — acceptable for families but not a draw, mixed tenant base, ~2y average lease; only 16% free/reduced lunch — higher-income household profile.
- Zoned schools: Harmony Elementary School (math 56% / reading 59%, grade C+, #45 of 676 statewide, top 7%, 632 students, 12% FRL); North Oldham Middle School (math 51% / reading 66%, grade B, #4 of 217 statewide, top 2%, 787 students, 11% FRL); North Oldham High School (math 67% / reading 63%, grade B, #2 of 254 statewide, top 0%, 995 students, 12% FRL) — zoned schools at 12% FRL track the district average.
- Market conditions: Rents rising fast (+4.8%/yr); 1 comparable units currently listed for rent nearby; high-income renter base; 402 units permitted in Oldham County in 2024 (56 in 5+ unit buildings).
Forward outlook
- Local home prices are declining (-3.0%/yr); year-one equity from $3k of loan paydown is wiped out by about $11k of value loss. Plan a longer hold.
- Oldham County population projected at +32% by 2050 — long-run rental-demand tailwind backs the buy-and-hold thesis.
Negotiation context
- It's been on market 51 days — a 3% lower offer ($369k) is reasonable based on typical stale-listing flexibility.
- 4 sale attempts since 9y ago with the ask held roughly flat each time — persistent listings suggest the price (not the market) is what's stuck; bring a comps-based counter.
- Current owner paid $129k; list at $380k implies a 195% gain — meaningful room to come down on a strong offer.
Risks & watch-outs
- Watch-outs: flood insurance adds $460/mo.
- Climate carrying-cost: in FEMA flood zone AE (mandatory federal flood insurance) — expect insurance premiums to compound above CPI over the hold.
Questions for the listing agent
- What do current leases actually rent for vs. the listed asking? Can we see a recent rent roll and the last 12 months of T-12 income?
- It's been on market 51 days. Have you received any prior offers? Is the seller open to a 23% concession, seller financing, or rate buy-down credit?
- What's the actual annual flood-insurance premium (NFIP or private), and is the property in a SFHA with mandatory coverage?
- Is there a deadline driving the sale (1031 exchange, divorce, estate, relocation)? That informs how much negotiation room exists.
- Schools are D-rated, which usually means shorter tenancies and higher turnover. Who's the typical renter profile here, and what's been the actual vacancy rate?
- The area grade is low — what's the realistic commute time and amenity access for the typical tenant pool here? Any planned neighborhood developments (good or bad) we should know about?
- What's the average days-on-market for RENTAL listings here right now (not sales)? A rising rental-DOM trend means longer vacancies and softer asking-rent achievability than the comps imply.
- What's the recent tenant-quality profile in this submarket — average credit score on applications, eviction rate, late-payment / NSF rate, and stable-employment percentage? A property-management company in the area should have these aggregated.
- How much new for-sale + rental construction is in the pipeline within 1–3 miles? Heavy new supply typically softens prices + rents 12–24 months out; constrained supply supports both.
Investment metrics
- 1% rule
- 0.77% ✗
- Cap rate
- 6.25%
- Cash-on-cash
- -0.17%
- DSCR
- 0.99
- GRM
- 10.9
CMA / ARV
- ARV (median comp)
- $462,969
- List price
- $379,950
- Delta
- -17.93%
- Verdict
- UNDERPRICED
- Comps
- 5 within 1.0 mi
Show comp detail 3 sales within ~0.75 mi
| Address | Dist | Beds/Ba | Sqft | Sold | Price | $/sf | Match |
|---|---|---|---|---|---|---|---|
| 1510 Riverside Dr | 0.40mi | 3/2.5 | 2,371 (-0%) | 8mo | $457,500 | $193 | 72 |
| 1602 Riverside Dr | 0.27mi | 3/3.0 | 2,500 (+5%) | 15mo | $625,000 | $250 | 66 |
| 1524 Riverside Dr | 0.34mi | 2/2.5 (-1) | 2,655 (+12%) | 6mo | $300,000 | $113 | 53 |
Match score weights: distance 35% · size 25% · config 20% · recency 20%. Top-matched comps best support the ARV.
Projected returns pro-forma
-3.0% appreciation · 4.81% rent growth · sell at horizon
- IRR
- -23.3%
- Equity multiple
- 0.19×
- Total profit
- $-86,307
- Equity at exit
- $56,652
- IRR
- -13.5%
- Equity multiple
- 0.15×
- Total profit
- $-90,608
- Equity at exit
- $32,851
Cash invested: $106,386 (down + closing). Projections, not guarantees.
Landlord ↔ Tenant lean methodology
- Overall (STATE)
- 90 Strongly Landlord-Friendly
- State Indiana
- 90 Strongly Landlord-Friendly · R+11
- County
- — inherits STATE
- City
- — inherits STATE
ZIP-level market 40059
- Rents YoY
- 4.8%
- Price-to-rent
- 10.9×
Monthly cashflow live
- Estimated rent
- $2,910 medium interval (Pro) →
- Mortgage (P&I)
- −$1,992
- Tax from tax record
- −$163 /mo · $1,957/yr
- Insurance
- −$158
- Flood insurance flood zone
- −$460 /mo · $5,525/yr
- HOA
- −$0
- Vacancy / Maint / Mgmt
- −$611
- Net cashflow
- $-475
Break-even live
Sensitivity live
| Price | -10% $-260 | -5% $-368 | +0% $-475 | +5% $-583 | +10% $-690 |
|---|---|---|---|---|---|
| Rent | -10% $-705 | -5% $-590 | +0% $-475 | +5% $-360 | +10% $-245 |
| Rate | -1.0pp $-284 | -0.5pp $-379 | base $-475 | +0.5pp $-574 | +1.0pp $-674 |
UW: 25.0% down · 7.5% · 30yr · 1.5% tax · 5.0% vac · 8.0% maint · 8.0% mgmt
Financing live
Cash to close
- Down payment
- $94,988
- Closing costs
- $11,398
- Reserves months
- —
- Total cash needed
- —
Loan-product check · same deal, 3 products live
Conventional
25% down · 7.5% · 30yr
- Down + closing
- —
- Monthly P&I
- —
- Monthly cashflow
- —
- DSCR
- —
- Eligible?
- —
Personal DTI + credit; lowest rate.
DSCR
20% down · 8.5% · 30yr
- Down + closing
- —
- Monthly P&I
- —
- Monthly cashflow
- —
- DSCR
- —
- Eligible?
- —
No personal income docs; deal must DSCR.
Hard money
10% down · 12.0% · 12mo
- Down + closing
- —
- Monthly P&I
- —
- Monthly cashflow
- —
- DSCR
- —
- Eligible?
- —
Short-term bridge; refi at stabilization.
Rent comps 1 comps
| Address | Beds | Baths | Sqft | Rent | $/sqft | DOM | Units | Dist |
|---|---|---|---|---|---|---|---|---|
| 1606 Church Side Dr Goshen, KY | 4.0 | 4.0 | 2145 | $3,500 | $1.63 | 19d | 1 | 1.45mi |
Listing history 27 events
-
2026-06-21days on market $379,950 Active 51 DOM
-
2026-06-18days on market $379,950 Active 48 DOM
-
2026-06-17days on market $379,950 Active 47 DOM
-
2026-06-16days on market $379,950 Active 46 DOM
-
2026-06-15days on market $379,950 Active 45 DOM
-
2026-06-13days on market $379,950 Active 43 DOM
-
2026-06-10days on market $379,950 Active 40 DOM
-
2026-06-09days on market $379,950 Active 39 DOM
-
2026-06-08days on market $379,950 Active 38 DOM
-
2026-06-07days on market $379,950 Active 37 DOM
-
2026-06-05days on market $379,950 Active 34 DOM
-
2026-06-03days on market $379,950 Active 33 DOM
-
2026-06-02days on market $379,950 Active 32 DOM
-
2026-06-01days on market $379,950 Active 31 DOM
-
2026-05-31days on market $379,950 Active 30 DOM
-
2026-05-14price $379,950 794-char remark
-
2026-05-01$389,950 Active 794-char remark
-
2025-10-20price $399,950
-
2018-02-26soldstatus $128,750 Closed
Show marketing remark (541 chars)
RIVERSIDE COMMUNITY CLOSE TO THE OHIO RIVER. THIS SPACIOUS 3 BEDROOM, 2 BATH RAISED RANCH HOME WITH FULL UNFINISHED BASEMENT. THERE IS A NICE SIZED FRONT PORCH, LARGE DECK AND A COVER PATIO AREA. LOOKS CUSTOM BUILT. HAS OVER 1500 SQFT ON THE MAIN FLOOR. GREAT ROOM IS OPEN TO KITCHEN AND DINING AREAS.THERE IS AN ATTACHED GARAGE (OPEN TO BASEMENT AREA) WITH SIDE ENTRY. THE HOME ALSO HAS A ROUGHED IN BATH AND BAR AREA OR KITCHENETTE AREA IN THE WALK OUT BASEMENT. THE HOME HAS A BUILT-IN SAFE (LOCKED WITH NO AVAILABLE CODE OR COMBINATION).
-
2018-02-12historical
Show marketing remark (541 chars)
RIVERSIDE COMMUNITY CLOSE TO THE OHIO RIVER. THIS SPACIOUS 3 BEDROOM, 2 BATH RAISED RANCH HOME WITH FULL UNFINISHED BASEMENT. THERE IS A NICE SIZED FRONT PORCH, LARGE DECK AND A COVER PATIO AREA. LOOKS CUSTOM BUILT. HAS OVER 1500 SQFT ON THE MAIN FLOOR. GREAT ROOM IS OPEN TO KITCHEN AND DINING AREAS.THERE IS AN ATTACHED GARAGE (OPEN TO BASEMENT AREA) WITH SIDE ENTRY. THE HOME ALSO HAS A ROUGHED IN BATH AND BAR AREA OR KITCHENETTE AREA IN THE WALK OUT BASEMENT. THE HOME HAS A BUILT-IN SAFE (LOCKED WITH NO AVAILABLE CODE OR COMBINATION).
-
2018-02-10$140,000
Show marketing remark (541 chars)
RIVERSIDE COMMUNITY CLOSE TO THE OHIO RIVER. THIS SPACIOUS 3 BEDROOM, 2 BATH RAISED RANCH HOME WITH FULL UNFINISHED BASEMENT. THERE IS A NICE SIZED FRONT PORCH, LARGE DECK AND A COVER PATIO AREA. LOOKS CUSTOM BUILT. HAS OVER 1500 SQFT ON THE MAIN FLOOR. GREAT ROOM IS OPEN TO KITCHEN AND DINING AREAS.THERE IS AN ATTACHED GARAGE (OPEN TO BASEMENT AREA) WITH SIDE ENTRY. THE HOME ALSO HAS A ROUGHED IN BATH AND BAR AREA OR KITCHENETTE AREA IN THE WALK OUT BASEMENT. THE HOME HAS A BUILT-IN SAFE (LOCKED WITH NO AVAILABLE CODE OR COMBINATION).
-
2018-01-12status Pending
-
2018-01-12historical
-
2018-01-11$140,000 Active
-
2017-11-03status Pending
-
2017-11-02historical
-
2017-10-21$140,000 Active
ⓘ Source: listings_history table (triggers on properties + properties_extension) + one-shot
backfill from property_details.listing_events for pre-trigger history.
Tax reassessment forecast IN · Partial reset (capped growth)
- Current annual tax
- $1,957 · $163/mo
- Projected year-2 tax
- $2,593 · $216/mo
- Expected delta
- +$636/yr (+$53/mo · 32.5%)
ⓘ Screening estimate from a state-policy table — verify with the county assessor before closing.
Climate risk First Street
- Flood 8/10 Severe FEMA zone AE · 99% chance over 30 yrs
- Wildfire 3/10 Moderate
- Heat 4/10 Moderate 7 d/yr ≥105°F today · 20 d/yr by 30 yrs out
- Wind 2/10 Low 2% chance of damaging wind over 30 yrs
- Air quality 3/10 Moderate 2 unhealthy d/yr today · 4 by 30 yrs out
Nearby sold comps map
Loading sold comps map…
Walkable amenities ~0.75 mi
Loading nearby amenities…
Taxation est. · year 1
- Rental income
- $34,923
- − Mortgage interest
- −$21,283
- − Property taxes
- −$1,957
- − Insurance
- −$7,425
- − Repairs & maintenance
- −$2,794
- − Management
- −$2,794
- − Depreciation
- −$11,053
- Taxable loss
- −$12,383
- Est. tax savings @ 24.0%
- +$2,972
- After-tax cash flow
- $-2,731/yr
For passive investors: Depreciation is non-cash, so a rental often shows a tax loss while cash-flowing — sheltering income. Rental losses are passive: they offset passive income freely, and up to $25,000/yr can offset ordinary (W-2) income if you actively participate and your MAGI is under $100k (phasing out to $0 by $150k); unused losses carry forward. On sale, claimed depreciation is recaptured at up to 25%, and gains may owe capital-gains tax (a 1031 exchange can defer both). Figures are a year-1 estimate at your 24.0% rate — not tax advice; consult a CPA.
Schools (NCES district)
- District
- Oldham County
- NCES district ID
- 2104530
- Math proficiency
- 48% ▼ -15.00%
- Reading proficiency
- 55% ▼ -14.00%
- Median HH income
- $84,329
- Composite
- 47.29/100
- National rank
- #2303
- State rank
- #6 of 165 in KY
Livability — Charlestown
- Score
- 65/100
- State rank
- #352
- US rank
- #13430
Category grades
Schools grade is shown separately in the Schools card above.
Census & demographics
- County
- Jefferson County
- City population
- 17,738
- Metro
- Louisville/Jefferson County, KY-IN
- Population (ZIP)
- 20,892
- Household income
- $152,727
- Rent vs Own
- Severe rent burden
- 255.0
Population outlook (Oldham County) Hauer SSP2
- Today (2025)
- 75,661 people
- By 2030
- 80,948 · +7.0%
- By 2040
- 90,894 · +20.1%
- By 2050
- 100,168 · +32.4%
- By 2075
- 123,605 · +63.4%
- By 2100
- 133,523 · +76.5%
Race, ethnicity, and origin ACS 2023
- Neighborhood character
- Predominantly White (86%)
- Race & ethnicity
- White 86% Asian 4% Two or more races 4% Black 4% Hispanic / Latino 2%
- Common ancestry
- Slovak 4% Italian 3% Romanian 2%
- Foreign-born
- 8% · Canada, China
- Languages at home
- 93% English-only · Other Indo-European 3% Chinese 1% Spanish 1%
Political lean MEDSL · Oldham
- 2024 margin
- Strong R (+22.6) · D 37.7% · R 60.3% · Other 2.0%
- 2008→2024 swing
- +8.1pp toward D · 2008: -30.7pp · 2024: -22.6pp
- All cycles
- 2024: R+22.6 2020: R+21.4 2016: R+31.1 2012: R+36.6 2008: R+30.7
Not yet ingested
- Civics
- —
Market trends
- HPI YoY
- ▼ -159.22%
- Current HPI
- 229.5964
- Rent YoY
- ▲ 4.81%
- Metro
- Louisville/Jefferson County, KY-IN
- State GDP YoY
- ▲ 2.90%
- F500 in state
- 18
Industry mix (Fortune 500 HQ in IN)
| Industry | F500 HQs | Revenue |
|---|---|---|
| Industrial Machinery | 2 | $37B |
|
||
| Healthcare | 1 | $177B |
|
||
| Pharmaceuticals | 1 | $45B |
|
||
| Metals / Steel | 1 | $18B |
|
||
| Agriculture | 1 | $17B |
|
||
| Packaging | 1 | $12B |
|
||
Price history
+171.4% since first listed12 events — show timeline
- 2026-05-14 Price Changed $379,950 Metro Search MLS
- 2026-05-01 Listed $389,950 Metro Search MLS
- 2025-10-20 Price Changed $399,950 Metro Search MLS
- 2018-02-26 Sold (MLS) $128,750 Metro Search MLS
- 2018-02-12 Listing Removed — Metro Search MLS
- 2018-02-10 Listed $140,000 Metro Search MLS
- 2018-01-12 Pending — Metro Search MLS
- 2018-01-12 Listing Removed — Metro Search MLS
- 2018-01-11 Listed $140,000 Metro Search MLS
- 2017-11-03 Pending — Metro Search MLS
- 2017-11-02 Listing Removed — Metro Search MLS
- 2017-10-21 Listed $140,000 Metro Search MLS
Property tax history
-1.2%/yrLatest (2025): $1,957 · +0.1% YoY. Source: county tax records.
Cash-flow waterfall
monthlySold comps — $/sqft
last 12 mo · ≤1 miLoading sold comps…