 Multi-family
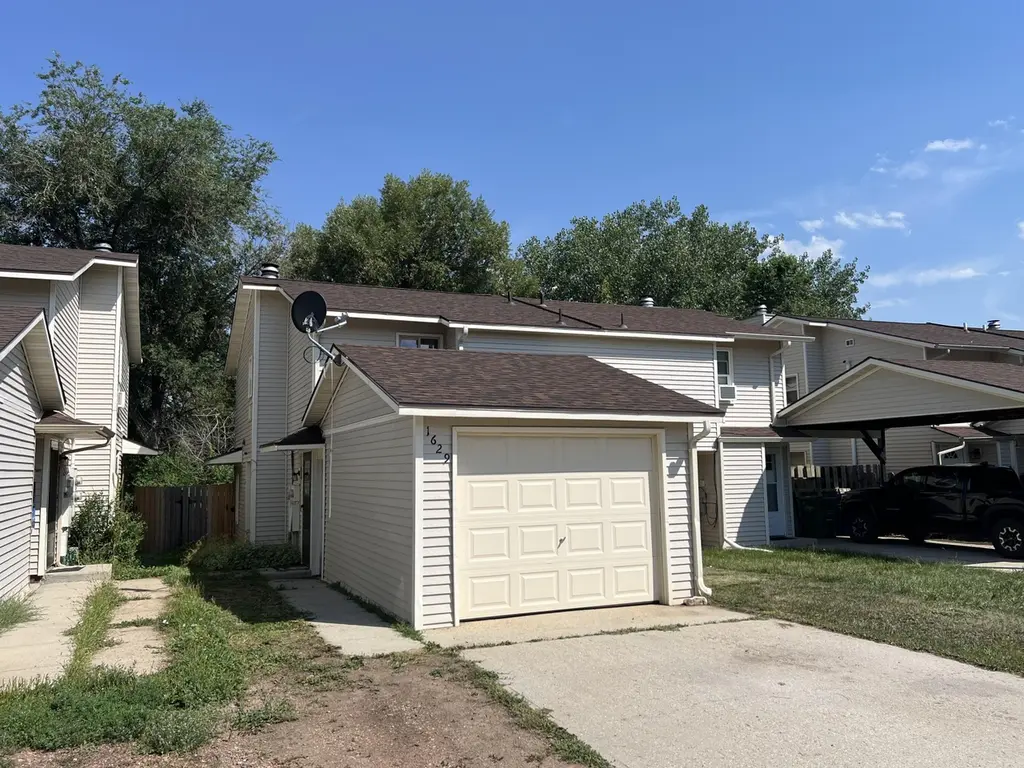
1629 Taylor Ave · Sheridan, WY
Flood risk 1/10 · Minimal
- FEMA flood zone
- X (unshaded)
- Chance of flooding over 30 yrs
- 0.0%
- Est. flood insurance / yr
- $507 – $1,088
Fire risk 5/10 · Moderate
- Est. fire insurance / yr
- $564 – $1,046
Heat risk 3/10 · Minor
- Hot days now (above 93°F)
- 7 days/yr
- Hot days in 30 yrs
- 16 days/yr
Wind risk 1/10 · Minimal
- Chance of severe wind over 30 yrs
- —
Air-quality risk 4/10 · Minor
- Unhealthy air days now
- 3 days/yr
- Unhealthy air days in 30 yrs
- 5 days/yr
Risk factors via First Street. Map © Google.
Why this score? — see what drove the B+ grade
The composite is a weighted blend of 9 inputs, each scored 0–100. Each bar is that input's sub-score; the figure is the points it added to the 100-point composite (weight × sub-score).
- Cash flow +30.0/30.0
- ARV discount +15.0/15.0
- 1% rule +10.0/10.0
- DSCR +10.0/10.0
- Schools +5.9/10.0
- Livability +4.0/5.0
- Rent growth +2.5/5.0
- Condition / age +2.5/5.0
- Appreciation +0.0/10.0
$249,000
🖨 Deal sheet (PDF) 📄 Offer letter ✓ Due diligence
Multi-family units
County records classify this as Multi-Family (2-4 Unit). Listing-text estimate: 1 unit. estimate disagrees with records
Listing remarks MLS
Check out this townhome! This 3 Bedroom, 1.5 bath home has a new roof and an attached garage, a patio, a fully fenced back yard and an attached utility shed. UPON CLOSING, PROPERTY WILL NOT BE REPORTED AS SOLD TO THE MLS DUE TO A CONFIDENTIALITY AGREEMENT.
Key facts
- New carpet
- New flooring
- New roof
Tags
Neighborhood map
What this means for you Summary
Snapshot
- This is a 3-bed/2.0-bath multifamily listed at $249k.
Deal economics
- At list price, monthly cash flow is $2k ($21k/yr) — positive.
- The deal already cash-flows at list — no discount required.
- Meets the 1% rule at list price ($4k rent vs $249k).
- Recommended offer: $219k (12.0% below list) — sets the bar for market timing.
- Cap rate 14.8% vs local median 2.4% in Sheridan — top-decile yield for the area; either an underpriced asset or a hidden risk that comps aren't pricing in. Stress-test before assuming the spread holds.
Location & tenants
- Location reads 79/100 on livability (#7 in WY, #2,337 nationally) — a middle-class / working-renter tenant base. Strengths: cost of living A+, health & safety A+, crime A; Watch: amenities C-, employment C-, commute F.
- Sheridan County School District #2 (town): math 68% / reading 72% proficiency, ranked #1 of 41 in WY (top 2%) — strong family-tenant draw, lease renewals of 3-5y typical.
- Zoned schools: Sagebrush Elementary (math 92% / reading 77%, grade A+, #1 of 151 statewide, top 1%, 326 students, 43% FRL); Sheridan Junior High School (math 60% / reading 73%, grade A-, #9 of 55 statewide, top 15%, 843 students, 28% FRL); Sheridan High School (math 71% / reading 75%, grade B+, #4 of 75 statewide, top 4%, 1,092 students, 24% FRL).
- Market conditions: 514 active listings in the ZIP; 309 units permitted in Sheridan County in 2024 (92 in 5+ unit buildings).
- At $4,108/mo this rent would consume 67% of the median local household income ($73k/yr) (locally 742% of renters already pay >50% of income on rent) — very limited rent-growth headroom before tenants either downsize or default.
Forward outlook
- Local home prices are declining (-3.0%/yr); year-one equity from $2k of loan paydown is wiped out by about $7k of value loss. Plan a longer hold.
- Sheridan County population projected at +8% by 2050 — modest demand growth; plan on rents tracking national, not racing it.
- At projected returns (-3.0% appreciation + 3.0% rent growth), your $70k cash investment doubles in ~4 years — after that, you're playing with house money.
Negotiation context
- It's been on market 307 days — a 12% lower offer ($219k) is reasonable based on typical stale-listing flexibility.
Risks & watch-outs
- Climate carrying-cost: moderate wildfire risk — expect insurance premiums to compound above CPI over the hold.
Questions for the listing agent
- It's been on market 307 days. Have you received any prior offers? Is the seller open to a 12% concession, seller financing, or rate buy-down credit?
- Built in 1979 — when were the roof, HVAC, electrical panel, plumbing, and water heater last replaced?
- Why hasn't it sold? Are there any deal-killer items the seller is aware of (foundation, flood, title, zoning, code violations)?
- Is there a deadline driving the sale (1031 exchange, divorce, estate, relocation)? That informs how much negotiation room exists.
- Schools are B-rated — typically a magnet for longer-tenancy family renters. What's the average tenant stay here, and is there a school-zone premium baked into asking?
- What's the average days-on-market for RENTAL listings here right now (not sales)? A rising rental-DOM trend means longer vacancies and softer asking-rent achievability than the comps imply.
- What's the recent tenant-quality profile in this submarket — average credit score on applications, eviction rate, late-payment / NSF rate, and stable-employment percentage? A property-management company in the area should have these aggregated.
- How much new apartment / multifamily construction is in the pipeline within 1–3 miles? Heavy new supply (>2% of stock underway) typically softens rents 12–24 months out; light construction supports rent growth.
Investment metrics
- 1% rule
- 1.65% ✓
- Cap rate
- 14.79%
- Cash-on-cash
- 30.34%
- DSCR
- 2.35
- GRM
- 5.1
CMA / ARV
- ARV (median comp)
- $330,796
- List price
- $249,000
- Delta
- -24.73%
- Verdict
- UNDERPRICED
- Comps
- 20 within 1.0 mi
Show comp detail 1 sale within ~0.75 mi
| Address | Dist | Beds/Ba | Sqft | Sold | Price | $/sf | Match |
|---|---|---|---|---|---|---|---|
| 940 & 942 Delphi Ave | 0.59mi | 2/2.0 (-1) | 1,260 (+12%) | 11mo | $280,000 | $222 | 38 |
Match score weights: distance 35% · size 25% · config 20% · recency 20%. Top-matched comps best support the ARV.
Projected returns pro-forma
-3.0% appreciation · 3.0% rent growth · sell at horizon
- IRR
- 25.0%
- Equity multiple
- 2.03×
- Total profit
- $71,835
- Equity at exit
- $37,127
- IRR
- 32.7%
- Equity multiple
- 3.97×
- Total profit
- $206,772
- Equity at exit
- $21,529
Cash invested: $69,720 (down + closing). Projections, not guarantees.
Landlord ↔ Tenant lean methodology
- Overall (STATE)
- 90 Strongly Landlord-Friendly
- State Wyoming
- 90 Strongly Landlord-Friendly · R+25
- County
- — inherits STATE
- City
- — inherits STATE
ZIP-level market 82801
- Active inventory
- 514
- Price-to-rent
- 15.2×
Monthly cashflow live
- Estimated rent
- $4,108 medium interval (Pro) →
- Mortgage (P&I)
- −$1,306
- Tax from tax record
- −$73 /mo · $877/yr
- Insurance
- −$104
- HOA
- −$0
- Vacancy / Maint / Mgmt
- −$863
- Net cashflow
- $1,763
Break-even live
Sensitivity live
| Price | -10% $1,904 | -5% $1,833 | +0% $1,763 | +5% $1,692 | +10% $1,622 |
|---|---|---|---|---|---|
| Rent | -10% $1,438 | -5% $1,600 | +0% $1,763 | +5% $1,925 | +10% $2,087 |
| Rate | -1.0pp $1,888 | -0.5pp $1,826 | base $1,763 | +0.5pp $1,698 | +1.0pp $1,633 |
3-unit breakdown (identical units grouped — click to expand)
| Units | Beds | Baths | Est. rent |
|---|---|---|---|
| 3× units | 2 | 1 | $4,107 |
| #1 | 2 | 1 | $1,369 |
| #2 | 2 | 1 | $1,369 |
| #3 | 2 | 1 | $1,369 |
| Total (3 units) | $4,108 | ||
UW: 25.0% down · 7.5% · 30yr · 1.5% tax · 5.0% vac · 8.0% maint · 8.0% mgmt
Financing live
Cash to close
- Down payment
- $62,250
- Closing costs
- $7,470
- Reserves months
- —
- Total cash needed
- —
Loan-product check · same deal, 3 products live
Conventional
25% down · 7.5% · 30yr
- Down + closing
- —
- Monthly P&I
- —
- Monthly cashflow
- —
- DSCR
- —
- Eligible?
- —
Personal DTI + credit; lowest rate.
DSCR
20% down · 8.5% · 30yr
- Down + closing
- —
- Monthly P&I
- —
- Monthly cashflow
- —
- DSCR
- —
- Eligible?
- —
No personal income docs; deal must DSCR.
Hard money
10% down · 12.0% · 12mo
- Down + closing
- —
- Monthly P&I
- —
- Monthly cashflow
- —
- DSCR
- —
- Eligible?
- —
Short-term bridge; refi at stabilization.
Listing history 21 events
-
2026-06-22days on market $249,000 Active 307 DOM
-
2026-06-19days on market $249,000 Active 304 DOM
-
2026-06-18days on market $249,000 Active 303 DOM
-
2026-06-17days on market $249,000 Active 302 DOM
-
2026-06-16days on market $249,000 Active 301 DOM
-
2026-06-15days on market $249,000 Active 300 DOM
-
2026-06-14days on market $249,000 Active 298 DOM
-
2026-06-12days on market $249,000 Active 297 DOM
-
2026-06-09days on market $249,000 Active 294 DOM
-
2026-06-08days on market $249,000 Active 293 DOM
-
2026-06-07days on market $249,000 Active 292 DOM
-
2026-06-05days on market $249,000 Active 290 DOM
-
2026-06-03days on market $249,000 Active 288 DOM
-
2026-06-02days on market $249,000 Active 287 DOM
-
2026-06-01days on market $249,000 Active 286 DOM
-
2026-05-31days on market $249,000 Active 285 DOM
-
2026-05-30days on market $249,000 Active 284 DOM
-
2026-05-06price $249,000 256-char remark
Show marketing remark (256 chars)
Check out this townhome! This 3 Bedroom, 1.5 bath home has a new roof and an attached garage, a patio, a fully fenced back yard and an attached utility shed. UPON CLOSING, PROPERTY WILL NOT BE REPORTED AS SOLD TO THE MLS DUE TO A CONFIDENTIALITY AGREEMENT.
-
2025-08-19$260,000 Active 256-char remark
Show marketing remark (256 chars)
Check out this townhome! This 3 Bedroom, 1.5 bath home has a new roof and an attached garage, a patio, a fully fenced back yard and an attached utility shed. UPON CLOSING, PROPERTY WILL NOT BE REPORTED AS SOLD TO THE MLS DUE TO A CONFIDENTIALITY AGREEMENT.
-
2002-12-20soldstatus
-
1990-11-01soldstatus
ⓘ Source: listings_history table (triggers on properties + properties_extension) + one-shot
backfill from property_details.listing_events for pre-trigger history.
Tax reassessment forecast WY · Resets to sale price
- Current annual tax
- $877 · $73/mo
- Projected year-2 tax
- $1,519 · $127/mo
- Expected delta
- +$642/yr (+$53/mo · 73.2%)
ⓘ Screening estimate from a state-policy table — verify with the county assessor before closing.
Climate risk First Street
- Flood 1/10 Low FEMA zone X (unshaded) · 0% chance over 30 yrs
- Wildfire 5/10 Major
- Heat 3/10 Moderate 7 d/yr ≥93°F today · 16 d/yr by 30 yrs out
- Wind 1/10 Low
- Air quality 4/10 Moderate 3 unhealthy d/yr today · 5 by 30 yrs out
Nearby sold comps map
Loading sold comps map…
Walkable amenities ~0.75 mi
Loading nearby amenities…
Taxation est. · year 1
- Rental income
- $49,296
- − Mortgage interest
- −$13,948
- − Property taxes
- −$877
- − Insurance
- −$1,245
- − Repairs & maintenance
- −$3,944
- − Management
- −$3,944
- − Depreciation
- −$7,244
- Taxable income
- $18,095
- Est. tax owed @ 24.0%
- −$4,343
- After-tax cash flow
- $16,810/yr
For passive investors: Depreciation is non-cash, so a rental often shows a tax loss while cash-flowing — sheltering income. Rental losses are passive: they offset passive income freely, and up to $25,000/yr can offset ordinary (W-2) income if you actively participate and your MAGI is under $100k (phasing out to $0 by $150k); unused losses carry forward. On sale, claimed depreciation is recaptured at up to 25%, and gains may owe capital-gains tax (a 1031 exchange can defer both). Figures are a year-1 estimate at your 24.0% rate — not tax advice; consult a CPA.
Schools (NCES district)
- District
- Sheridan County School District #2
- NCES district ID
- 5605695
- Math proficiency
- 68% ▼ -4.00%
- Reading proficiency
- 72% ▼ -3.00%
- Median HH income
- $50,902
- Composite
- 59.44/100
- National rank
- #923
- State rank
- #1 of 41 in WY
Livability — Sheridan
- Score
- 79/100
- State rank
- #7
- US rank
- #2337
Category grades
Schools grade is shown separately in the Schools card above.
Census & demographics
- Census place
- Sheridan, WY
- County
- Sheridan County · 26,310 people
- City population
- 26,310
- Metro
- Sheridan, WY
- Population (ZIP)
- 26,310
- Household income
- $73,213
- Rent vs Own
- Severe rent burden
- 742.0
Population outlook (Sheridan County) Hauer SSP2
- Today (2025)
- 32,048 people
- By 2030
- 32,834 · +2.5%
- By 2040
- 33,843 · +5.6%
- By 2050
- 34,744 · +8.4%
- By 2075
- 37,231 · +16.2%
- By 2100
- 37,261 · +16.3%
Race, ethnicity, and origin ACS 2023
- Neighborhood character
- Predominantly White (88%)
- Race & ethnicity
- White 88% Hispanic / Latino 5% Two or more races 4% Native American 1% Asian 1%
- Hispanic origin (detail)
- Mexican 4%
- Common ancestry
- Portuguese 5% Slovak 4% Italian 2%
- Foreign-born
- 2% · Canada
- Languages at home
- 97% English-only · Spanish 2%
Political lean MEDSL · Sheridan
- 2024 margin
- Solid R (+50.1) · D 24.2% · R 74.2% · Other 1.6%
- 2008→2024 swing
- -11.9pp toward R · 2008: -38.2pp · 2024: -50.1pp
- All cycles
- 2024: R+50.1 2020: R+47.5 2016: R+51.7 2012: R+46.8 2008: R+38.2
Not yet ingested
- Civics
- —
Market trends
- HPI YoY
- ▼ -194.82%
- Current HPI
- 190.3135
- Rent YoY
- —
- Metro
- Sheridan, WY
- State GDP YoY
- —
- F500 in state
- 0
Price history
-4.2% since first listed4 events — show timeline
- 2026-05-06 Price Changed $249,000 SBORWY
- 2025-08-19 Listed $260,000 SBORWY
- 2002-12-20 Sold (Public Records) — Public Records
- 1990-11-01 Sold (Public Records) — Public Records
Property tax history
+3.1%/yrLatest (2025): $877 · -23.4% YoY. Source: county tax records.
Cash-flow waterfall
monthlySold comps — $/sqft
last 12 mo · ≤1 miLoading sold comps…