438139 E 360 · Big Cabin, OK
Flood risk 1/10 · Minimal
- FEMA flood zone
- X (unshaded)
- Chance of flooding over 30 yrs
- 0.0%
- Est. flood insurance / yr
- $507 – $1,088
Fire risk 5/10 · Moderate
- Est. fire insurance / yr
- $2,463 – $4,575
Heat risk 5/10 · Moderate
- Hot days now (above 111°F)
- 6 days/yr
- Hot days in 30 yrs
- 16 days/yr
Wind risk 2/10 · Minimal
- Chance of severe wind over 30 yrs
- 3.0%
Air-quality risk 2/10 · Minimal
- Unhealthy air days now
- 1 days/yr
- Unhealthy air days in 30 yrs
- 2 days/yr
Risk factors via First Street. Map © Google.
Why this score? — see what drove the D grade
The composite is a weighted blend of 9 inputs, each scored 0–100. Each bar is that input's sub-score; the figure is the points it added to the 100-point composite (weight × sub-score).
- Cash flow +11.4/30.0
- ARV discount +7.5/15.0
- Appreciation +6.4/10.0
- DSCR +3.3/10.0
- Livability +2.9/5.0
- Rent growth +2.5/5.0
- Condition / age +2.5/5.0
- 1% rule +2.1/10.0
- Schools +1.8/10.0
$169,900
🖨 Deal sheet 📄 Offer letter ✓ Due diligence
Listing remarks
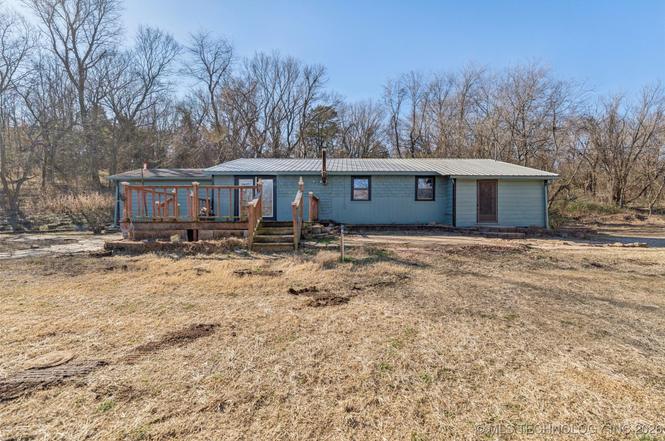
Investors! Neat little ten acre place that is wooded and secluded. The home has three bedrooms and one bathroom. Needs some work to bring it up to date. There is also a utility shed and storage building on the property. Go take a look!
Key facts
- Utility shed
- Secluded
- Storage building
Tags
Property features AI
Finance
- Financial info: Annual tax information provided (details excluded per instructions)
Exterior
- Parking: Dirt driveway
- Security: No safety shelter
- Utilities: Electricity available; Fiber optic available; Phone available; Satellite internet available; Water available; Rural water source; Septic tank
- Home design: One-story home; Faces east; Slab foundation
- Construction: Wood siding and wood frame construction; Asphalt/fiberglass roof; Built according to public records
- Exterior features: Dirt driveway; Shed(s) / storage; Barbed wire fencing; Property used as farm/ranch with mature trees
Interior
- Kitchen: Kitchen with breakfast nook; Laminate counters; Electric oven and range connections
- Bedrooms: Master bedroom with separate closets (first level); Two additional bedrooms with walk-in closets (first level)
- Flooring: Laminate counters noted (flooring type not specified)
- Bathrooms: One full bathroom with bathtub and separate shower (hall bath, first level)
- Heating & cooling: Zoned cooling; Zoned heating with electric and gas
- Interior features: Aluminum and wood window frames; Accessible doors; Laminate counters; Electric oven/range connections; One fireplace
- Laundry & utility: Utility room inside the home (first level); Electric dryer hookup; Electric water heater
Neighborhood map
What this means for you Summary
Snapshot
- This is a 3-bed/1.0-bath single-family listed at $170k.
Deal economics
- At list price, monthly cash flow is $-59 ($-708/yr) — negative.
- To cash-flow at today's rent, offer at most $159k (6.1% below list).
- To meet the 1% rule (rent ≥ 1% of price), the offer needs to be $121k (28.8% below list).
- Recommended offer: $121k (28.8% below list) — sets the bar for 1% rule.
Location & tenants
- Location reads 58/100 on livability (#448 in OK) — a working-class tenant base; expect higher turnover. Strengths: cost of living A+, housing A+; Watch: schools F, crime F, amenities F.
- Vinita (town): math 24% / reading 20% proficiency, ranked #156 of 270 in OK (top 58%) — low school quality limits family demand, transient renter base, plan for 1-2y turnover.
- Market conditions: 27 active listings in the ZIP; 23 units permitted in Mayes County in 2024 (0 in 5+ unit buildings).
Forward outlook
- In year one you build about $6k of equity ($1k loan paydown + $5k appreciation (2.9% local appreciation)).
- Mayes County population projected at -10% by 2050 — secular population decline; favor cash flow + early exit over multi-decade hold.
- At projected returns (2.9% appreciation + 3.0% rent growth), your $48k cash investment doubles in ~7 years — after that, you're playing with house money.
- By year 6, paydown + projected appreciation supports a ~$32k cash-out refi (75% LTV) — recoverable capital for the next deal without selling this one.
Negotiation context
- It's been on market 146 days — a 12% lower offer ($150k) is reasonable based on typical stale-listing flexibility.
Risks & watch-outs
- Watch-outs: built in 1955 — expect roof / HVAC / electrical / plumbing capex.
- Climate carrying-cost: moderate wildfire risk; extreme-heat days projected 6→16/yr by 2055 (HVAC capex compounding) — expect insurance premiums to compound above CPI over the hold.
Questions for the listing agent
- What do current leases actually rent for vs. the listed asking? Can we see a recent rent roll and the last 12 months of T-12 income?
- It's been on market 146 days. Have you received any prior offers? Is the seller open to a 29% concession, seller financing, or rate buy-down credit?
- Built in 1955 — when were the roof, HVAC, electrical panel, plumbing, and water heater last replaced?
- Why hasn't it sold? Are there any deal-killer items the seller is aware of (foundation, flood, title, zoning, code violations)?
- Is there a deadline driving the sale (1031 exchange, divorce, estate, relocation)? That informs how much negotiation room exists.
- Schools are F-rated, which usually means shorter tenancies and higher turnover. Who's the typical renter profile here, and what's been the actual vacancy rate?
- Crime grade is F in this area — have there been break-ins, vandalism, or insurance claims at this property in the last 3 years? What carrier currently insures it and at what premium?
- The area grade is low — what's the realistic commute time and amenity access for the typical tenant pool here? Any planned neighborhood developments (good or bad) we should know about?
- What's the average days-on-market for RENTAL listings here right now (not sales)? A rising rental-DOM trend means longer vacancies and softer asking-rent achievability than the comps imply.
- What's the recent tenant-quality profile in this submarket — average credit score on applications, eviction rate, late-payment / NSF rate, and stable-employment percentage? A property-management company in the area should have these aggregated.
- How much new for-sale + rental construction is in the pipeline within 1–3 miles? Heavy new supply typically softens prices + rents 12–24 months out; constrained supply supports both.
Investment metrics
- 1% rule
- 0.71% ✗
- Cap rate
- 5.88%
- Cash-on-cash
- -1.49%
- DSCR
- 0.93
- GRM
- 11.7
CMA / ARV
- ARV (on-the-fly)
- $361,500
- Comps found
- 1
Show comp detail 1 sale within ~0.75 mi
| Address | Dist | Beds/Ba | Sqft | Sold | Price | $/sf | Match |
|---|---|---|---|---|---|---|---|
| 438122 E 360 Rd | 0.50mi | 4/2.0 (+1) | 1,724 (+15%) | 11mo | $415,000 | $241 | 34 |
Match score weights: distance 35% · size 25% · config 20% · recency 20%. Top-matched comps best support the ARV.
Projected returns pro-forma
2.87% appreciation · 3.0% rent growth · sell at horizon
- IRR
- 5.7%
- Equity multiple
- 1.32×
- Total profit
- $15,428
- Equity at exit
- $75,118
- IRR
- 8.7%
- Equity multiple
- 2.30×
- Total profit
- $61,606
- Equity at exit
- $114,784
Cash invested: $47,572 (down + closing). Projections, not guarantees.
Landlord ↔ Tenant lean methodology
- Overall (STATE)
- 83 Strongly Landlord-Friendly
- State Oklahoma
- 83 Strongly Landlord-Friendly · R+20
- County
- — inherits STATE
- City
- — inherits STATE
ZIP-level market 74332
- Home prices YoY
- 1.0%
- Active inventory
- 27
- Price-to-rent
- 11.7×
Monthly cashflow live
- Estimated rent
- $1,209 medium interval (Pro) →
- Mortgage (P&I)
- −$891
- Tax from tax record
- −$52 /mo · $630/yr
- Insurance
- −$71
- HOA
- −$0
- Vacancy / Maint / Mgmt
- −$254
- Net cashflow
- $-59
Break-even live
UW: 25.0% down · 7.5% · 30yr · 1.5% tax · 5.0% vac · 8.0% maint · 8.0% mgmt
Financing live
Cash to close
- Down payment
- $42,475
- Closing costs
- $5,097
- Reserves months
- —
- Total cash needed
- —
Loan-product check · same deal, 3 products live
Conventional
25% down · 7.5% · 30yr
- Down + closing
- —
- Monthly P&I
- —
- Monthly cashflow
- —
- DSCR
- —
- Eligible?
- —
Personal DTI + credit; lowest rate.
DSCR
20% down · 8.5% · 30yr
- Down + closing
- —
- Monthly P&I
- —
- Monthly cashflow
- —
- DSCR
- —
- Eligible?
- —
No personal income docs; deal must DSCR.
Hard money
10% down · 12.0% · 12mo
- Down + closing
- —
- Monthly P&I
- —
- Monthly cashflow
- —
- DSCR
- —
- Eligible?
- —
Short-term bridge; refi at stabilization.
Listing history 16 events
-
2026-06-18days on market $169,900 Active 146 DOM
-
2026-06-17days on market $169,900 Active 145 DOM
-
2026-06-16days on market $169,900 Active 144 DOM
-
2026-06-15days on market $169,900 Active 143 DOM
-
2026-06-13days on market $169,900 Active 141 DOM
-
2026-06-12days on market $169,900 Active 140 DOM
-
2026-06-09days on market $169,900 Active 137 DOM
-
2026-06-08days on market $169,900 Active 136 DOM
-
2026-06-08days on market $169,900 Active 135 DOM
-
2026-06-07days on market $169,900 Active 134 DOM
-
2026-06-04days on market $169,900 Active 131 DOM
-
2026-06-02days on market $169,900 Active 130 DOM
-
2026-06-01days on market $169,900 Active 129 DOM
-
2026-05-31days on market $169,900 Active 128 DOM
-
2026-03-13price $169,900
-
2026-01-23$199,900 Active
ⓘ Source: listings_history table (triggers on properties + properties_extension) + one-shot
backfill from property_details.listing_events for pre-trigger history.
Tax reassessment forecast OK · Resets to sale price
- Current annual tax
- $630 · $52/mo
- Projected year-2 tax
- $1,529 · $127/mo
- Expected delta
- +$899/yr (+$75/mo · 142.7%)
ⓘ Screening estimate from a state-policy table — verify with the county assessor before closing.
Climate risk First Street
- Flood 1/10 Low FEMA zone X (unshaded) · 0% chance over 30 yrs
- Wildfire 5/10 Major
- Heat 5/10 Major 6 d/yr ≥111°F today · 16 d/yr by 30 yrs out
- Wind 2/10 Low 3% chance of damaging wind over 30 yrs
- Air quality 2/10 Low 1 unhealthy d/yr today · 2 by 30 yrs out
Nearby sold comps map
Loading sold comps map…
Walkable amenities ~0.75 mi
Loading nearby amenities…
Taxation est. · year 1
- Rental income
- $14,510
- − Mortgage interest
- −$9,517
- − Property taxes
- −$630
- − Insurance
- −$850
- − Repairs & maintenance
- −$1,161
- − Management
- −$1,161
- − Depreciation
- −$4,943
- Taxable loss
- −$3,751
- Est. tax savings @ 24.0%
- +$900
- After-tax cash flow
- $192/yr
For passive investors: Depreciation is non-cash, so a rental often shows a tax loss while cash-flowing — sheltering income. Rental losses are passive: they offset passive income freely, and up to $25,000/yr can offset ordinary (W-2) income if you actively participate and your MAGI is under $100k (phasing out to $0 by $150k); unused losses carry forward. On sale, claimed depreciation is recaptured at up to 25%, and gains may owe capital-gains tax (a 1031 exchange can defer both). Figures are a year-1 estimate at your 24.0% rate — not tax advice; consult a CPA.
Schools (NCES district)
- District
- Vinita
- NCES district ID
- 4031290
- Math proficiency
- 24% ▼ -10.00%
- Reading proficiency
- 20% ▼ -7.00%
- Median HH income
- $37,171
- Composite
- 18.37/100
- National rank
- #8943
- State rank
- #156 of 270 in OK
Livability — Big Cabin
- Score
- 58/100
- State rank
- #448
- US rank
- #21430
Category grades
Schools grade is shown separately in the Schools card above.
Census & demographics
- Population (ZIP)
- 1,808
Population outlook (Mayes County) Hauer SSP2
- Today (2025)
- 39,941 people
- By 2030
- 39,172 · -1.9%
- By 2040
- 37,540 · -6.0%
- By 2050
- 35,854 · -10.2%
- By 2075
- 32,361 · -19.0%
- By 2100
- 28,054 · -29.8%
Race, ethnicity, and origin ACS 2023
- Neighborhood character
- Diverse neighborhood (Simpson 0.62)
- Race & ethnicity
- White 62% Two or more races 17% Native American 14% Asian 3% Hispanic / Latino 1%
- Common ancestry
- Iranian 2% Lithuanian 2% European 1%
- Foreign-born
- 2% · China
- Languages at home
- 97% English-only · Other Asian/Pacific 2% Chinese 1%
Political lean MEDSL · Mayes
- 2024 margin
- Solid R (+57.5) · D 20.3% · R 77.8% · Other 1.9%
- 2008→2024 swing
- -29.4pp toward R · 2008: -28.1pp · 2024: -57.5pp
- All cycles
- 2024: R+57.5 2020: R+55.1 2016: R+51.7 2012: R+33.3 2008: R+28.1
Not yet ingested
- Civics
- —
Market trends
- HPI YoY
- ▲ 2.87%
- Current HPI
- 302.9067
- Rent YoY
- —
- Metro
- —
- State GDP YoY
- ▲ 1.55%
- F500 in state
- 6
Industry mix (Fortune 500 HQ in OK)
| Industry | F500 HQs | Revenue |
|---|---|---|
| Energy | 3 | $48B |
|
||
Price history
-15.0% since first listed2 events — show timeline
- 2026-03-13 Price Changed $169,900 MLS Technology, Inc.
- 2026-01-23 Listed $199,900 MLS Technology, Inc.
Property tax history
+8.3%/yrLatest (2025): $630 · +3.8% YoY. Source: county tax records.
Cash-flow waterfall
monthlySold comps — $/sqft
last 12 mo · ≤1 miLoading sold comps…