1991 Cr 3790 · Joaquin, TX
Flood risk 1/10 · Minimal
- FEMA flood zone
- —
- Chance of flooding over 30 yrs
- 0.0%
- Est. flood insurance / yr
- —
Fire risk 5/10 · Moderate
- Est. fire insurance / yr
- $1,222 – $2,270
Heat risk 7/10 · Major
- Hot days now (above 112°F)
- 7 days/yr
- Hot days in 30 yrs
- 21 days/yr
Wind risk 8/10 · Major
- Chance of severe wind over 30 yrs
- 80.0%
Air-quality risk 1/10 · Minimal
- Unhealthy air days now
- 0 days/yr
- Unhealthy air days in 30 yrs
- 0 days/yr
Risk factors via First Street. Map © Google.
Why this score? — see what drove the D+ grade
The composite is a weighted blend of 9 inputs, each scored 0–100. Each bar is that input's sub-score; the figure is the points it added to the 100-point composite (weight × sub-score).
- Cash flow +15.1/30.0
- ARV discount +7.5/15.0
- DSCR +4.6/10.0
- 1% rule +4.2/10.0
- Schools +4.1/10.0
- Appreciation +3.4/10.0
- Livability +2.9/5.0
- Rent growth +2.5/5.0
- Condition / age +2.5/5.0
$79,500
🖨 Deal sheet (PDF) 📄 Offer letter ✓ Due diligence
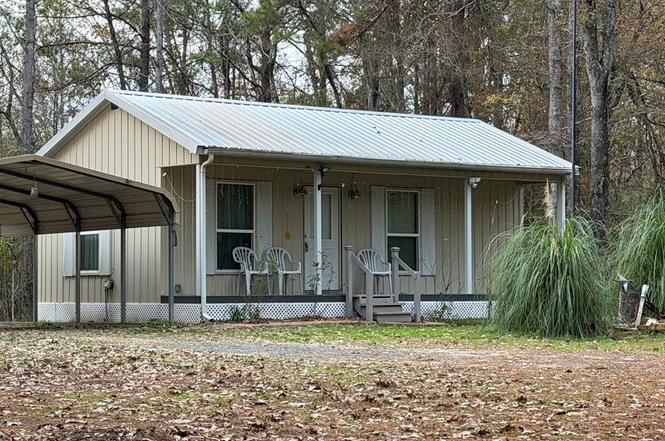
Listing remarks
WELCOME HOME! 1/1, Well Built, 540 sf, Tiny Home, Cathedral Metal Ceiling in LR, Kitchen w/ Refrigerator, Stove, Washer-Dryer in one, Nice Shower, Tankless Water Heater, Metal Exterior, Metal Roof, Front Porch, Dbl Portocover, 8 x 40 Conex with electricity, 4 inch Deep Well with filter, Built Well House, Gravel Driveway, All situated on 0.675 ac, good amount of trees, old home place with huge oak standing near the County Road. Located just off of Hwy 84, Joaquin ISD!
Key facts
- Washer-dryer in one
- Metal roof
- Metal exterior
Tags
Neighborhood map
What this means for you Summary
Snapshot
- This is a 1-bed/1.0-bath single-family listed at $80k.
Deal economics
- At list price, monthly cash flow is $26 ($308/yr) — positive.
- The deal already cash-flows at list — no discount required.
- To meet the 1% rule (rent ≥ 1% of price), the offer needs to be $73k (8.4% below list).
- Recommended offer: $70k (12.0% below list) — sets the bar for market timing.
Location & tenants
- Location reads 58/100 on livability (#1,199 in TX) — a working-class tenant base; expect higher turnover. Strengths: cost of living A+, housing A+; Watch: crime F, amenities F, commute F.
- Joaquin ISD (rural): math 52% / reading 46% proficiency, ranked #202 of 826 in TX (top 24%) — families likely to look elsewhere, expect single-tenant / working-renter base with shorter leases.
- Zoned schools: Joaquin El (math 47% / reading 37%, grade F, #1,335 of 4,322 statewide, top 33%, 344 students, 68% FRL); Joaquin J H School (math 57% / reading 42%, grade C, #356 of 1,662 statewide, top 23%, 145 students, 63% FRL); Joaquin H S (math 54% / reading 74%, grade B-, #199 of 1,632 statewide, top 14%, 222 students, 53% FRL).
- Market conditions: 32 active listings in the ZIP; 1 units permitted in Shelby County in 2024 (0 in 5+ unit buildings).
Forward outlook
- Local home prices are declining (-3.0%/yr); year-one equity from $550 of loan paydown is wiped out by about $2k of value loss. Plan a longer hold.
- Shelby County population projected to shrink 4% by 2050 — rents likely to lag national; underwrite the cash flow, not the appreciation.
Negotiation context
- It's been on market 126 days — a 12% lower offer ($70k) is reasonable based on typical stale-listing flexibility.
Risks & watch-outs
- Climate carrying-cost: severe wind risk, 80% chance of damaging wind over 30y; moderate wildfire risk; extreme-heat days projected 7→21/yr by 2055 (HVAC capex compounding) — expect insurance premiums to compound above CPI over the hold.
Questions for the listing agent
- It's been on market 126 days. Have you received any prior offers? Is the seller open to a 12% concession, seller financing, or rate buy-down credit?
- Why hasn't it sold? Are there any deal-killer items the seller is aware of (foundation, flood, title, zoning, code violations)?
- Is there a deadline driving the sale (1031 exchange, divorce, estate, relocation)? That informs how much negotiation room exists.
- Crime grade is F in this area — have there been break-ins, vandalism, or insurance claims at this property in the last 3 years? What carrier currently insures it and at what premium?
- The area grade is low — what's the realistic commute time and amenity access for the typical tenant pool here? Any planned neighborhood developments (good or bad) we should know about?
- What's the average days-on-market for RENTAL listings here right now (not sales)? A rising rental-DOM trend means longer vacancies and softer asking-rent achievability than the comps imply.
- What's the recent tenant-quality profile in this submarket — average credit score on applications, eviction rate, late-payment / NSF rate, and stable-employment percentage? A property-management company in the area should have these aggregated.
- How much new for-sale + rental construction is in the pipeline within 1–3 miles? Heavy new supply typically softens prices + rents 12–24 months out; constrained supply supports both.
Investment metrics
- 1% rule
- 0.92% ✗
- Cap rate
- 6.68%
- Cash-on-cash
- 1.38%
- DSCR
- 1.06
- GRM
- 9.1
CMA / ARV
No comps found within radius.
Projected returns pro-forma
-3.0% appreciation · 3.0% rent growth · sell at horizon
- IRR
- -14.1%
- Equity multiple
- 0.50×
- Total profit
- $-11,237
- Equity at exit
- $11,854
- IRR
- -5.3%
- Equity multiple
- 0.66×
- Total profit
- $-7,636
- Equity at exit
- $6,874
Cash invested: $22,260 (down + closing). Projections, not guarantees.
Landlord ↔ Tenant lean methodology
- Overall (STATE)
- 87 Strongly Landlord-Friendly
- State Texas
- 87 Strongly Landlord-Friendly · R+5
- County
- — inherits STATE
- City
- — inherits STATE
ZIP-level market 75954
- Home prices YoY
- -2.4%
- Active inventory
- 32
- Price-to-rent
- 9.1×
Monthly cashflow live
- Estimated rent
- $728 medium interval (Pro) →
- Mortgage (P&I)
- −$417
- Tax est. 1.5%
- −$99 /mo · $1,192/yr
- Insurance
- −$33
- HOA
- −$0
- Vacancy / Maint / Mgmt
- −$153
- Net cashflow
- $26
Break-even live
Sensitivity live
| Price | -10% $81 | -5% $53 | +0% $26 | +5% $-2 | +10% $-29 |
|---|---|---|---|---|---|
| Rent | -10% $-32 | -5% $-3 | +0% $26 | +5% $54 | +10% $83 |
| Rate | -1.0pp $66 | -0.5pp $46 | base $26 | +0.5pp $5 | +1.0pp $-16 |
UW: 25.0% down · 7.5% · 30yr · 1.5% tax · 5.0% vac · 8.0% maint · 8.0% mgmt
Financing live
Cash to close
- Down payment
- $19,875
- Closing costs
- $2,385
- Reserves months
- —
- Total cash needed
- —
Loan-product check · same deal, 3 products live
Conventional
25% down · 7.5% · 30yr
- Down + closing
- —
- Monthly P&I
- —
- Monthly cashflow
- —
- DSCR
- —
- Eligible?
- —
Personal DTI + credit; lowest rate.
DSCR
20% down · 8.5% · 30yr
- Down + closing
- —
- Monthly P&I
- —
- Monthly cashflow
- —
- DSCR
- —
- Eligible?
- —
No personal income docs; deal must DSCR.
Hard money
10% down · 12.0% · 12mo
- Down + closing
- —
- Monthly P&I
- —
- Monthly cashflow
- —
- DSCR
- —
- Eligible?
- —
Short-term bridge; refi at stabilization.
Listing history 5 events
-
2026-04-21status Pending
-
2026-03-23price $79,500
-
2026-03-04price $95,000
-
2026-01-23price $99,500
-
2025-12-15$105,000 Active
ⓘ Source: listings_history table (triggers on properties + properties_extension) + one-shot
backfill from property_details.listing_events for pre-trigger history.
Climate risk First Street
- Flood 1/10 Low 0% chance over 30 yrs
- Wildfire 5/10 Major
- Heat 7/10 Severe 7 d/yr ≥112°F today · 21 d/yr by 30 yrs out
- Wind 8/10 Severe 80% chance of damaging wind over 30 yrs
- Air quality 1/10 Low 0 unhealthy d/yr today · 0 by 30 yrs out
Nearby sold comps map
Loading sold comps map…
Walkable amenities ~0.75 mi
Loading nearby amenities…
Taxation est. · year 1
- Rental income
- $8,735
- − Mortgage interest
- −$4,453
- − Property taxes
- −$1,192
- − Insurance
- −$398
- − Repairs & maintenance
- −$699
- − Management
- −$699
- − Depreciation
- −$2,313
- Taxable loss
- −$1,018
- Est. tax savings @ 24.0%
- +$244
- After-tax cash flow
- $552/yr
For passive investors: Depreciation is non-cash, so a rental often shows a tax loss while cash-flowing — sheltering income. Rental losses are passive: they offset passive income freely, and up to $25,000/yr can offset ordinary (W-2) income if you actively participate and your MAGI is under $100k (phasing out to $0 by $150k); unused losses carry forward. On sale, claimed depreciation is recaptured at up to 25%, and gains may owe capital-gains tax (a 1031 exchange can defer both). Figures are a year-1 estimate at your 24.0% rate — not tax advice; consult a CPA.
Schools (NCES district)
- District
- Joaquin ISD
- NCES district ID
- 4824810
- Math proficiency
- 52% ▲ 1.00%
- Reading proficiency
- 46% ▼ -5.00%
- Median HH income
- $43,025
- Composite
- 41.32/100
- National rank
- #3508
- State rank
- #202 of 826 in TX
Livability — Joaquin
- Score
- 58/100
- State rank
- #1199
- US rank
- #21013
Category grades
Schools grade is shown separately in the Schools card above.
Census & demographics
- Population (ZIP)
- 2,976
Population outlook (Shelby County) Hauer SSP2
- Today (2025)
- 25,199 people
- By 2030
- 24,986 · -0.8%
- By 2040
- 24,646 · -2.2%
- By 2050
- 24,144 · -4.2%
- By 2075
- 22,328 · -11.4%
- By 2100
- 18,734 · -25.7%
Race, ethnicity, and origin ACS 2023
- Neighborhood character
- Predominantly White (73%)
- Race & ethnicity
- White 73% Hispanic / Latino 19% Two or more races 8% Black 4%
- Hispanic origin (detail)
- Mexican 18%
- Common ancestry
- Lithuanian 5% Slovak 3%
- Foreign-born
- 2% · Canada
- Languages at home
- 95% English-only · Spanish 4% Other Indo-European 1%
Political lean MEDSL · Shelby
- 2024 margin
- Solid R (+64.6) · D 17.5% · R 82.1%
- 2008→2024 swing
- -20.3pp toward R · 2008: -44.3pp · 2024: -64.6pp
- All cycles
- 2024: R+64.6 2020: R+58.6 2016: R+59.7 2012: R+49.1 2008: R+44.3
Not yet ingested
- Civics
- —
Market trends
- HPI YoY
- ▼ -3.17%
- Current HPI
- 129.1639
- Rent YoY
- —
- Metro
- —
- State GDP YoY
- ▲ 3.95%
- F500 in state
- 110
Industry mix (Fortune 500 HQ in TX)
| Industry | F500 HQs | Revenue |
|---|---|---|
| Energy | 16 | $1,198B |
|
||
| Technology | 5 | $198B |
|
||
| Engineering / Construction | 4 | $72B |
|
||
| Energy Services | 3 | $60B |
|
||
| Utilities | 3 | $41B |
|
||
| Healthcare | 2 | $330B |
|
||
Price history
-24.3% since first listed5 events — show timeline
- 2026-04-21 Pending — Deep East Texas MLS
- 2026-03-23 Price Changed $79,500 Deep East Texas MLS
- 2026-03-04 Price Changed $95,000 Deep East Texas MLS
- 2026-01-23 Price Changed $99,500 Deep East Texas MLS
- 2025-12-15 Listed $105,000 Deep East Texas MLS
Cash-flow waterfall
monthlySold comps — $/sqft
last 12 mo · ≤1 miLoading sold comps…