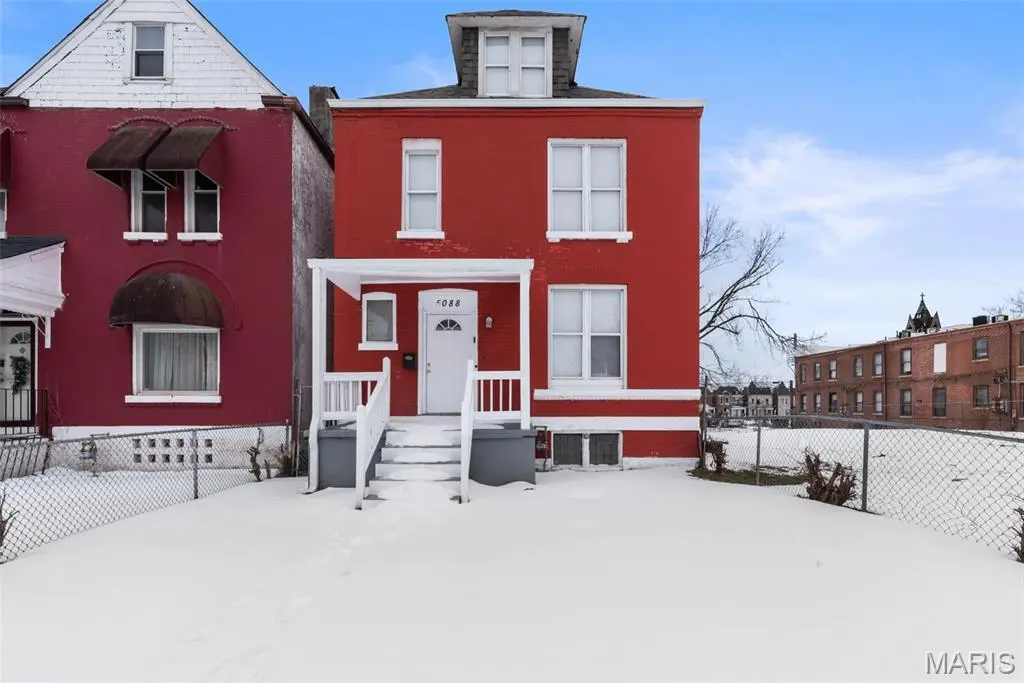
5088 Minerva Ave · St. Louis, MO
Flood risk 1/10 · Minimal
- FEMA flood zone
- X (unshaded)
- Chance of flooding over 30 yrs
- 0.0%
- Est. flood insurance / yr
- $473 – $860
Fire risk 1/10 · Minimal
- Est. fire insurance / yr
- $1,054 – $1,958
Heat risk 5/10 · Moderate
- Hot days now (above 107°F)
- 7 days/yr
- Hot days in 30 yrs
- 20 days/yr
Wind risk 2/10 · Minimal
- Chance of severe wind over 30 yrs
- 1.0%
Air-quality risk 4/10 · Minor
- Unhealthy air days now
- 4 days/yr
- Unhealthy air days in 30 yrs
- 5 days/yr
Risk factors via First Street. Map © Google.
Why this score? — see what drove the B grade
The composite is a weighted blend of 9 inputs, each scored 0–100. Each bar is that input's sub-score; the figure is the points it added to the 100-point composite (weight × sub-score).
- Cash flow +30.0/30.0
- 1% rule +10.0/10.0
- DSCR +10.0/10.0
- ARV discount +7.5/15.0
- Appreciation +3.9/10.0
- Rent growth +2.5/5.0
- Livability +2.5/5.0
- Condition / age +2.5/5.0
- Schools +1.2/10.0
$130,000
🖨 Deal sheet 📄 Offer letter ✓ Due diligence
Listing remarks MLS
Welcome to this beautiful move-in ready 5 bedroom and 2 bath near the vibrant Delmar Makers District in the Central West End and all that Forest Park has to offer. Property has hardwood floors throughout, recessed lighting, and updated kitchen and baths! Enjoy the outdoors with the spacious backyard space,-ideal for pets or play. Don't miss out on this wonderful home! Schedule your showing today!
Key facts
- Spacious backyard
- Recessed lighting
- Updated kitchen
Tags
Neighborhood map
What this means for you Summary
Snapshot
- This is a 5-bed/1.0-bath single-family listed at $130k.
Deal economics
- At list price, monthly cash flow is $1k ($15k/yr) — positive.
- The deal already cash-flows at list — no discount required.
- Meets the 1% rule at list price ($3k rent vs $130k).
- Recommended offer: $114k (12.0% below list) — sets the bar for market timing.
- Cap rate 17.7% vs local median 5.0% in St. Louis — top-decile yield for the area; either an underpriced asset or a hidden risk that comps aren't pricing in. Stress-test before assuming the spread holds.
Location & tenants
- Location reads: area grade B — affects rentability + tenant quality, not the cash-flow math above.
- St. Louis City (urban): math 10% / reading 18% proficiency, ranked #312 of 324 in MO (top 96%) — low school quality limits family demand, transient renter base, plan for 1-2y turnover; 80% free/reduced lunch — lower-income household profile, screen leases tightly.
- Market conditions: 58 active listings in the ZIP; 1 comparable units currently listed for rent nearby; 294 units permitted in St. Louis city in 2024 (227 in 5+ unit buildings).
Forward outlook
- Local home prices are declining (-2.1%/yr); year-one equity from $899 of loan paydown is wiped out by about $3k of value loss. Plan a longer hold.
- St. Louis County population projected to shrink 6% by 2050 — rents likely to lag national; underwrite the cash flow, not the appreciation.
- At projected returns (-2.1% appreciation + 3.0% rent growth), your $36k cash investment doubles in ~3 years — after that, you're playing with house money.
Negotiation context
- It's been on market 127 days — a 12% lower offer ($114k) is reasonable based on typical stale-listing flexibility.
- 6 sale attempts since 12y ago; this cycle's ask has dropped $20k (13%) from the opening price — seller is motivated, your offer sets the floor, not the list.
- Current owner paid $60k; list at $130k implies a 117% gain — meaningful room to come down on a strong offer.
Risks & watch-outs
- Watch-outs: built in 1892 — expect roof / HVAC / electrical / plumbing capex.
- Climate carrying-cost: extreme-heat days projected 7→20/yr by 2055 (HVAC capex compounding) — expect insurance premiums to compound above CPI over the hold.
Questions for the listing agent
- It's been on market 127 days. Have you received any prior offers? Is the seller open to a 12% concession, seller financing, or rate buy-down credit?
- Built in 1892 — when were the roof, HVAC, electrical panel, plumbing, and water heater last replaced?
- Why hasn't it sold? Are there any deal-killer items the seller is aware of (foundation, flood, title, zoning, code violations)?
- Is there a deadline driving the sale (1031 exchange, divorce, estate, relocation)? That informs how much negotiation room exists.
- What's the average days-on-market for RENTAL listings here right now (not sales)? A rising rental-DOM trend means longer vacancies and softer asking-rent achievability than the comps imply.
- What's the recent tenant-quality profile in this submarket — average credit score on applications, eviction rate, late-payment / NSF rate, and stable-employment percentage? A property-management company in the area should have these aggregated.
- How much new for-sale + rental construction is in the pipeline within 1–3 miles? Heavy new supply typically softens prices + rents 12–24 months out; constrained supply supports both.
Investment metrics
- 1% rule
- 1.95% ✓
- Cap rate
- 17.70%
- Cash-on-cash
- 40.75%
- DSCR
- 2.81
- GRM
- 4.3
CMA / ARV
- ARV (median comp)
- $51,664
- List price
- $130,000
- Delta
- 151.62%
- Verdict
- OVERPRICED
- Comps
- 20 within 1.0 mi
Show comp detail 6 sales within ~0.75 mi
| Address | Dist | Beds/Ba | Sqft | Sold | Price | $/sf | Match |
|---|---|---|---|---|---|---|---|
| 5434 Maple Ave | 0.59mi | 4/— (-1) | 1,578 (-1%) | 14mo | $90,000 | $57 | 54 |
| 5041 Lotus Ave | 0.50mi | 4/1.5 (-1) | 1,500 (-6%) | 10mo | $30,000 | $20 | 51 |
| 1366 Burd Ave | 0.68mi | 4/1.5 (-1) | 1,620 (+1%) | 15mo | $40,000 | $25 | 46 |
| 5069 Lotus Ave | 0.50mi | 4/1.5 (-1) | 1,734 (+8%) | 12mo | $34,700 | $20 | 46 |
| 5254 Maple Ave | 0.34mi | 4/2.5 (-1) | 1,750 (+10%) | 18mo | $65,000 | $37 | 42 |
| 4739 Cote Brilliante Ave | 0.63mi | 4/2.5 (-1) | 1,600 (+0%) | 21mo | $90,000 | $56 | 42 |
Match score weights: distance 35% · size 25% · config 20% · recency 20%. Top-matched comps best support the ARV.
Projected returns pro-forma
-2.14% appreciation · 3.0% rent growth · sell at horizon
- IRR
- 38.5%
- Equity multiple
- 2.71×
- Total profit
- $62,333
- Equity at exit
- $24,394
- IRR
- 44.1%
- Equity multiple
- 5.39×
- Total profit
- $159,654
- Equity at exit
- $20,039
Cash invested: $36,400 (down + closing). Projections, not guarantees.
Landlord ↔ Tenant lean methodology
- Overall (STATE)
- 81 Strongly Landlord-Friendly
- State Missouri
- 81 Strongly Landlord-Friendly · R+10
- County
- — inherits STATE
- City
- — inherits STATE
ZIP-level market 63113
- Home prices YoY
- -2.0%
- Active inventory
- 58
- Price-to-rent
- 4.3×
Monthly cashflow live
- Estimated rent
- $2,535 medium interval (Pro) →
- Mortgage (P&I)
- −$682
- Tax from tax record
- −$31 /mo · $367/yr
- Insurance
- −$54
- HOA
- −$0
- Vacancy / Maint / Mgmt
- −$532
- Net cashflow
- $1,236
Break-even live
UW: 25.0% down · 7.5% · 30yr · 1.5% tax · 5.0% vac · 8.0% maint · 8.0% mgmt
Financing live
Cash to close
- Down payment
- $32,500
- Closing costs
- $3,900
- Reserves months
- —
- Total cash needed
- —
Loan-product check · same deal, 3 products live
Conventional
25% down · 7.5% · 30yr
- Down + closing
- —
- Monthly P&I
- —
- Monthly cashflow
- —
- DSCR
- —
- Eligible?
- —
Personal DTI + credit; lowest rate.
DSCR
20% down · 8.5% · 30yr
- Down + closing
- —
- Monthly P&I
- —
- Monthly cashflow
- —
- DSCR
- —
- Eligible?
- —
No personal income docs; deal must DSCR.
Hard money
10% down · 12.0% · 12mo
- Down + closing
- —
- Monthly P&I
- —
- Monthly cashflow
- —
- DSCR
- —
- Eligible?
- —
Short-term bridge; refi at stabilization.
Rent comps 1 comps
| Address | Beds | Baths | Sqft | Rent | $/sqft | DOM | Units | Dist |
|---|---|---|---|---|---|---|---|---|
| 18 S Kingshighway Blvd Saint Louis, MO | 4.0 | 1.0–2.0 | 730 | $2,535 | $3.47 | 43d | 42 | 1.43mi |
Listing history 36 events
-
2026-06-18price $130,000 Active 127 DOM
-
2026-06-18days on market $140,000 Active 127 DOM
-
2026-06-17days on market $140,000 Active 126 DOM
-
2026-06-16days on market $140,000 Active 125 DOM
-
2026-06-15days on market $140,000 Active 124 DOM
-
2026-06-13days on market $140,000 Active 122 DOM
-
2026-06-09days on market $140,000 Active 118 DOM
-
2026-06-08days on market $140,000 Active 117 DOM
-
2026-06-08days on market $140,000 Active 116 DOM
-
2026-06-05days on market $140,000 Active 113 DOM
-
2026-06-03days on market $140,000 Active 112 DOM
-
2026-06-02days on market $140,000 Active 111 DOM
-
2026-06-01days on market $140,000 Active 110 DOM
-
2026-05-31days on market $140,000 Active 109 DOM
-
2026-03-24price $140,000 399-char remark
Show marketing remark (399 chars)
Welcome to this beautiful move-in ready 5 bedroom and 2 bath near the vibrant Delmar Makers District in the Central West End and all that Forest Park has to offer. Property has hardwood floors throughout, recessed lighting, and updated kitchen and baths! Enjoy the outdoors with the spacious backyard space,-ideal for pets or play. Don't miss out on this wonderful home! Schedule your showing today!
-
2026-02-11$150,000 Active 399-char remark
Show marketing remark (399 chars)
Welcome to this beautiful move-in ready 5 bedroom and 2 bath near the vibrant Delmar Makers District in the Central West End and all that Forest Park has to offer. Property has hardwood floors throughout, recessed lighting, and updated kitchen and baths! Enjoy the outdoors with the spacious backyard space,-ideal for pets or play. Don't miss out on this wonderful home! Schedule your showing today!
-
2024-08-12historical
-
2024-08-09status Pending
-
2024-08-02status Active
-
2024-07-15status Pending
-
2024-06-06$105,000 Active
-
2022-08-05soldstatus $60,000
-
2022-07-29soldstatus Closed
-
2022-07-13status Pending
-
2022-07-13$65,000 Active
-
2018-08-13price $69,000
-
2018-07-16price $74,900
-
2015-09-11historical
-
2014-08-31historical
-
2014-06-26$125,000 Active
-
2014-06-26$125,000 Active
-
2012-08-07soldstatus
-
2005-03-21soldstatus $64,000
-
2001-11-07soldstatus
-
1999-07-28soldstatus $1,500
-
1993-03-31soldstatus
ⓘ Source: listings_history table (triggers on properties + properties_extension) + one-shot
backfill from property_details.listing_events for pre-trigger history.
Tax reassessment forecast MO · Resets to sale price
- Current annual tax
- $367 · $31/mo
- Projected year-2 tax
- $1,261 · $105/mo
- Expected delta
- +$894/yr (+$74/mo · 243.6%)
ⓘ Screening estimate from a state-policy table — verify with the county assessor before closing.
Climate risk First Street
- Flood 1/10 Low FEMA zone X (unshaded) · 0% chance over 30 yrs
- Wildfire 1/10 Low
- Heat 5/10 Major 7 d/yr ≥107°F today · 20 d/yr by 30 yrs out
- Wind 2/10 Low 100% chance of damaging wind over 30 yrs
- Air quality 4/10 Moderate 4 unhealthy d/yr today · 5 by 30 yrs out
Nearby sold comps map
Loading sold comps map…
Walkable amenities ~0.75 mi
Loading nearby amenities…
Taxation est. · year 1
- Rental income
- $30,420
- − Mortgage interest
- −$7,282
- − Property taxes
- −$367
- − Insurance
- −$650
- − Repairs & maintenance
- −$2,434
- − Management
- −$2,434
- − Depreciation
- −$3,782
- Taxable income
- $13,472
- Est. tax owed @ 24.0%
- −$3,233
- After-tax cash flow
- $11,601/yr
For passive investors: Depreciation is non-cash, so a rental often shows a tax loss while cash-flowing — sheltering income. Rental losses are passive: they offset passive income freely, and up to $25,000/yr can offset ordinary (W-2) income if you actively participate and your MAGI is under $100k (phasing out to $0 by $150k); unused losses carry forward. On sale, claimed depreciation is recaptured at up to 25%, and gains may owe capital-gains tax (a 1031 exchange can defer both). Figures are a year-1 estimate at your 24.0% rate — not tax advice; consult a CPA.
Schools (NCES district)
- District
- St. Louis City
- NCES district ID
- 2929280
- Math proficiency
- 10% ▼ -6.00%
- Reading proficiency
- 18% ▼ -3.00%
- Median HH income
- $35,685
- Composite
- 11.54/100
- National rank
- #9699
- State rank
- #312 of 324 in MO
Livability — St. Louis
No livability data for this city. (Only ~50 U.S. cities are tracked.)
Census & demographics
- Census place
- St. Louis, MO
- City population
- 283,259
- Population (ZIP)
- 11,610
Population outlook (St. Louis County) Hauer SSP2
- Today (2025)
- 315,737 people
- By 2030
- 313,865 · -0.6%
- By 2040
- 305,439 · -3.3%
- By 2050
- 296,529 · -6.1%
- By 2075
- 271,028 · -14.2%
- By 2100
- 255,359 · -19.1%
Race, ethnicity, and origin ACS 2023
- Neighborhood character
- Predominantly Black (91%)
- Race & ethnicity
- Black 91% White 6% Two or more races 2% Hispanic / Latino 1%
- Foreign-born
- 2% · Canada
Political lean MEDSL · St. Louis
- 2024 margin
- Solid D (+64.7) · D 81.4% · R 16.7% · Other 2.0%
- 2008→2024 swing
- -3.5pp toward R · 2008: 68.2pp · 2024: 64.7pp
- All cycles
- 2024: D+64.7 2020: D+66.2 2016: D+63.7 2012: D+66.6 2008: D+68.2
Not yet ingested
- Civics
- —
Market trends
- HPI YoY
- ▼ -2.14%
- Current HPI
- 107.1335
- Rent YoY
- —
- Metro
- —
- State GDP YoY
- ▲ 1.84%
- F500 in state
- 20
Industry mix (Fortune 500 HQ in MO)
| Industry | F500 HQs | Revenue |
|---|---|---|
| Healthcare | 1 | $163B |
|
||
| Insurance | 1 | $21B |
|
||
| Industrial Technology | 1 | $17B |
|
||
| Retail | 1 | $16B |
|
||
| Industrial Distribution | 1 | $10B |
|
||
| Utilities | 1 | $9B |
|
||
Price history
+9233.3% since first listed22 events — show timeline
- 2026-03-24 Price Changed $140,000 MARIS as Distributed by MLS Grid
- 2026-02-11 Listed $150,000 MARIS as Distributed by MLS Grid
- 2024-08-12 Delisted — MARIS as Distributed by MLS Grid
- 2024-08-09 Pending — MARIS as Distributed by MLS Grid
- 2024-08-02 Relisted — MARIS as Distributed by MLS Grid
- 2024-07-15 Pending — MARIS as Distributed by MLS Grid
- 2024-06-06 Listed $105,000 MARIS as Distributed by MLS Grid
- 2022-08-05 Sold (Public Records) $60,000 Public Records
- 2022-07-29 Sold (MLS) — MARIS as Distributed by MLS Grid
- 2022-07-13 Pending — MARIS as Distributed by MLS Grid
- 2022-07-13 Listed $65,000 MARIS as Distributed by MLS Grid
- 2018-08-13 Price Changed $69,000 MARIS as Distributed by MLS Grid
- 2018-07-16 Price Changed $74,900 MARIS as Distributed by MLS Grid
- 2015-09-11 Listing Removed — CRMLS
- 2014-08-31 Listing Removed — CRMLS
- 2014-06-26 Listed $125,000 CRMLS
- 2014-06-26 Listed $125,000 CRMLS
- 2012-08-07 Sold (Public Records) — Public Records
- 2005-03-21 Sold (Public Records) $64,000 Public Records
- 2001-11-07 Sold (Public Records) — Public Records
- 1999-07-28 Sold (Public Records) $1,500 Public Records
- 1993-03-31 Sold (Public Records) — Public Records
Property tax history
+2.6%/yrLatest (2024): $367 · +4.8% YoY. Source: county tax records.
Cash-flow waterfall
monthlySold comps — $/sqft
last 12 mo · ≤1 miLoading sold comps…