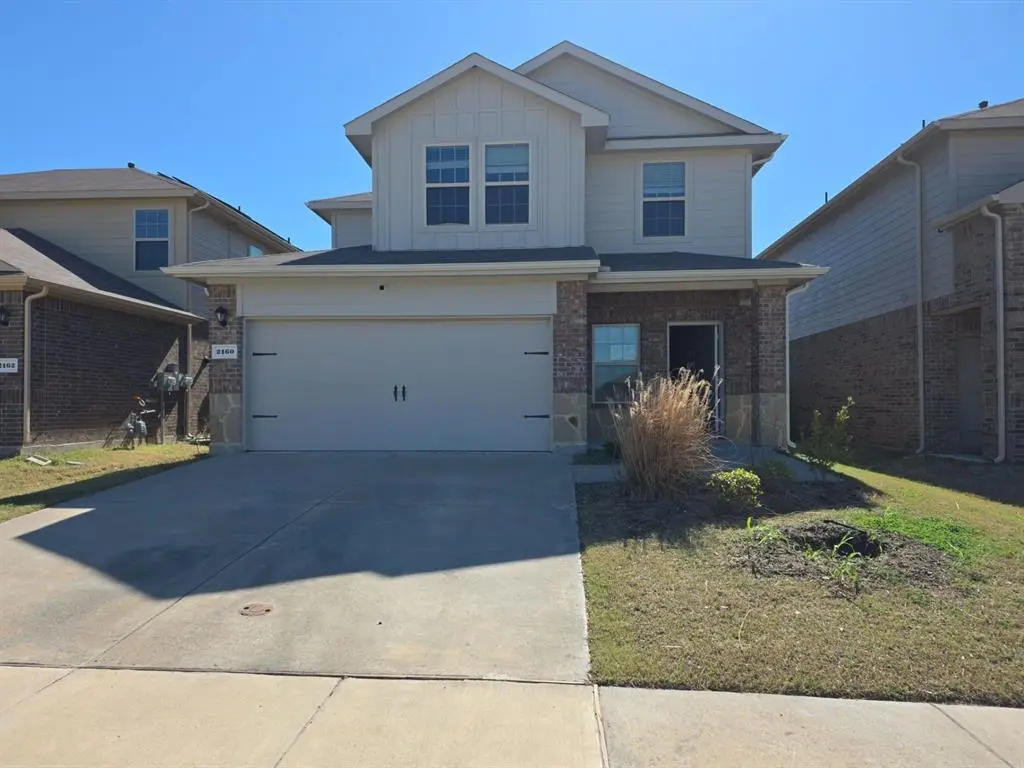
2160 Ocelot St · Crandall, TX
Flood risk No data
- FEMA flood zone
- —
- Chance of flooding over 30 yrs
- —
- Est. flood insurance / yr
- —
Fire risk No data
- Est. fire insurance / yr
- —
Heat risk No data
- Hot days now (above threshold)
- —
- Hot days in 30 yrs
- —
Wind risk No data
- Chance of severe wind over 30 yrs
- —
Air-quality risk No data
- Unhealthy air days now
- —
- Unhealthy air days in 30 yrs
- —
Risk factors via First Street. Map © Google.
Why this score? — see what drove the D grade
The composite is a weighted blend of 9 inputs, each scored 0–100. Each bar is that input's sub-score; the figure is the points it added to the 100-point composite (weight × sub-score).
- ARV discount +15.0/15.0
- Cash flow +8.1/30.0
- 1% rule +5.8/10.0
- Schools +3.6/10.0
- Livability +3.4/5.0
- Condition / age +2.8/5.0
- Rent growth +2.5/5.0
- DSCR +2.2/10.0
- Appreciation +0.0/10.0
$216,750
🖨 Deal sheet (PDF) 📄 Offer letter ✓ Due diligence
Listing remarks MLS
Welcome home to this spacious 4-bedroom, 2.5-bath gem in the highly sought-after Wildcat subdivision. Designed for modern living, the primary suite is conveniently located on the first floor for maximum privacy. Step outside to a generous backyard—the perfect canvas for summer BBQs and entertaining family and friends. Location is everything, and you'll be just minutes away from I-20 and Hwy 175, making any commute a breeze. HUD Case number 511-323135r all properties are SOLD AS-IS without any guarantee or warranty by the seller. In with Repair Escrow Disclosures are in transaction desk and on HUD home store. Please review documentation prior to submitting offers IE Insured Escrow -
Key facts
- 6,534 sq ft lot
- 2 garage spots
- Built 2022
Neighborhood map
What this means for you Summary
Snapshot
- This is a 4-bed/2.5-bath single-family listed at $217k. Condition is rated average.
Deal economics
- At list price, monthly cash flow is $-207 ($-2k/yr) — negative.
- To cash-flow at today's rent, offer at most $188k (13.4% below list).
- Meets the 1% rule at list price ($2k rent vs $217k).
- Recommended offer: $188k (13.4% below list) — sets the bar for cash-flow.
Location & tenants
- Location reads 68/100 on livability (#507 in TX) — a middle-class / working-renter tenant base. Strengths: employment A+, cost of living A+, housing A+; Watch: crime F, amenities F, commute F.
- Crandall ISD (rural): math 36% / reading 42% proficiency, ranked #351 of 826 in TX (top 42%) — families likely to look elsewhere, expect single-tenant / working-renter base with shorter leases.
- Zoned schools: Nola Kathryn Wilson El (math 40% / reading 45%, grade F, #1,313 of 4,322 statewide, top 31%, 596 students, 59% FRL); Crandall Middle (math 38% / reading 42%, grade F, #646 of 1,662 statewide, top 40%, 983 students, 60% FRL); Crandall H S (math 33% / reading 53%, grade F, #713 of 1,632 statewide, top 44%, 1,707 students, 56% FRL) — zoned schools average 58% FRL vs 41% district-wide (17 pts higher); higher-poverty schools than district average — tighter screening recommended.
- Market conditions: 802 active listings in the ZIP; 17 comparable units currently listed for rent nearby; rentals at typical pace (median 27d on market — plan ~3-4 weeks tenant-placement turnaround); solid renter incomes; 1,747 units permitted in Kaufman County in 2024 (180 in 5+ unit buildings).
- This rent runs 32% of the median local income ($88k/yr) — at the standard rent-burdened threshold; future hikes will face affordability resistance.
Forward outlook
- Local home prices are declining (-3.0%/yr); year-one equity from $1k of loan paydown is wiped out by about $7k of value loss. Plan a longer hold.
- Kaufman County population projected at +43% by 2050 — long-run rental-demand tailwind backs the buy-and-hold thesis.
Negotiation context
- It's been on market 85 days — a 6% lower offer ($204k) is reasonable based on typical stale-listing flexibility.
- 3 sale attempts; this cycle's ask has dropped $38k (15%) from the opening price — seller is motivated, your offer sets the floor, not the list.
Risks & watch-outs
- Watch-outs: property tax is 4.3% of price.
Questions for the listing agent
- What do current leases actually rent for vs. the listed asking? Can we see a recent rent roll and the last 12 months of T-12 income?
- It's been on market 85 days. Have you received any prior offers? Is the seller open to a 13% concession, seller financing, or rate buy-down credit?
- Property tax is high relative to price — has the assessment been appealed recently, and will the sale trigger a re-assessment?
- What does the HOA fee cover, when was the last increase, and are there any pending special assessments or reserve-fund shortfalls?
- Why hasn't it sold? Are there any deal-killer items the seller is aware of (foundation, flood, title, zoning, code violations)?
- Is there a deadline driving the sale (1031 exchange, divorce, estate, relocation)? That informs how much negotiation room exists.
- Schools are B-rated — typically a magnet for longer-tenancy family renters. What's the average tenant stay here, and is there a school-zone premium baked into asking?
- Crime grade is F in this area — have there been break-ins, vandalism, or insurance claims at this property in the last 3 years? What carrier currently insures it and at what premium?
- The area grade is low — what's the realistic commute time and amenity access for the typical tenant pool here? Any planned neighborhood developments (good or bad) we should know about?
- What's the average days-on-market for RENTAL listings here right now (not sales)? A rising rental-DOM trend means longer vacancies and softer asking-rent achievability than the comps imply.
- What's the recent tenant-quality profile in this submarket — average credit score on applications, eviction rate, late-payment / NSF rate, and stable-employment percentage? A property-management company in the area should have these aggregated.
- How much new for-sale + rental construction is in the pipeline within 1–3 miles? Heavy new supply typically softens prices + rents 12–24 months out; constrained supply supports both.
Investment metrics
- 1% rule
- 1.08% ✓
- Cap rate
- 5.15%
- Cash-on-cash
- -4.10%
- DSCR
- 0.82
- GRM
- 7.7
CMA / ARV
- ARV (median comp)
- $317,665
- List price
- $216,750
- Delta
- -31.77%
- Verdict
- UNDERPRICED
- Comps
- 20 within 1.0 mi
Show comp detail 12 sales within ~0.75 mi
| Address | Dist | Beds/Ba | Sqft | Sold | Price | $/sf | Match |
|---|---|---|---|---|---|---|---|
| 4310 Rowling Way | 0.24mi | 4/2.5 | 2,304 (-3%) | 2mo | $305,000 | $132 | 83 |
| 3533 Mildren Bnd | 0.16mi | 4/2.5 | 2,186 (-8%) | 1mo | $283,000 | $129 | 79 |
| 4125 Silverstein St | 0.14mi | 4/2.5 | 2,596 (+10%) | 6mo | $344,990 | $133 | 72 |
| 3539 Mildren Bnd | 0.18mi | 4/3.0 | 2,604 (+10%) | 5mo | $255,000 | $98 | 68 |
| 6026 Midsummer Way | 0.50mi | 4/2.5 | 2,241 (-5%) | 1mo | $335,240 | $150 | 67 |
| 4005 Georges Bnd | 0.08mi | 4/2.0 | 2,052 (-13%) | 11mo | $318,990 | $155 | 63 |
| 4267 Pope Br | 0.42mi | 4/3.0 | 2,473 (+5%) | 10mo | $338,490 | $137 | 63 |
| 6315 Streamside Dr | 0.56mi | 4/2.5 | 2,182 (-8%) | 2mo | $322,240 | $148 | 60 |
| 4265 Pope Br | 0.42mi | 4/2.5 | 2,182 (-8%) | 11mo | $315,490 | $145 | 59 |
| 4272 Pope Br | 0.45mi | 4/3.0 | 2,514 (+6%) | 10mo | $334,490 | $133 | 58 |
| 4930 Pelican Way | 0.57mi | 4/2.5 | 2,182 (-8%) | 10mo | $289,000 | $132 | 53 |
| 4268 Pope Br | 0.44mi | 4/2.5 | 2,042 (-14%) | 11mo | $299,490 | $147 | 48 |
Match score weights: distance 35% · size 25% · config 20% · recency 20%. Top-matched comps best support the ARV.
Projected returns pro-forma
-3.0% appreciation · 3.0% rent growth · sell at horizon
- IRR
- -23.0%
- Equity multiple
- 0.21×
- Total profit
- $-47,942
- Equity at exit
- $32,318
- IRR
- -16.9%
- Equity multiple
- 0.06×
- Total profit
- $-57,199
- Equity at exit
- $18,741
Cash invested: $60,690 (down + closing). Projections, not guarantees.
Landlord ↔ Tenant lean methodology
- Overall (STATE)
- 87 Strongly Landlord-Friendly
- State Texas
- 87 Strongly Landlord-Friendly · R+5
- County
- — inherits STATE
- City
- — inherits STATE
ZIP-level market 75114
- Home prices YoY
- -26.7%
- Active inventory
- 802
- Price-to-rent
- 7.7×
Monthly cashflow live
- Estimated rent
- $2,344 high interval (Pro) →
- Mortgage (P&I)
- −$1,137
- Tax from tax record
- −$782 /mo · $9,383/yr
- Insurance
- −$90
- HOA
- −$50
- Vacancy / Maint / Mgmt
- −$492
- Net cashflow
- $-207
Break-even live
Sensitivity live
| Price | -10% $-85 | -5% $-146 | +0% $-207 | +5% $-269 | +10% $-330 |
|---|---|---|---|---|---|
| Rent | -10% $-392 | -5% $-300 | +0% $-207 | +5% $-115 | +10% $-22 |
| Rate | -1.0pp $-98 | -0.5pp $-152 | base $-207 | +0.5pp $-263 | +1.0pp $-321 |
UW: 25.0% down · 7.5% · 30yr · 1.5% tax · 5.0% vac · 8.0% maint · 8.0% mgmt
Financing live
Cash to close
- Down payment
- $54,188
- Closing costs
- $6,502
- Reserves months
- —
- Total cash needed
- —
Loan-product check · same deal, 3 products live
Conventional
25% down · 7.5% · 30yr
- Down + closing
- —
- Monthly P&I
- —
- Monthly cashflow
- —
- DSCR
- —
- Eligible?
- —
Personal DTI + credit; lowest rate.
DSCR
20% down · 8.5% · 30yr
- Down + closing
- —
- Monthly P&I
- —
- Monthly cashflow
- —
- DSCR
- —
- Eligible?
- —
No personal income docs; deal must DSCR.
Hard money
10% down · 12.0% · 12mo
- Down + closing
- —
- Monthly P&I
- —
- Monthly cashflow
- —
- DSCR
- —
- Eligible?
- —
Short-term bridge; refi at stabilization.
Rent comps 17 comps
| Address | Beds | Baths | Sqft | Rent | $/sqft | DOM | Units | Dist |
|---|---|---|---|---|---|---|---|---|
| 3716 Pincoffs Cv Crandall, TX | 4.0 | 2.5 | 2374 | $2,619 | $1.10 | 26d | 1 | 0.15mi |
| 2296 Great Belt Blvd Crandall, TX | 3.0 | 2.0 | 2315 | $1,720 | $0.74 | 8d | 1 | 0.77mi |
| 2109 Muscovy St Crandall, TX | 4.0 | 3.0 | 2300 | $2,200 | $0.96 | 26d | 1 | 0.79mi |
| 1609 Duke Dr Crandall, TX | 2.0–4.0 | 2.0–2.5 | 1614 | $2,490 | $1.54 | 0d | 1 | 0.94mi |
| 1507 Trick Riding Way Crandall, TX | 4.0 | 2.0 | 1850 | $1,900 | $1.03 | 26d | 1 | 1.01mi |
| 1507 Trick Riding Way Crandall, TX | 4.0 | 2.0 | 1850 | $1,900 | $1.03 | 0d | 1 | 1.01mi |
| 1793 Courage Crk Crandall, TX | 4.0 | 2.0 | 1667 | $1,769 | $1.06 | 0d | 1 | 1.16mi |
| 1789 Courage Crk Crandall, TX | 4.0 | 2.0 | 1667 | $1,739 | $1.04 | 4d | 1 | 1.17mi |
| 2624 Bartlett St Crandall, TX | 4.0 | 2.0 | 1707 | $1,825 | $1.07 | 26d | 1 | 1.28mi |
| 2510 Flight Trl Crandall, TX | 4.0 | 2.0 | 1667 | $1,845 | $1.11 | 26d | 1 | 1.29mi |
| 2513 Flight Trl Crandall, TX | 4.0 | 2.0 | 1707 | $1,825 | $1.07 | 26d | 1 | 1.30mi |
| 2521 Flight Trl Crandall, TX | 4.0 | 2.0 | 1707 | $1,825 | $1.07 | 26d | 1 | 1.33mi |
| 2739 Bronte Blvd Crandall, TX | 4.0 | 2.0 | 1707 | $1,825 | $1.07 | 26d | 1 | 1.33mi |
| 2409 Fleming Dr Crandall, TX | 4.0 | 2.0 | 1667 | $1,845 | $1.11 | 26d | 1 | 1.35mi |
| 2746 Bronte Blvd Crandall, TX | 4.0 | 2.0 | 1707 | $1,825 | $1.07 | 26d | 1 | 1.36mi |
| 2745 Bronte Blvd Crandall, TX | 4.0 | 2.0 | 1667 | $1,845 | $1.11 | 26d | 1 | 1.36mi |
| 2237 Mustang Ghost Trl Crandall, TX | 3.0 | 2.0 | 1952 | $2,040 | $1.05 | 45d | 1 | 1.38mi |
HOA detail
- Monthly dues
- $50 · $600/yr
Listing history 13 events
-
2026-06-09status $216,750 Pending 85 DOM
-
2026-06-08days on market $216,750 Active Option Contract 85 DOM
-
2026-06-07days on market $216,750 Active Option Contract 84 DOM
-
2026-06-04statusdays on market $216,750 Active Option Contract 81 DOM
-
2026-06-03days on market $216,750 Active 80 DOM
-
2026-06-02days on market $216,750 Active 79 DOM
-
2026-06-01days on market $216,750 Active 78 DOM
-
2026-05-31days on market $216,750 Active 77 DOM
-
2026-05-19status Active 701-char remark
Show marketing remark (701 chars)
Welcome home to this spacious 4-bedroom, 2.5-bath gem in the highly sought-after Wildcat subdivision. Designed for modern living, the primary suite is conveniently located on the first floor for maximum privacy. Step outside to a generous backyard—the perfect canvas for summer BBQs and entertaining family and friends. Location is everything, and you'll be just minutes away from I-20 and Hwy 175, making any commute a breeze. HUD Case number 511-323135r all properties are SOLD AS-IS without any guarantee or warranty by the seller. In with Repair Escrow Disclosures are in transaction desk and on HUD home store. Please review documentation prior to submitting offers IE Insured Escrow -
-
2026-05-05historical Active Option Contract 701-char remark
Show marketing remark (701 chars)
Welcome home to this spacious 4-bedroom, 2.5-bath gem in the highly sought-after Wildcat subdivision. Designed for modern living, the primary suite is conveniently located on the first floor for maximum privacy. Step outside to a generous backyard—the perfect canvas for summer BBQs and entertaining family and friends. Location is everything, and you'll be just minutes away from I-20 and Hwy 175, making any commute a breeze. HUD Case number 511-323135r all properties are SOLD AS-IS without any guarantee or warranty by the seller. In with Repair Escrow Disclosures are in transaction desk and on HUD home store. Please review documentation prior to submitting offers IE Insured Escrow -
-
2026-03-13$255,000 Active 701-char remark
Show marketing remark (701 chars)
Welcome home to this spacious 4-bedroom, 2.5-bath gem in the highly sought-after Wildcat subdivision. Designed for modern living, the primary suite is conveniently located on the first floor for maximum privacy. Step outside to a generous backyard—the perfect canvas for summer BBQs and entertaining family and friends. Location is everything, and you'll be just minutes away from I-20 and Hwy 175, making any commute a breeze. HUD Case number 511-323135r all properties are SOLD AS-IS without any guarantee or warranty by the seller. In with Repair Escrow Disclosures are in transaction desk and on HUD home store. Please review documentation prior to submitting offers IE Insured Escrow -
-
2025-05-30status Pending
-
2025-05-28$190,000 Active
ⓘ Source: listings_history table (triggers on properties + properties_extension) + one-shot
backfill from property_details.listing_events for pre-trigger history.
Tax reassessment forecast TX · Resets to sale price
- Current annual tax
- $9,383 · $782/mo
- Projected year-2 tax
- $9,383 · $782/mo
- Expected delta
- $0/yr ($0/mo · 0.0%)
ⓘ Screening estimate from a state-policy table — verify with the county assessor before closing.
Nearby sold comps map
Loading sold comps map…
Walkable amenities ~0.75 mi
Loading nearby amenities…
Taxation est. · year 1
- Rental income
- $28,126
- − Mortgage interest
- −$12,141
- − Property taxes
- −$9,383
- − Insurance
- −$1,084
- − Repairs & maintenance
- −$2,250
- − Management
- −$2,250
- − HOA
- −$600
- − Depreciation
- −$6,305
- Taxable loss
- −$5,887
- Est. tax savings @ 24.0%
- +$1,413
- After-tax cash flow
- $-1,074/yr
For passive investors: Depreciation is non-cash, so a rental often shows a tax loss while cash-flowing — sheltering income. Rental losses are passive: they offset passive income freely, and up to $25,000/yr can offset ordinary (W-2) income if you actively participate and your MAGI is under $100k (phasing out to $0 by $150k); unused losses carry forward. On sale, claimed depreciation is recaptured at up to 25%, and gains may owe capital-gains tax (a 1031 exchange can defer both). Figures are a year-1 estimate at your 24.0% rate — not tax advice; consult a CPA.
Condition & rehab AI · 6 photos
This home is in average condition with some cosmetic repairs needed, particularly in painting and landscaping. It has a good layout and location, making it a solid investment with potential for value increase through minor updates.
Repairs flagged
- Minor Paint — Some minor scuff marks on interior walls.
- Minor Landscaping — Overgrown areas in the yard need trimming and care.
Value-add opportunities
- Resale Paint interior walls — Fresh paint can significantly improve the home's curb appeal and interior aesthetics.
- Rental Landscaping — A well-maintained yard can attract more renters and add to the home's rental value.
- Both Add a small patio or seating area — This can enhance both the resale and rental value by providing outdoor living space and increasing the home's appeal.
Renovation cost estimate screening
| Repair item | Severity | Est. cost |
|---|---|---|
| Paint · Some minor scuff marks on interior walls. | Minor | $500–3,000 |
| Landscaping · Overgrown areas in the yard need trimming and care. | Minor | $500–3,000 |
| Total estimated repair cost · 2 items | $1,000–6,000 |
Value-add ROI direction
- Resale Paint interior walls — Fresh paint can significantly improve the home's curb appeal and interior aesthetics. ↑
- Rental Landscaping — A well-maintained yard can attract more renters and add to the home's rental value. ↑
- Both Add a small patio or seating area — This can enhance both the resale and rental value by providing outdoor living space and increasing the home's appeal. ↑
ⓘ Cost ranges are severity-bucket heuristics (US national rule-of-thumb). Get contractor quotes + a written scope before underwriting a rehab budget.
Schools (NCES district)
- District
- Crandall ISD
- NCES district ID
- 4815510
- Math proficiency
- 36% ▼ -13.00%
- Reading proficiency
- 42% ▼ -8.00%
- Median HH income
- $70,076
- Composite
- 35.57/100
- National rank
- #4901
- State rank
- #351 of 826 in TX
Livability — Crandall
- Score
- 68/100
- State rank
- #507
- US rank
- #10022
Category grades
Schools grade is shown separately in the Schools card above.
Census & demographics
- County
- Kaufman County · 122,338 people
- Metro
- Dallas-Fort Worth-Arlington, TX
- Population (ZIP)
- 9,333
- Household income
- $88,013
- Rent vs Own
- Severe rent burden
- 33.0
Population outlook (Kaufman County) Hauer SSP2
- Today (2025)
- 138,716 people
- By 2030
- 150,815 · +8.7%
- By 2040
- 174,877 · +26.1%
- By 2050
- 198,020 · +42.8%
- By 2075
- 251,908 · +81.6%
- By 2100
- 285,325 · +105.7%
Race, ethnicity, and origin ACS 2023
- Neighborhood character
- Diverse neighborhood (Simpson 0.62)
- Race & ethnicity
- White 48% Hispanic / Latino 36% Two or more races 14% Black 14%
- Hispanic origin (detail)
- Mexican 34%
- Common ancestry
- Slovak 1%
- Foreign-born
- 18% · Canada, China
- Languages at home
- 71% English-only · Spanish 27% Other Indo-European 1%
Political lean MEDSL · Kaufman
- 2024 margin
- Strong R (+27.9) · D 35.6% · R 63.5%
- 2008→2024 swing
- +7.9pp toward D · 2008: -35.8pp · 2024: -27.9pp
- All cycles
- 2024: R+27.9 2020: R+33.9 2016: R+47.0 2012: R+44.4 2008: R+35.8
Not yet ingested
- Civics
- —
Market trends
- HPI YoY
- ▼ -71.61%
- Current HPI
- 196.4773
- Rent YoY
- —
- Metro
- Dallas-Fort Worth-Arlington, TX
- State GDP YoY
- ▲ 3.95%
- F500 in state
- 110
Industry mix (Fortune 500 HQ in TX)
| Industry | F500 HQs | Revenue |
|---|---|---|
| Energy | 16 | $1,198B |
|
||
| Technology | 5 | $198B |
|
||
| Engineering / Construction | 4 | $72B |
|
||
| Energy Services | 3 | $60B |
|
||
| Utilities | 3 | $41B |
|
||
| Healthcare | 2 | $330B |
|
||
Price history
+34.2% since first listed5 events — show timeline
- 2026-05-19 Relisted — NTREIS
- 2026-05-05 Contingent — NTREIS
- 2026-03-13 Listed $255,000 NTREIS
- 2025-05-30 Pending — NTREIS
- 2025-05-28 Listed $190,000 NTREIS
Property tax history
+96.1%/yrLatest (2025): $9,383 · -4.0% YoY. Source: county tax records.
Cash-flow waterfall
monthlySold comps — $/sqft
last 12 mo · ≤1 miLoading sold comps…