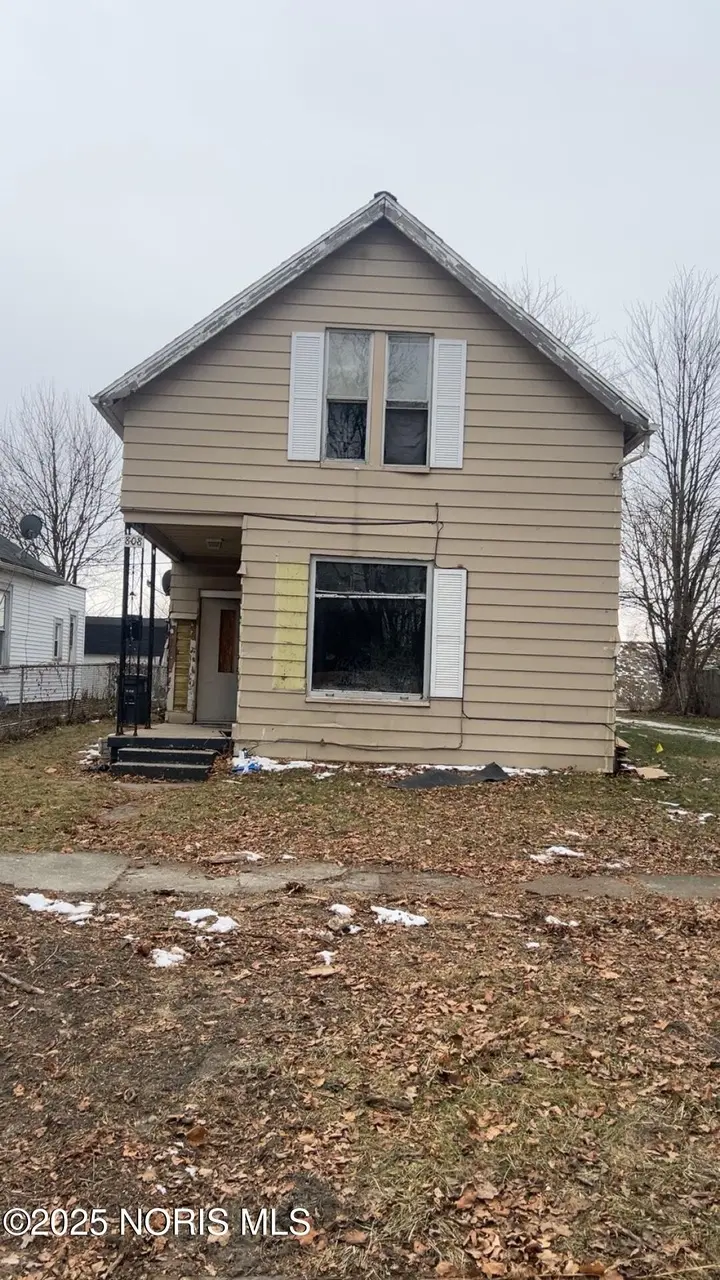
808 Bartley Pl · Toledo, OH
Flood risk 1/10 · Minimal
- FEMA flood zone
- X (unshaded)
- Chance of flooding over 30 yrs
- 0.0%
- Est. flood insurance / yr
- $507 – $1,088
Fire risk 1/10 · Minimal
- Est. fire insurance / yr
- $713 – $1,323
Heat risk 3/10 · Minor
- Hot days now (above 101°F)
- 7 days/yr
- Hot days in 30 yrs
- 16 days/yr
Wind risk 2/10 · Minimal
- Chance of severe wind over 30 yrs
- —
Air-quality risk 2/10 · Minimal
- Unhealthy air days now
- 1 days/yr
- Unhealthy air days in 30 yrs
- 2 days/yr
Risk factors via First Street. Map © Google.
Why this score? — see what drove the D+ grade
The composite is a weighted blend of 9 inputs, each scored 0–100. Each bar is that input's sub-score; the figure is the points it added to the 100-point composite (weight × sub-score).
- Cash flow +15.0/30.0
- ARV discount +7.5/15.0
- Appreciation +5.4/10.0
- 1% rule +5.0/10.0
- DSCR +5.0/10.0
- Rent growth +4.5/5.0
- Livability +3.3/5.0
- Condition / age +2.5/5.0
- Schools +1.6/10.0
$19,900
🖨 Deal sheet (PDF) 📄 Offer letter ✓ Due diligence
Listing remarks MLS
Great opportunity for investors seeking a flip or value-add project with strong upside. This property offers excellent potential to renovate, reposition, and build equity quickly. Buyer will need to complete the City of Toledo vetting process, as the property currently has violations on record. All fines have been paid. Seller will make no repairs and is selling the property as is.
Key facts
- 3,200 sq ft lot
- 2 parking spots
- Built 1887
Neighborhood map
What this means for you Summary
Snapshot
- This is a 3-bed/1.0-bath single-family listed at $20k.
Deal economics
- At list price, monthly cash flow is $619 ($7k/yr) — positive.
- The deal already cash-flows at list — no discount required.
- Meets the 1% rule at list price ($1k rent vs $20k).
- Recommended offer: $18k (12.0% below list) — sets the bar for market timing.
- Cap rate 43.6% vs local median 7.7% in Toledo — top-decile yield for the area; either an underpriced asset or a hidden risk that comps aren't pricing in. Stress-test before assuming the spread holds.
Location & tenants
- Location reads 66/100 on livability (#645 in OH) — a middle-class / working-renter tenant base. Strengths: cost of living A+, housing A+, health & safety A+; Watch: amenities C-, crime F, commute F.
- Toledo City (urban): math 15% / reading 24% proficiency, ranked #634 of 656 in OH (top 97%) — low school quality limits family demand, transient renter base, plan for 1-2y turnover; 72% free/reduced lunch — lower-income household profile, screen leases tightly.
- Zoned schools: Grove Patterson Academy Elementary School (math 47% / reading 66%, grade C+, #761 of 1,584 statewide, top 48%, 403 students, 38% FRL); Toledo Early College High School (math 72% / reading 87%, grade A-, #35 of 781 statewide, top 6%, 334 students, 45% FRL) — zoned schools average 41% FRL vs 72% district-wide (30 pts lower); this property's tenant base skews higher-income than the district average.
- Zoned-school proficiency averages 68% at this address vs 20% district-wide (+48 pts) — the actual schools serving this property are materially stronger than the Toledo City average implies; a family-tenant draw the district grade alone would hide.
- Market conditions: Rents rising fast (+7.8%/yr); 100 active listings in the ZIP; 17 comparable units currently listed for rent nearby; rentals lingering (median 46d on market — plan ~5-8 weeks vacancy on turnover, expect pricing pressure); 53% of comp listings sitting > 30 days — soft ceiling on asking rent; lower-income renter base — watch delinquency; 415 units permitted in Lucas County in 2024 (122 in 5+ unit buildings).
Forward outlook
- In year one you build about $287 of equity ($138 loan paydown + $149 appreciation (0.8% local appreciation)).
- Lucas County population projected at -16% by 2050 — secular population decline; favor cash flow + early exit over multi-decade hold.
- At projected returns (0.8% appreciation + 7.8% rent growth), your $6k cash investment doubles in ~1 year — after that, you're playing with house money.
Negotiation context
- It's been on market 165 days — a 12% lower offer ($18k) is reasonable based on typical stale-listing flexibility.
- 7 sale attempts since 23y ago; this cycle's ask has dropped $12k (37%) from the opening price — seller is motivated, your offer sets the floor, not the list.
- Current owner paid $5k; list at $20k implies a 298% gain — meaningful room to come down on a strong offer.
Risks & watch-outs
- Watch-outs: property tax is 4.9% of price; built in 1887 — expect roof / HVAC / electrical / plumbing capex.
Questions for the listing agent
- It's been on market 165 days. Have you received any prior offers? Is the seller open to a 12% concession, seller financing, or rate buy-down credit?
- Built in 1887 — when were the roof, HVAC, electrical panel, plumbing, and water heater last replaced?
- Property tax is high relative to price — has the assessment been appealed recently, and will the sale trigger a re-assessment?
- Why hasn't it sold? Are there any deal-killer items the seller is aware of (foundation, flood, title, zoning, code violations)?
- Is there a deadline driving the sale (1031 exchange, divorce, estate, relocation)? That informs how much negotiation room exists.
- Schools are D-rated, which usually means shorter tenancies and higher turnover. Who's the typical renter profile here, and what's been the actual vacancy rate?
- Crime grade is F in this area — have there been break-ins, vandalism, or insurance claims at this property in the last 3 years? What carrier currently insures it and at what premium?
- The area grade is low — what's the realistic commute time and amenity access for the typical tenant pool here? Any planned neighborhood developments (good or bad) we should know about?
- What's the average days-on-market for RENTAL listings here right now (not sales)? A rising rental-DOM trend means longer vacancies and softer asking-rent achievability than the comps imply.
- What's the recent tenant-quality profile in this submarket — average credit score on applications, eviction rate, late-payment / NSF rate, and stable-employment percentage? A property-management company in the area should have these aggregated.
- How much new for-sale + rental construction is in the pipeline within 1–3 miles? Heavy new supply typically softens prices + rents 12–24 months out; constrained supply supports both.
Investment metrics
- 1% rule
- 5.17% ✓
- Cap rate
- 43.65%
- Cash-on-cash
- 133.41%
- DSCR
- 6.94
- GRM
- 1.6
CMA / ARV
- ARV (median comp)
- $40,566
- List price
- $19,900
- Delta
- -50.94%
- Verdict
- UNDERPRICED
- Comps
- 20 within 1.0 mi
Show comp detail 12 sales within ~0.75 mi
| Address | Dist | Beds/Ba | Sqft | Sold | Price | $/sf | Match |
|---|---|---|---|---|---|---|---|
| 1057 Harding Dr | 0.18mi | 3/2.0 | 1,184 (-3%) | 4mo | $98,500 | $83 | 79 |
| 837 Orchard St | 0.54mi | 3/1.0 | 1,224 (0%) | 1mo | $19,000 | $16 | 74 |
| 1127 Harding Dr | 0.12mi | 3/1.0 | 1,104 (-10%) | 4mo | $22,000 | $20 | 74 |
| 1023 Shadowlawn Dr | 0.54mi | 3/1.0 | 1,193 (-2%) | 2mo | $72,000 | $60 | 69 |
| 445 Hiett Ave | 0.40mi | 3/1.0 | 1,144 (-6%) | 3mo | $33,000 | $29 | 68 |
| 819 Lodge Ave | 0.50mi | 3/2.0 | 1,190 (-3%) | 1mo | $65,000 | $55 | 67 |
| 839 Brighton Ave | 0.56mi | 3/1.0 | 1,260 (+3%) | 3mo | $102,000 | $81 | 66 |
| 829 Ogden Ave | 0.68mi | 3/1.0 | 1,220 (-0%) | 2mo | $100,000 | $82 | 66 |
| 819 Geneva Ave | 0.73mi | 3/1.0 | 1,212 (-1%) | 2mo | $105,000 | $87 | 63 |
| 752 Hampton Ave | 0.65mi | 2/1.5 (-1) | 1,182 (-3%) | 2mo | $85,900 | $73 | 56 |
| 1152 Colton St | 0.44mi | 3/1.0 | 1,046 (-14%) | 1mo | $65,000 | $62 | 54 |
| 855 Brighton Ave | 0.57mi | 3/1.0 | 1,070 (-13%) | 2mo | $97,500 | $91 | 51 |
Match score weights: distance 35% · size 25% · config 20% · recency 20%. Top-matched comps best support the ARV.
Projected returns pro-forma
0.75% appreciation · 7.8% rent growth · sell at horizon
- IRR
- —
- Equity multiple
- 9.05×
- Total profit
- $44,845
- Equity at exit
- $6,535
- IRR
- —
- Equity multiple
- 22.02×
- Total profit
- $117,120
- Equity at exit
- $8,488
Cash invested: $5,572 (down + closing). Projections, not guarantees.
Landlord ↔ Tenant lean methodology
- Overall (STATE)
- 73 Landlord-Friendly
- State Ohio
- 73 Landlord-Friendly · R+6
- County
- — inherits STATE
- City
- — inherits STATE
ZIP-level market 43609
- Home prices YoY
- 0.3%
- Rents YoY
- 7.8%
- Active inventory
- 100
- Price-to-rent
- 1.6×
Monthly cashflow live
- Estimated rent
- $1,029 high interval (Pro) →
- Mortgage (P&I)
- −$104
- Tax from tax record
- −$81 /mo · $973/yr
- Insurance
- −$8
- HOA
- −$0
- Lot rent
- −$0
- Vacancy / Maint / Mgmt
- −$216
- Net cashflow
- $619
Break-even live
Sensitivity live
| Price | -10% $689 | -5% $683 | +0% $619 | +5% $614 | +10% $608 |
|---|---|---|---|---|---|
| Rent | -10% $538 | -5% $579 | +0% $619 | +5% $660 | +10% $701 |
| Rate | -1.0pp $629 | -0.5pp $625 | base $619 | +0.5pp $614 | +1.0pp $609 |
UW: 25.0% down · 7.5% · 30yr · 1.5% tax · 5.0% vac · 8.0% maint · 8.0% mgmt
Financing live
Cash to close
- Down payment
- $4,975
- Closing costs
- $597
- Reserves months
- —
- Total cash needed
- —
Loan-product check · same deal, 3 products live
Conventional
25% down · 7.5% · 30yr
- Down + closing
- —
- Monthly P&I
- —
- Monthly cashflow
- —
- DSCR
- —
- Eligible?
- —
Personal DTI + credit; lowest rate.
DSCR
20% down · 8.5% · 30yr
- Down + closing
- —
- Monthly P&I
- —
- Monthly cashflow
- —
- DSCR
- —
- Eligible?
- —
No personal income docs; deal must DSCR.
Hard money
10% down · 12.0% · 12mo
- Down + closing
- —
- Monthly P&I
- —
- Monthly cashflow
- —
- DSCR
- —
- Eligible?
- —
Short-term bridge; refi at stabilization.
Rent comps 17 comps
| Address | Beds | Baths | Sqft | Rent | $/sqft | DOM | Units | Dist |
|---|---|---|---|---|---|---|---|---|
| 2424 Broadway St Toledo, OH | 3.0 | 1.0 | 1416 | $1,049 | $0.74 | 16d | 1 | 0.22mi |
| 1418 Colburn St Toledo, OH | 3.0 | 1.0 | 992 | $1,200 | $1.21 | 16d | 1 | 0.39mi |
| 724 Spencer St Toledo, OH | 3.0 | 1.5 | 1127 | $1,100 | $0.98 | 46d | 1 | 0.40mi |
| 705 Nicholas St Toledo, OH | 2.0 | 1.0 | 1037 | $900 | $0.87 | 46d | 1 | 0.48mi |
| 532 Carlton St Toledo, OH | 3.0 | 1.0 | 1130 | $1,050 | $0.93 | 46d | 1 | 0.51mi |
| 523 Nicholas St Toledo, OH | 3.0 | 1.0 | 1290 | $1,350 | $1.05 | 16d | 1 | 0.54mi |
| 1321 Gordon St Toledo, OH | 3.0 | 1.0 | 1121 | $1,050 | $0.94 | 46d | 1 | 0.55mi |
| 2594 Broadway St Toledo, OH | 2.0 | 1.0 | 1076 | $825 | $0.77 | 46d | 1 | 0.56mi |
| 837 Colburn St Unit 2 Toledo, OH | 2.0 | 1.0 | 1158 | $695 | $0.60 | 25d | 1 | 0.58mi |
| 837 Colburn St Unit 1 Toledo, OH | 2.0 | 1.0 | 1178 | $700 | $0.59 | 46d | 1 | 0.58mi |
| 771 Orchard St Unit 7715 Toledo, OH | 2.0 | 1.0 | 1086 | $645 | $0.59 | 25d | 1 | 0.59mi |
| 827 Colburn St Toledo, OH | 2.0 | 1.0 | 1092 | $750 | $0.69 | 46d | 1 | 0.60mi |
| 1734 Arlington Ave Toledo, OH | 2.0 | 1.0 | 700 | $800 | $1.14 | 16d | 1 | 0.80mi |
| 2044 Arlington Ave Toledo, OH | 2.0 | 1.0 | 800 | $825 | $1.03 | 23d | 1 | 1.21mi |
| 244 Knower St Toledo, OH | 3.0 | 1.0 | 1120 | $995 | $0.89 | 16d | 1 | 1.30mi |
| 319 N Detroit Ave Toledo, OH | 3.0 | 1.0 | 1341 | $845 | $0.63 | 46d | 1 | 1.41mi |
| 307 Danberry St Toledo, OH | 2.0 | 1.0 | 988 | $950 | $0.96 | 46d | 1 | 1.48mi |
Listing history 32 events
-
2026-06-21days on market $19,900 Active 165 DOM
-
2026-06-18days on market $19,900 Active 162 DOM
-
2026-06-17days on market $19,900 Active 161 DOM
-
2026-06-16days on market $19,900 Active 160 DOM
-
2026-06-15days on market $19,900 Active 159 DOM
-
2026-06-14days on market $19,900 Active 157 DOM
-
2026-06-10days on market $19,900 Active 154 DOM
-
2026-06-09days on market $19,900 Active 153 DOM
-
2026-06-08days on market $19,900 Active 152 DOM
-
2026-06-07days on market $19,900 Active 151 DOM
-
2026-06-05days on market $19,900 Active 148 DOM
-
2026-06-03days on market $19,900 Active 147 DOM
-
2026-06-02days on market $19,900 Active 146 DOM
-
2026-06-01days on market $19,900 Active 145 DOM
-
2026-05-31days on market $19,900 Active 144 DOM
-
2026-05-30days on market $19,900 Active 143 DOM
-
2026-04-14status Active 384-char remark
Show marketing remark (384 chars)
Great opportunity for investors seeking a flip or value-add project with strong upside. This property offers excellent potential to renovate, reposition, and build equity quickly. Buyer will need to complete the City of Toledo vetting process, as the property currently has violations on record. All fines have been paid. Seller will make no repairs and is selling the property as is.
-
2026-03-26historical Contingent 384-char remark
Show marketing remark (384 chars)
Great opportunity for investors seeking a flip or value-add project with strong upside. This property offers excellent potential to renovate, reposition, and build equity quickly. Buyer will need to complete the City of Toledo vetting process, as the property currently has violations on record. All fines have been paid. Seller will make no repairs and is selling the property as is.
-
2026-03-13price $19,900 384-char remark
Show marketing remark (384 chars)
Great opportunity for investors seeking a flip or value-add project with strong upside. This property offers excellent potential to renovate, reposition, and build equity quickly. Buyer will need to complete the City of Toledo vetting process, as the property currently has violations on record. All fines have been paid. Seller will make no repairs and is selling the property as is.
-
2026-03-12status Active 384-char remark
Show marketing remark (384 chars)
Great opportunity for investors seeking a flip or value-add project with strong upside. This property offers excellent potential to renovate, reposition, and build equity quickly. Buyer will need to complete the City of Toledo vetting process, as the property currently has violations on record. All fines have been paid. Seller will make no repairs and is selling the property as is.
-
2026-02-12status Pending 384-char remark
Show marketing remark (384 chars)
Great opportunity for investors seeking a flip or value-add project with strong upside. This property offers excellent potential to renovate, reposition, and build equity quickly. Buyer will need to complete the City of Toledo vetting process, as the property currently has violations on record. All fines have been paid. Seller will make no repairs and is selling the property as is.
-
2025-11-21$31,400 Active 384-char remark
Show marketing remark (384 chars)
Great opportunity for investors seeking a flip or value-add project with strong upside. This property offers excellent potential to renovate, reposition, and build equity quickly. Buyer will need to complete the City of Toledo vetting process, as the property currently has violations on record. All fines have been paid. Seller will make no repairs and is selling the property as is.
-
2025-10-09price $5,000
-
2009-07-12historical
-
2009-01-12$29,900
-
2007-02-10historical
-
2006-08-10$35,000
-
2003-12-31soldstatus $5,000
-
2003-12-09$8,500
-
2003-09-04historical
-
2003-06-05$12,000
-
1997-10-09soldstatus $16,000
ⓘ Source: listings_history table (triggers on properties + properties_extension) + one-shot
backfill from property_details.listing_events for pre-trigger history.
Tax reassessment forecast OH · Partial reset (capped growth)
- Current annual tax
- $973 · $81/mo
- Projected year-2 tax
- $973 · $81/mo
- Expected delta
- $0/yr ($0/mo · 0.0%)
ⓘ Screening estimate from a state-policy table — verify with the county assessor before closing.
Climate risk First Street
- Flood 1/10 Low FEMA zone X (unshaded) · 0% chance over 30 yrs
- Wildfire 1/10 Low
- Heat 3/10 Moderate 7 d/yr ≥101°F today · 16 d/yr by 30 yrs out
- Wind 2/10 Low
- Air quality 2/10 Low 1 unhealthy d/yr today · 2 by 30 yrs out
Nearby sold comps map
Loading sold comps map…
Walkable amenities ~0.75 mi
Loading nearby amenities…
Taxation est. · year 1
- Rental income
- $12,352
- − Mortgage interest
- −$1,115
- − Property taxes
- −$973
- − Insurance
- −$100
- − Repairs & maintenance
- −$988
- − Management
- −$988
- − Depreciation
- −$579
- Taxable income
- $7,610
- Est. tax owed @ 24.0%
- −$1,826
- After-tax cash flow
- $5,607/yr
For passive investors: Depreciation is non-cash, so a rental often shows a tax loss while cash-flowing — sheltering income. Rental losses are passive: they offset passive income freely, and up to $25,000/yr can offset ordinary (W-2) income if you actively participate and your MAGI is under $100k (phasing out to $0 by $150k); unused losses carry forward. On sale, claimed depreciation is recaptured at up to 25%, and gains may owe capital-gains tax (a 1031 exchange can defer both). Figures are a year-1 estimate at your 24.0% rate — not tax advice; consult a CPA.
Schools (NCES district)
- District
- Toledo City
- NCES district ID
- 3904490
- Math proficiency
- 15% ▼ -16.00%
- Reading proficiency
- 24% ▼ -13.00%
- Median HH income
- $32,137
- Composite
- 15.76/100
- National rank
- #9276
- State rank
- #634 of 656 in OH
Livability — Toledo
- Score
- 66/100
- State rank
- #645
- US rank
- #11442
Category grades
Schools grade is shown separately in the Schools card above.
Census & demographics
- Census place
- Toledo, OH
- County
- Lucas County · 380,724 people
- City population
- 280,811
- Metro
- Toledo, OH
- Population (ZIP)
- 21,404
- Household income
- $42,313
- Rent vs Own
- Severe rent burden
- 1603.0
Population outlook (Lucas County) Hauer SSP2
- Today (2025)
- 420,751 people
- By 2030
- 410,187 · -2.5%
- By 2040
- 384,019 · -8.7%
- By 2050
- 355,125 · -15.6%
- By 2075
- 291,683 · -30.7%
- By 2100
- 233,670 · -44.5%
Race, ethnicity, and origin ACS 2023
- Neighborhood character
- Diverse neighborhood (Simpson 0.66)
- Race & ethnicity
- White 47% Black 29% Hispanic / Latino 17% Two or more races 9%
- Hispanic origin (detail)
- Mexican 15%
- Common ancestry
- Romanian 5% Lithuanian 2% Italian 1%
- Foreign-born
- 4% · Canada, China
- Languages at home
- 92% English-only · Spanish 5% Arabic 1% French/Haitian/Cajun 1%
Political lean MEDSL · Lucas
- 2024 margin
- D (+12.6) · D 55.8% · R 43.2%
- 2008→2024 swing
- -18.9pp toward R · 2008: 31.4pp · 2024: 12.6pp
- All cycles
- 2024: D+12.6 2020: D+16.8 2016: D+17.4 2012: D+30.4 2008: D+31.4
Not yet ingested
- Civics
- —
Market trends
- HPI YoY
- ▲ 0.75%
- Current HPI
- 235.2515
- Rent YoY
- ▲ 7.80%
- Metro
- Toledo, OH
- State GDP YoY
- ▲ 1.98%
- F500 in state
- 48
Industry mix (Fortune 500 HQ in OH)
| Industry | F500 HQs | Revenue |
|---|---|---|
| Insurance | 3 | $145B |
|
||
| Industrial Machinery | 3 | $49B |
|
||
| Financial Services | 3 | $24B |
|
||
| Consumer Goods | 2 | $93B |
|
||
| Aerospace / Defense | 2 | $47B |
|
||
| Utilities | 2 | $33B |
|
||
Price history
+24.4% since first listed16 events — show timeline
- 2026-04-14 Relisted — NORIS
- 2026-03-26 Contingent — NORIS
- 2026-03-13 Price Changed $19,900 NORIS
- 2026-03-12 Relisted — NORIS
- 2026-02-12 Pending — NORIS
- 2025-11-21 Listed $31,400 NORIS
- 2025-10-09 Price Changed $5,000 NORIS
- 2009-07-12 Listing Removed — NORIS
- 2009-01-12 Listed $29,900 NORIS
- 2007-02-10 Listing Removed — NORIS
- 2006-08-10 Listed $35,000 NORIS
- 2003-12-31 Sold (MLS) $5,000 NORIS
- 2003-12-09 Listed $8,500 NORIS
- 2003-09-04 Listing Removed — NORIS
- 2003-06-05 Listed $12,000 NORIS
- 1997-10-09 Sold (Public Records) $16,000 Public Records
Property tax history
+3.9%/yrLatest (2025): $973 · +2.8% YoY. Source: county tax records.
Cash-flow waterfall
monthlySold comps — $/sqft
last 12 mo · ≤1 miLoading sold comps…