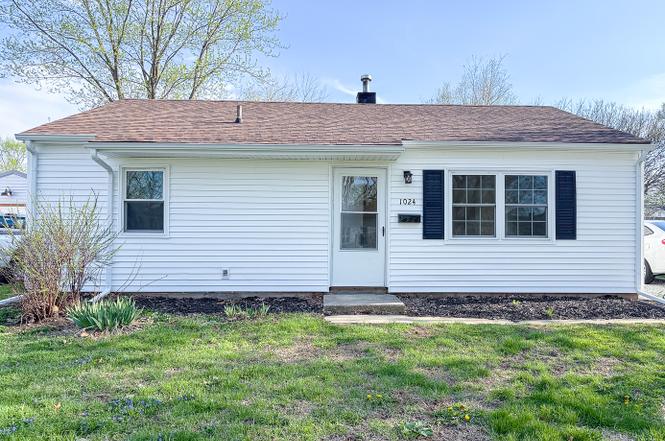
1024 Eastview Dr · Rantoul, IL
Flood risk 1/10 · Minimal
- FEMA flood zone
- X (unshaded)
- Chance of flooding over 30 yrs
- 0.0%
- Est. flood insurance / yr
- $507 – $1,088
Fire risk 1/10 · Minimal
- Est. fire insurance / yr
- $804 – $1,492
Heat risk 3/10 · Minor
- Hot days now (above 106°F)
- 7 days/yr
- Hot days in 30 yrs
- 18 days/yr
Wind risk 2/10 · Minimal
- Chance of severe wind over 30 yrs
- 1.0%
Air-quality risk 2/10 · Minimal
- Unhealthy air days now
- 0 days/yr
- Unhealthy air days in 30 yrs
- 1 days/yr
Risk factors via First Street. Map © Google.
Why this score? — see what drove the D- grade
The composite is a weighted blend of 9 inputs, each scored 0–100. Each bar is that input's sub-score; the figure is the points it added to the 100-point composite (weight × sub-score).
- Appreciation +10.0/10.0
- Cash flow +9.5/30.0
- Rent growth +4.1/5.0
- ARV discount +3.7/15.0
- Livability +3.4/5.0
- DSCR +2.7/10.0
- Condition / age +2.5/5.0
- 1% rule +2.0/10.0
- Schools +1.2/10.0
$129,900
🖨 Deal sheet (PDF) 📄 Offer letter ✓ Due diligence
Listing remarks
Step into this beautifully updated 3-bedroom, 1-bath home that is truly move-in ready! You will appreciate the modern updates throughout, including a brand-new kitchen with new refrigerator, fresh flooring, and stylish neutral paint that creates a bright and inviting atmosphere. Major mechanical updates add peace of mind, with a new roof, new A/C unit, and new water heater, along with upgraded ceiling fans and light fixtures throughout. Fresh, modern, and full of charm, this home is ready for its next owner to move right in and make it their own. Do not miss the opportunity to call this updated gem home!
Key facts
- New a/c unit
- New water heater
- New refrigerator
Tags
Property features AI
Finance
- Other: Fee simple ownership; Property reported as built before 1978
- HOA & community: No master association fees required
Exterior
- Parking: Owned parking for 2 vehicles
- Utilities: Public water; Public sewer; Electric service (standard)
- Home design: Detached single-family home; One-story
- Construction: Built approximately 71–80 years ago; Shallow/none unfinished basement (no unfinished basement area reported)
- Exterior features: Lot dimensions approximately 57 x 110; Lot size less than 0.25 acre; Vinyl siding
Interior
- Kitchen: Range; Refrigerator; Range hood
- Bedrooms: 3 bedrooms (all on the main level); Master bedroom on the main level
- Flooring: Wood laminate flooring throughout main living areas and bedrooms
- Bathrooms: 1 full bathroom
- Heating & cooling: Natural gas forced-air heating; Central air conditioning
- Interior features: Five total rooms
- Laundry & utility: Dedicated laundry room
Neighborhood map
What this means for you Summary
Snapshot
- This is a 3-bed/1.0-bath single-family listed at $130k.
Deal economics
- At list price, monthly cash flow is $-90 ($-1k/yr) — negative.
- To cash-flow at today's rent, offer at most $114k (12.2% below list).
- To meet the 1% rule (rent ≥ 1% of price), the offer needs to be $91k (30.1% below list).
- Recommended offer: $91k (30.1% below list) — sets the bar for 1% rule.
- Cap rate 5.5% vs local median 4.3% in Rantoul — meaningfully above typical; check what's discounted (condition, days-on-market, listing class) to confirm the premium yield is real.
Location & tenants
- Location reads 67/100 on livability (#533 in IL) — a middle-class / working-renter tenant base. Strengths: cost of living A+, housing A+, health & safety B; Watch: employment D, crime F, amenities F.
- Rantoul Township Hsd 193 (town): math 10% / reading 10% proficiency, ranked #824 of 919 in IL (top 90%) — low school quality limits family demand, transient renter base, plan for 1-2y turnover.
- Zoned schools: Northview Elem School (math 2% / reading 12%, grade F, #1,673 of 2,056 statewide, top 84%, 251 students, 0% FRL); J W Eater Jr High School (math 2% / reading 6%, grade F, #651 of 665 statewide, top 98%, 516 students, 0% FRL); Rantoul Twp High School (math 8% / reading 12%, grade F, #567 of 693 statewide, top 83%, 848 students, 0% FRL).
- Market conditions: Rents rising fast (+6.6%/yr); 53 active listings in the ZIP; 8 comparable units currently listed for rent nearby; rentals at typical pace (median 15d on market — plan ~3-4 weeks tenant-placement turnaround); 573 units permitted in Champaign County in 2024 (359 in 5+ unit buildings).
Forward outlook
- In year one you build about $14k of equity ($898 loan paydown + $13k appreciation (10.0% local appreciation)).
- Champaign County population projected at +15% by 2050 — modest demand growth; plan on rents tracking national, not racing it.
- By year 3, paydown + projected appreciation supports a ~$35k cash-out refi (75% LTV) — recoverable capital for the next deal without selling this one.
Negotiation context
- It's been on market 149 days — a 12% lower offer ($114k) is reasonable based on typical stale-listing flexibility.
- 3 sale attempts since 27y ago with the ask held roughly flat each time — persistent listings suggest the price (not the market) is what's stuck; bring a comps-based counter.
- Current owner paid $26k; list at $130k implies a 400% gain — meaningful room to come down on a strong offer.
Risks & watch-outs
- Watch-outs: built in 1952 — expect roof / HVAC / electrical / plumbing capex.
Questions for the listing agent
- What do current leases actually rent for vs. the listed asking? Can we see a recent rent roll and the last 12 months of T-12 income?
- It's been on market 149 days. Have you received any prior offers? Is the seller open to a 30% concession, seller financing, or rate buy-down credit?
- Built in 1952 — when were the roof, HVAC, electrical panel, plumbing, and water heater last replaced?
- Why hasn't it sold? Are there any deal-killer items the seller is aware of (foundation, flood, title, zoning, code violations)?
- Is there a deadline driving the sale (1031 exchange, divorce, estate, relocation)? That informs how much negotiation room exists.
- Schools are F-rated, which usually means shorter tenancies and higher turnover. Who's the typical renter profile here, and what's been the actual vacancy rate?
- Crime grade is F in this area — have there been break-ins, vandalism, or insurance claims at this property in the last 3 years? What carrier currently insures it and at what premium?
- The area grade is low — what's the realistic commute time and amenity access for the typical tenant pool here? Any planned neighborhood developments (good or bad) we should know about?
- What's the average days-on-market for RENTAL listings here right now (not sales)? A rising rental-DOM trend means longer vacancies and softer asking-rent achievability than the comps imply.
- What's the recent tenant-quality profile in this submarket — average credit score on applications, eviction rate, late-payment / NSF rate, and stable-employment percentage? A property-management company in the area should have these aggregated.
- How much new for-sale + rental construction is in the pipeline within 1–3 miles? Heavy new supply typically softens prices + rents 12–24 months out; constrained supply supports both.
Investment metrics
- 1% rule
- 0.70% ✗
- Cap rate
- 5.46%
- Cash-on-cash
- -2.97%
- DSCR
- 0.87
- GRM
- 11.9
CMA / ARV
- ARV (on-the-fly)
- $119,875
- Comps found
- 12
Show comp detail 12 sales within ~0.75 mi
| Address | Dist | Beds/Ba | Sqft | Sold | Price | $/sf | Match |
|---|---|---|---|---|---|---|---|
| 1024 Eastview Dr | 0.00mi | 3/1.0 | 875 (0%) | 1mo | $127,900 | $146 | 99 |
| 1068 Eastview Dr | 0.12mi | 2/1.0 (-1) | 905 (+3%) | 11mo | $98,000 | $108 | 75 |
| 1037 Bel Aire Dr | 0.05mi | 2/1.0 (-1) | 780 (-11%) | 1mo | $120,000 | $154 | 74 |
| 1037 Eastview Dr | 0.05mi | 2/1.0 (-1) | 766 (-12%) | 1mo | $117,000 | $153 | 71 |
| 804 Juniper Dr | 0.22mi | 2/1.0 (-1) | 807 (-8%) | 1mo | $120,000 | $149 | 70 |
| 1016 Klein Ave | 0.56mi | 3/1.0 | 870 (-1%) | 7mo | $135,000 | $155 | 67 |
| 1116 Bel Aire Dr | 0.21mi | 2/1.0 (-1) | 760 (-13%) | 2mo | $90,400 | $119 | 62 |
| 800 Juniper Dr | 0.22mi | 3/1.5 | 1,000 (+14%) | 4mo | $135,500 | $136 | 60 |
| 932 E Sangamon Ave | 0.54mi | 2/1.0 (-1) | 925 (+6%) | 2mo | $60,000 | $65 | 59 |
| 19 Charles Dr | 0.63mi | 2/1.0 (-1) | 898 (+3%) | 6mo | $37,000 | $41 | 57 |
| 1208 Bel Aire Dr | 0.40mi | 2/1.0 (-1) | 809 (-8%) | 10mo | $70,000 | $87 | 55 |
| 925 E Sangamon Ave | 0.51mi | 3/1.0 | 964 (+10%) | 9mo | $132,000 | $137 | 52 |
Match score weights: distance 35% · size 25% · config 20% · recency 20%. Top-matched comps best support the ARV.
Projected returns pro-forma
10.0% appreciation · 6.56% rent growth · sell at horizon
- IRR
- 23.1%
- Equity multiple
- 2.88×
- Total profit
- $68,346
- Equity at exit
- $117,024
- IRR
- 21.4%
- Equity multiple
- 6.87×
- Total profit
- $213,584
- Equity at exit
- $252,367
Cash invested: $36,372 (down + closing). Projections, not guarantees.
Landlord ↔ Tenant lean methodology
- Overall (STATE)
- 43 Moderately Tenant-Leaning
- State Illinois
- 43 Moderately Tenant-Leaning · D+7
- County
- — inherits STATE
- City
- — inherits STATE
ZIP-level market 61866
- Home prices YoY
- 10.8%
- Rents YoY
- 6.6%
- Active inventory
- 53
- Price-to-rent
- 11.9×
Monthly cashflow live
- Estimated rent
- $909 high interval (Pro) →
- Mortgage (P&I)
- −$681
- Tax from tax record
- −$72 /mo · $868/yr
- Insurance
- −$54
- HOA
- −$0
- Vacancy / Maint / Mgmt
- −$191
- Net cashflow
- $-90
Break-even live
Sensitivity live
| Price | -10% $-16 | -5% $-53 | +0% $-90 | +5% $-127 | +10% $-163 |
|---|---|---|---|---|---|
| Rent | -10% $-162 | -5% $-126 | +0% $-90 | +5% $-54 | +10% $-18 |
| Rate | -1.0pp $-25 | -0.5pp $-57 | base $-90 | +0.5pp $-124 | +1.0pp $-158 |
UW: 25.0% down · 7.5% · 30yr · 1.5% tax · 5.0% vac · 8.0% maint · 8.0% mgmt
Financing live
Cash to close
- Down payment
- $32,475
- Closing costs
- $3,897
- Reserves months
- —
- Total cash needed
- —
Loan-product check · same deal, 3 products live
Conventional
25% down · 7.5% · 30yr
- Down + closing
- —
- Monthly P&I
- —
- Monthly cashflow
- —
- DSCR
- —
- Eligible?
- —
Personal DTI + credit; lowest rate.
DSCR
20% down · 8.5% · 30yr
- Down + closing
- —
- Monthly P&I
- —
- Monthly cashflow
- —
- DSCR
- —
- Eligible?
- —
No personal income docs; deal must DSCR.
Hard money
10% down · 12.0% · 12mo
- Down + closing
- —
- Monthly P&I
- —
- Monthly cashflow
- —
- DSCR
- —
- Eligible?
- —
Short-term bridge; refi at stabilization.
Rent comps 8 comps
| Address | Beds | Baths | Sqft | Rent | $/sqft | DOM | Units | Dist |
|---|---|---|---|---|---|---|---|---|
| 909 N Maplewood Dr Rantoul, IL | 2.0–3.0 | 1.0 | 950 | $910 | $0.96 | 4d | 8 | 0.45mi |
| 418 N High St Rantoul, IL | 2.0 | 1.0 | 650 | $775 | $1.19 | 15d | 1 | 0.45mi |
| 355 North Dr Unit 355-06 Rantoul, IL | 2.0 | 1.0 | 600 | $750 | $1.25 | 15d | 1 | 0.46mi |
| 54 Mahoning Ave Unit 54 Rantoul, IL | 3.0 | 1.0 | 960 | $1,100 | $1.15 | 15d | 1 | 0.48mi |
| 40 Mahoning Ave Rantoul, IL | 2.0 | 1.0 | 700 | $425 | $0.61 | 4d | 1 | 0.55mi |
| 1505 Hobson Dr Rantoul, IL | 1.0–3.0 | 1.0–1.5 | 925 | $995 | $1.08 | 4d | 7 | 0.86mi |
| 603 S Maplewood Dr Unit 6031-MW Rantoul, IL | 2.0 | 1.0 | 675 | $785 | $1.16 | 23d | 1 | 0.98mi |
| 620 Willow Pond Rd Rantoul, IL | 2.0–4.0 | 1.5–2.5 | 1320 | $915 | $0.69 | 4d | 7 | 1.25mi |
Listing history 10 events
-
2026-05-31status $129,900 Pending 149 DOM
-
2026-05-30days on market $129,900 Contingent - Continue to Show 149 DOM
-
2026-04-19historical Contingent - Continue to Show
-
2026-03-31price $129,900
-
2026-01-01$132,500 Active
-
2025-12-31historical
-
2025-10-10Active
-
1999-05-12soldstatus $26,000
-
1999-04-30historical
-
1999-01-29$31,500
ⓘ Source: listings_history table (triggers on properties + properties_extension) + one-shot
backfill from property_details.listing_events for pre-trigger history.
Tax reassessment forecast IL · Partial reset (capped growth)
- Current annual tax
- $868 · $72/mo
- Projected year-2 tax
- $1,908 · $159/mo
- Expected delta
- +$1,040/yr (+$87/mo · 119.8%)
ⓘ Screening estimate from a state-policy table — verify with the county assessor before closing.
Climate risk First Street
- Flood 1/10 Low FEMA zone X (unshaded) · 0% chance over 30 yrs
- Wildfire 1/10 Low
- Heat 3/10 Moderate 7 d/yr ≥106°F today · 18 d/yr by 30 yrs out
- Wind 2/10 Low 100% chance of damaging wind over 30 yrs
- Air quality 2/10 Low 0 unhealthy d/yr today · 1 by 30 yrs out
Nearby sold comps map
Loading sold comps map…
Walkable amenities ~0.75 mi
Loading nearby amenities…
Taxation est. · year 1
- Rental income
- $10,902
- − Mortgage interest
- −$7,276
- − Property taxes
- −$868
- − Insurance
- −$650
- − Repairs & maintenance
- −$872
- − Management
- −$872
- − Depreciation
- −$3,779
- Taxable loss
- −$3,415
- Est. tax savings @ 24.0%
- +$820
- After-tax cash flow
- $-260/yr
For passive investors: Depreciation is non-cash, so a rental often shows a tax loss while cash-flowing — sheltering income. Rental losses are passive: they offset passive income freely, and up to $25,000/yr can offset ordinary (W-2) income if you actively participate and your MAGI is under $100k (phasing out to $0 by $150k); unused losses carry forward. On sale, claimed depreciation is recaptured at up to 25%, and gains may owe capital-gains tax (a 1031 exchange can defer both). Figures are a year-1 estimate at your 24.0% rate — not tax advice; consult a CPA.
Schools (NCES district)
- District
- Rantoul Township Hsd 193
- NCES district ID
- 1733240
- Math proficiency
- 10% ▼ -5.00%
- Reading proficiency
- 10% ▬ 0.00%
- Median HH income
- $38,128
- Composite
- 12.14/100
- National rank
- #14582
- State rank
- #824 of 919 in IL
Livability — Rantoul
- Score
- 67/100
- State rank
- #533
- US rank
- #11081
Category grades
Schools grade is shown separately in the Schools card above.
Census & demographics
- Census place
- Rantoul, IL
- County
- Champaign County · 182,148 people
- City population
- 13,470
- Metro
- Champaign-Urbana, IL
- Population (ZIP)
- 13,470
- Household income
- $50,686
- Rent vs Own
- Severe rent burden
- 281.0
Population outlook (Champaign County) Hauer SSP2
- Today (2025)
- 223,848 people
- By 2030
- 231,416 · +3.4%
- By 2040
- 244,321 · +9.1%
- By 2050
- 256,432 · +14.6%
- By 2075
- 285,823 · +27.7%
- By 2100
- 296,406 · +32.4%
Race, ethnicity, and origin ACS 2023
- Neighborhood character
- Diverse neighborhood (Simpson 0.69)
- Race & ethnicity
- White 48% Two or more races 23% Hispanic / Latino 21% Black 20%
- Hispanic origin (detail)
- Mexican 16% Puerto Rican 3%
- Common ancestry
- Romanian 1% Iranian 1% Slovak 1%
- Foreign-born
- 9% · Canada, Jamaica
- Languages at home
- 84% English-only · Spanish 14% Russian/Polish/Slavic 1%
Political lean MEDSL · Champaign
- 2024 margin
- Strong D (+24.1) · D 61.3% · R 37.2% · Other 1.5%
- 2008→2024 swing
- +6.6pp toward D · 2008: 17.5pp · 2024: 24.1pp
- All cycles
- 2024: D+24.1 2020: D+22.8 2016: D+18.4 2012: D+6.8 2008: D+17.5
Not yet ingested
- Civics
- —
Market trends
- HPI YoY
- ▲ 26.49%
- Current HPI
- 272.2527
- Rent YoY
- ▲ 6.56%
- Metro
- Champaign-Urbana, IL
- State GDP YoY
- ▲ 1.59%
- F500 in state
- 60
Industry mix (Fortune 500 HQ in IL)
| Industry | F500 HQs | Revenue |
|---|---|---|
| Insurance | 4 | $201B |
|
||
| Consumer Goods | 4 | $87B |
|
||
| Industrial Machinery | 3 | $64B |
|
||
| Healthcare | 2 | $55B |
|
||
| Retail / Pharmacy | 1 | $148B |
|
||
| Agriculture / Food | 1 | $86B |
|
||
Price history
+312.4% since first listed8 events — show timeline
- 2026-04-19 Contingent — MRED as Distributed by MLS Grid
- 2026-03-31 Price Changed $129,900 MRED as Distributed by MLS Grid
- 2026-01-01 Listed $132,500 MRED as Distributed by MLS Grid
- 2025-12-31 Listing Removed — MRED as Distributed by MLS Grid
- 2025-10-10 Listed — MRED as Distributed by MLS Grid
- 1999-05-12 Sold (MLS) $26,000 MRED as Distributed by MLS Grid
- 1999-04-30 Listing Removed — MRED as Distributed by MLS Grid
- 1999-01-29 Listed $31,500 MRED as Distributed by MLS Grid
Property tax history
+3.6%/yrLatest (2024): $868 · +14.7% YoY. Source: county tax records.
Cash-flow waterfall
monthlySold comps — $/sqft
last 12 mo · ≤1 miLoading sold comps…