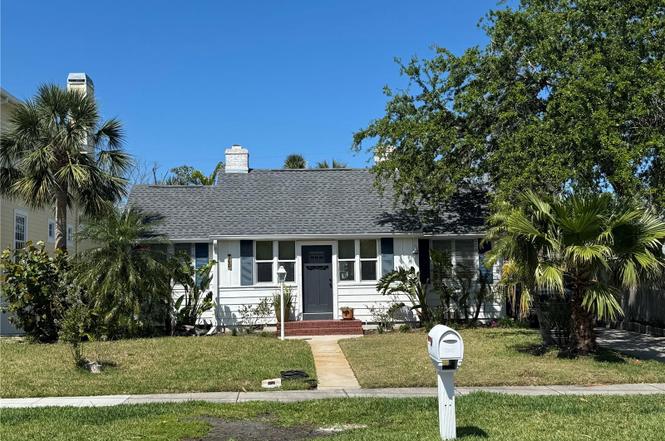
766 Bay Esplanade · Clearwater, FL
Flood risk 10/10 · Severe
- FEMA flood zone
- AE
- Chance of flooding over 30 yrs
- 0.99%
- Est. flood insurance / yr
- $1,737 – $8,500
Fire risk 1/10 · Minimal
- Est. fire insurance / yr
- $947 – $1,759
Heat risk 10/10 · Severe
- Hot days now (above 110°F)
- 8 days/yr
- Hot days in 30 yrs
- 29 days/yr
Wind risk 10/10 · Severe
- Chance of severe wind over 30 yrs
- 99.0%
Air-quality risk 3/10 · Minor
- Unhealthy air days now
- 2 days/yr
- Unhealthy air days in 30 yrs
- 3 days/yr
Risk factors via First Street. Map © Google.
Why this score? — see what drove the D grade
The composite is a weighted blend of 9 inputs, each scored 0–100. Each bar is that input's sub-score; the figure is the points it added to the 100-point composite (weight × sub-score).
- Cash flow +12.7/30.0
- Appreciation +5.9/10.0
- Schools +4.3/10.0
- Livability +4.1/5.0
- DSCR +3.8/10.0
- ARV discount +3.7/15.0
- Rent growth +3.2/5.0
- 1% rule +3.0/10.0
- Condition / age +2.5/5.0
$719,000
🖨 Deal sheet (PDF) 📄 Offer letter ✓ Due diligence
Listing remarks
Under contract-accepting backup offers. Absolutely charming North Beach quintessential cottage home has only had 3 previous owners in 85 years. Light, bright and airy it is ideally located near an intercoastal access and a short walk straight to Clearwater’s beautiful beaches. This home boasts the location you want and is surrounded by many multi-million dollar high value properties. The very livable courtyard shaped floorplan has an easy flow and great feeling that makes this home live much larger than it is. Eat in Kitchen has two floor to ceiling pantry areas, north and east counter height windows plus a secondary side entry. The 87 foot long driveway features an offset for refuse/
Key facts
- Storage space
- Outdoor patio area
- Cottage home
Tags
Property features AI
Finance
- Other: Lot roughly 62 x 110 (0.16 acres)
- Financial info: Lease restrictions apply
Exterior
- Parking: 1-car garage
- Utilities: Public water; Public sewer; Cable connected; Electricity connected; Water connected; Sewer connected
- Home design: Single family residence; One story; Faces east; Residential property
- Construction: Frame construction; Shingle roof; Crawlspace foundation; Built on one level
- Exterior features: Storage; Asphalt road access
Interior
- Kitchen: No appliances listed
- Bedrooms: 3 bedrooms
- Flooring: Wood flooring
- Bathrooms: 2 full bathrooms
- Heating & cooling: Central heating; Central air conditioning
- Interior features: Eat-in kitchen; Wood-burning fireplace; Storage
- Laundry & utility: No laundry amenities listed
Neighborhood map
What this means for you Summary
Snapshot
- This is a 3-bed/2.5-bath single-family listed at $719k.
Deal economics
- At list price, monthly cash flow is $-509 ($-6k/yr) — negative.
- To cash-flow at today's rent, offer at most $629k (12.5% below list).
- To meet the 1% rule (rent ≥ 1% of price), the offer needs to be $577k (19.8% below list).
- Recommended offer: $577k (19.8% below list) — sets the bar for 1% rule.
Location & tenants
- Location reads 82/100 on livability (#60 in FL, #988 nationally) — a professional / high-income tenant draw. Strengths: commute A+, housing A+, health & safety A+; Watch: employment C-.
- Pinellas (suburban): math 51% / reading 51% proficiency, ranked #31 of 73 in FL (top 42%) — acceptable for families but not a draw, mixed tenant base, ~2y average lease.
- Zoned schools: Sandy Lane Elementary School (math 32% / reading 22%, grade F, #1,969 of 2,144 statewide, top 94%, 304 students, 85% FRL); Dunedin Highland Middle School (math 53% / reading 52%, grade C+, #213 of 571 statewide, top 38%, 899 students, 53% FRL); Clearwater High School (math 30% / reading 36%, grade F, #406 of 667 statewide, top 61%, 1,664 students, 59% FRL) — zoned schools average 66% FRL vs 48% district-wide (18 pts higher); higher-poverty schools than district average — tighter screening recommended.
- Zoned-school proficiency averages 38% at this address vs 51% district-wide (-14 pts) — the specific schools serving this property underperform the Pinellas average; the district grade overstates school quality for this exact location.
- Market conditions: Rents rising (+2.8%/yr); 431 active listings in the ZIP; 37 comparable units currently listed for rent nearby; rentals at typical pace (median 20d on market — plan ~3-4 weeks tenant-placement turnaround); high-income renter base; 2,676 units permitted in Pinellas County in 2024 (1,422 in 5+ unit buildings).
Forward outlook
- In year one you build about $19k of equity ($5k loan paydown + $14k appreciation (1.9% local appreciation)).
- Pinellas County population projected at +14% by 2050 — modest demand growth; plan on rents tracking national, not racing it.
- By year 3, paydown + projected appreciation supports a ~$47k cash-out refi (75% LTV) — recoverable capital for the next deal without selling this one.
Negotiation context
- It's been on market 379 days — a 12% lower offer ($633k) is reasonable based on typical stale-listing flexibility.
- 7 sale attempts since 20y ago with the ask held roughly flat each time — persistent listings suggest the price (not the market) is what's stuck; bring a comps-based counter.
- Current owner paid $225k; list at $719k implies a 220% gain — meaningful room to come down on a strong offer.
Risks & watch-outs
- Watch-outs: flood insurance adds $427/mo; built in 1940 — expect roof / HVAC / electrical / plumbing capex.
- Climate carrying-cost: in FEMA flood zone AE (mandatory federal flood insurance); severe wind risk, 99% chance of damaging wind over 30y; extreme-heat days projected 8→29/yr by 2055 (HVAC capex compounding) — expect insurance premiums to compound above CPI over the hold.
Questions for the listing agent
- What do current leases actually rent for vs. the listed asking? Can we see a recent rent roll and the last 12 months of T-12 income?
- It's been on market 379 days. Have you received any prior offers? Is the seller open to a 20% concession, seller financing, or rate buy-down credit?
- Built in 1940 — when were the roof, HVAC, electrical panel, plumbing, and water heater last replaced?
- What's the actual annual flood-insurance premium (NFIP or private), and is the property in a SFHA with mandatory coverage?
- Why hasn't it sold? Are there any deal-killer items the seller is aware of (foundation, flood, title, zoning, code violations)?
- Is there a deadline driving the sale (1031 exchange, divorce, estate, relocation)? That informs how much negotiation room exists.
- The area grade is low — what's the realistic commute time and amenity access for the typical tenant pool here? Any planned neighborhood developments (good or bad) we should know about?
- What's the average days-on-market for RENTAL listings here right now (not sales)? A rising rental-DOM trend means longer vacancies and softer asking-rent achievability than the comps imply.
- What's the recent tenant-quality profile in this submarket — average credit score on applications, eviction rate, late-payment / NSF rate, and stable-employment percentage? A property-management company in the area should have these aggregated.
- How much new for-sale + rental construction is in the pipeline within 1–3 miles? Heavy new supply typically softens prices + rents 12–24 months out; constrained supply supports both.
Investment metrics
- 1% rule
- 0.80% ✗
- Cap rate
- 6.16%
- Cash-on-cash
- -0.49%
- DSCR
- 0.98
- GRM
- 10.4
CMA / ARV
- ARV (on-the-fly)
- $662,560
- Comps found
- 11
Show comp detail 11 sales within ~0.75 mi
| Address | Dist | Beds/Ba | Sqft | Sold | Price | $/sf | Match |
|---|---|---|---|---|---|---|---|
| 43 Kipling Plz | 0.31mi | 2/3.0 (-1) | 1,631 (-0%) | 2mo | $521,678 | $320 | 76 |
| 741 Bruce Ave | 0.10mi | 3/2.0 | 1,650 (+1%) | 23mo | $1,075,000 | $652 | 73 |
| 860 Narcissus Ave | 0.26mi | 3/2.5 | 1,714 (+4%) | 19mo | $650,000 | $379 | 65 |
| 750 Lantana Ave | 0.07mi | 2/2.0 (-1) | 1,848 (+13%) | 11mo | $600,000 | $325 | 60 |
| 1019 Mandalay Ave | 0.64mi | 3/3.0 | 1,655 (+1%) | 16mo | $712,500 | $431 | 53 |
| 939 Mandalay Ave | 0.45mi | 3/2.0 | 1,755 (+7%) | 15mo | $550,000 | $313 | 53 |
| 950 Lantana Ave | 0.50mi | 3/2.0 | 1,792 (+9%) | 20mo | $525,000 | $293 | 43 |
| 921 Eldorado Ave | 0.43mi | 3/3.0 | 1,856 (+13%) | 16mo | $750,000 | $404 | 42 |
| 1007 Mandalay Ave | 0.61mi | 3/2.0 | 1,456 (-11%) | 18mo | $821,500 | $564 | 36 |
| 684 Harbor Is | 0.51mi | 4/2.0 (+1) | 1,864 (+14%) | 15mo | $1,234,000 | $662 | 34 |
| 1041 Eldorado Ave | 0.73mi | 3/3.0 | 1,873 (+14%) | 16mo | $960,000 | $513 | 27 |
Match score weights: distance 35% · size 25% · config 20% · recency 20%. Top-matched comps best support the ARV.
Projected returns pro-forma
1.88% appreciation · 2.76% rent growth · sell at horizon
- IRR
- 1.1%
- Equity multiple
- 1.06×
- Total profit
- $11,372
- Equity at exit
- $279,028
- IRR
- 5.1%
- Equity multiple
- 1.69×
- Total profit
- $138,463
- Equity at exit
- $398,328
Cash invested: $201,320 (down + closing). Projections, not guarantees.
Landlord ↔ Tenant lean methodology
- Overall (STATE)
- 87 Strongly Landlord-Friendly
- State Florida
- 87 Strongly Landlord-Friendly · R+3
- County
- — inherits STATE
- City
- — inherits STATE
ZIP-level market 33767
- Home prices YoY
- 0.6%
- Rents YoY
- 2.8%
- Active inventory
- 431
- Price-to-rent
- 10.4×
Monthly cashflow live
- Estimated rent
- $5,766 high interval (Pro) →
- Mortgage (P&I)
- −$3,771
- Tax from tax record
- −$567 /mo · $6,802/yr
- Insurance
- −$300
- Flood insurance flood zone
- −$427 /mo · $5,118/yr
- HOA
- −$0
- Vacancy / Maint / Mgmt
- −$1,211
- Net cashflow
- $-509
Break-even live
Sensitivity live
| Price | -10% $-102 | -5% $-305 | +0% $-509 | +5% $-712 | +10% $-916 |
|---|---|---|---|---|---|
| Rent | -10% $-964 | -5% $-736 | +0% $-509 | +5% $-281 | +10% $-53 |
| Rate | -1.0pp $-146 | -0.5pp $-326 | base $-509 | +0.5pp $-695 | +1.0pp $-884 |
UW: 25.0% down · 7.5% · 30yr · 1.5% tax · 5.0% vac · 8.0% maint · 8.0% mgmt
Financing live
Cash to close
- Down payment
- $179,750
- Closing costs
- $21,570
- Reserves months
- —
- Total cash needed
- —
Loan-product check · same deal, 3 products live
Conventional
25% down · 7.5% · 30yr
- Down + closing
- —
- Monthly P&I
- —
- Monthly cashflow
- —
- DSCR
- —
- Eligible?
- —
Personal DTI + credit; lowest rate.
DSCR
20% down · 8.5% · 30yr
- Down + closing
- —
- Monthly P&I
- —
- Monthly cashflow
- —
- DSCR
- —
- Eligible?
- —
No personal income docs; deal must DSCR.
Hard money
10% down · 12.0% · 12mo
- Down + closing
- —
- Monthly P&I
- —
- Monthly cashflow
- —
- DSCR
- —
- Eligible?
- —
Short-term bridge; refi at stabilization.
Rent comps 37 comps
| Address | Beds | Baths | Sqft | Rent | $/sqft | DOM | Units | Dist |
|---|---|---|---|---|---|---|---|---|
| 741 Lantana Ave Clearwater Beach, FL | 2.0 | 1.5 | 1077 | $3,695 | $3.43 | 19d | 1 | 0.08mi |
| 757 Mandalay Ave Clearwater Beach, FL | 3.0 | 2.0 | 1200 | $5,000 | $4.17 | 6d | 1 | 0.10mi |
| 819 Bay Esplanade Clearwater Beach, FL | 3.0 | 3.0 | 2068 | $10,000 | $4.84 | 26d | 1 | 0.12mi |
| 867 Mandalay Ave Clearwater Beach, FL | 3.0 | 2.0 | 1988 | $7,500 | $3.77 | 26d | 1 | 0.26mi |
| 690 Island Way Clearwater, FL | 1.0–2.0 | 1.5–2.5 | 1150 | $3,500 | $3.04 | 4d | 3 | 0.34mi |
| 880 Mandalay Ave Clearwater, FL | 2.0 | 1.0–2.0 | 787 | $4,995 | $6.34 | 5d | 9 | 0.35mi |
| 880 Mandalay Ave Clearwater, FL | 2.0 | 1.0–2.0 | 787 | $4,995 | $6.34 | 0d | 8 | 0.35mi |
| 670 Island Way #1006 Clearwater Beach, FL | 3.0 | 2.5 | 1854 | $4,400 | $2.37 | 26d | 1 | 0.38mi |
| 929 Lantana Ave Clearwater Beach, FL | 3.0 | 3.0 | 2056 | $6,000 | $2.92 | 6d | 1 | 0.41mi |
| 650 Island Way Clearwater, FL | 2.0 | 2.0 | 1355 | $3,150 | $2.32 | 15d | 1 | 0.49mi |
| 650 Island Way Clearwater, FL | 2.0 | 2.0 | 1355 | $3,050 | $2.25 | 19d | 2 | 0.49mi |
| 15 Avalon St Clearwater, FL | 3.0 | 3.5 | 2640 | $12,000 | $4.54 | 19d | 3 | 0.50mi |
| 15 Avalon St Clearwater, FL | 3.0 | 3.5 | 2394 | $13,500 | $5.64 | 15d | 2 | 0.50mi |
| 644 Island Way #304 Clearwater Beach, FL | 2.0 | 2.0 | 1335 | $2,700 | $2.02 | 26d | 1 | 0.54mi |
| 610 Island Way #608 Clearwater Beach, FL | 2.0 | 2.0 | 1270 | $2,900 | $2.28 | 25d | 1 | 0.59mi |
| 521 Mandalay Ave #410 Clearwater Beach, FL | 3.0 | 3.0 | 2087 | $10,000 | $4.79 | 26d | 1 | 0.67mi |
| 521 Mandalay Ave #1109 Clearwater Beach, FL | 3.0 | 3.0 | 2087 | $8,500 | $4.07 | 26d | 1 | 0.67mi |
| 501 Mandalay Ave #309 Clearwater Beach, FL | 3.0 | 3.0 | 2087 | $9,000 | $4.31 | 26d | 1 | 0.72mi |
| 505 Mandalay Ave #62 Clearwater Beach, FL | 2.0 | 2.5 | 1619 | $5,000 | $3.09 | 23d | 1 | 0.72mi |
| 11 Baymont St Clearwater, FL | 2.0 | 2.0 | 1680 | $11,250 | $6.70 | 26d | 2 | 0.79mi |
| 11 San Marco St #1206 Clearwater Beach, FL | 2.0 | 2.0 | 1460 | $7,000 | $4.79 | 26d | 1 | 0.86mi |
| 10 Papaya St #1204 Clearwater Beach, FL | 2.0 | 2.0 | 1675 | $6,500 | $3.88 | 26d | 1 | 0.90mi |
| 415 Island Way Clearwater, FL | 2.0–3.0 | 2.0 | 1721 | $7,500 | $4.36 | 19d | 5 | 0.92mi |
| 415 Island Way Clearwater, FL | 2.0–3.0 | 2.0 | 1765 | $7,500 | $4.25 | 0d | 4 | 0.92mi |
| 415 Island Way Clearwater, FL | 2.0–3.0 | 2.0 | 1765 | $7,500 | $4.25 | 3d | 4 | 0.92mi |
| 400 Island Way Clearwater, FL | 2.0 | 2.0 | 1315 | $3,075 | $2.34 | 5d | 5 | 0.94mi |
| 400 Island Way Clearwater, FL | 2.0 | 2.0 | 1315 | $2,975 | $2.26 | 26d | 5 | 0.94mi |
| 255 Dolphin Pt Clearwater, FL | 1.0–2.0 | 1.0–2.0 | 1055 | $2,950 | $2.80 | 0d | 5 | 0.99mi |
| 255 Dolphin Pt Clearwater, FL | 1.0–2.0 | 1.0–2.0 | 1055 | $2,950 | $2.80 | 19d | 4 | 0.99mi |
| 240 Windward Passage #401 Clearwater Beach, FL | 3.0 | 2.5 | 1886 | $6,500 | $3.45 | 15d | 1 | 1.06mi |
| 240 Windward Passage #401 Clearwater Beach, FL | 3.0 | 2.5 | 1886 | $6,500 | $3.45 | 16d | 1 | 1.06mi |
| 223 Island Way Unit 7F Clearwater Beach, FL | 3.0 | 3.0 | 1960 | $4,999 | $2.55 | 16d | 1 | 1.09mi |
| 125 Island Way #502 Clearwater Beach, FL | 3.0 | 2.0 | 1850 | $4,900 | $2.65 | 26d | 1 | 1.13mi |
| 121 Island Way #323 Clearwater Beach, FL | 2.0 | 2.0 | 1090 | $2,950 | $2.71 | 9d | 1 | 1.17mi |
| 105 Island Way Clearwater, FL | 2.0 | 2.0 | 1090 | $3,400 | $3.12 | 26d | 3 | 1.21mi |
| 110 Devon Dr Clearwater Beach, FL | 3.0 | 2.0 | 1377 | $6,500 | $4.72 | 26d | 1 | 1.28mi |
| 185 Brightwater Dr #6 Clearwater, FL | 2.0 | 2.0 | 1430 | $3,900 | $2.73 | 26d | 1 | 1.49mi |
Listing history 15 events
-
2026-05-17status Pending
-
2026-01-02status Active
-
2025-12-31historical
-
2025-08-30status Active
-
2025-08-13status Pending
-
2025-04-14$719,000 Active
-
2024-10-31historical
-
2024-07-21price $995,000
-
2024-03-14$1,050,000 Active
-
2007-06-19$549,900
-
2006-08-16$599,000
-
2006-02-07$625,000
-
2001-06-13soldstatus $225,000
-
2001-05-24soldstatus $130,000
-
1994-06-28soldstatus $170,000
ⓘ Source: listings_history table (triggers on properties + properties_extension) + one-shot
backfill from property_details.listing_events for pre-trigger history.
Tax reassessment forecast FL · Resets to sale price
- Current annual tax
- $6,802 · $567/mo
- Projected year-2 tax
- $6,802 · $567/mo
- Expected delta
- $0/yr ($0/mo · 0.0%)
ⓘ Screening estimate from a state-policy table — verify with the county assessor before closing.
Climate risk First Street
- Flood 10/10 Extreme FEMA zone AE · 99% chance over 30 yrs
- Wildfire 1/10 Low
- Heat 10/10 Extreme 8 d/yr ≥110°F today · 29 d/yr by 30 yrs out
- Wind 10/10 Extreme 99% chance of damaging wind over 30 yrs
- Air quality 3/10 Moderate 2 unhealthy d/yr today · 3 by 30 yrs out
Nearby sold comps map
Loading sold comps map…
Walkable amenities ~0.75 mi
Loading nearby amenities…
Taxation est. · year 1
- Rental income
- $69,189
- − Mortgage interest
- −$40,275
- − Property taxes
- −$6,802
- − Insurance
- −$8,714
- − Repairs & maintenance
- −$5,535
- − Management
- −$5,535
- − Depreciation
- −$20,916
- Taxable loss
- −$18,588
- Est. tax savings @ 24.0%
- +$4,461
- After-tax cash flow
- $-1,641/yr
For passive investors: Depreciation is non-cash, so a rental often shows a tax loss while cash-flowing — sheltering income. Rental losses are passive: they offset passive income freely, and up to $25,000/yr can offset ordinary (W-2) income if you actively participate and your MAGI is under $100k (phasing out to $0 by $150k); unused losses carry forward. On sale, claimed depreciation is recaptured at up to 25%, and gains may owe capital-gains tax (a 1031 exchange can defer both). Figures are a year-1 estimate at your 24.0% rate — not tax advice; consult a CPA.
Schools (NCES district)
- District
- Pinellas
- NCES district ID
- 1201560
- Math proficiency
- 51% ▼ -5.00%
- Reading proficiency
- 51% ▼ -3.00%
- Median HH income
- $46,270
- Composite
- 43.27/100
- National rank
- #3046
- State rank
- #31 of 73 in FL
Livability — Clearwater
- Score
- 82/100
- State rank
- #60
- US rank
- #988
Category grades
Schools grade is shown separately in the Schools card above.
Census & demographics
- Census place
- Clearwater, FL
- County
- Pinellas County · 939,478 people
- City population
- 170,933
- Metro
- Tampa-St. Petersburg-Clearwater, FL
- Population (ZIP)
- 8,081
- Household income
- $117,425
- Rent vs Own
- Severe rent burden
- 295.0
Population outlook (Pinellas County) Hauer SSP2
- Today (2025)
- 1,027,532 people
- By 2030
- 1,063,586 · +3.5%
- By 2040
- 1,125,020 · +9.5%
- By 2050
- 1,168,637 · +13.7%
- By 2075
- 1,265,188 · +23.1%
- By 2100
- 1,260,357 · +22.7%
Race, ethnicity, and origin ACS 2023
- Neighborhood character
- Predominantly White (92%)
- Race & ethnicity
- White 92% Hispanic / Latino 4% Two or more races 4% Asian 2%
- Common ancestry
- Romanian 6% Italian 3% Slovak 2%
- Foreign-born
- 14% · Canada, China
- Languages at home
- 88% English-only · Other Indo-European 4% Spanish 2% Arabic 2%
Political lean MEDSL · Pinellas
- 2024 margin
- Lean R (+5.2) · D 46.9% · R 52.1%
- 2008→2024 swing
- -13.5pp toward R · 2008: 8.3pp · 2024: -5.2pp
- All cycles
- 2024: R+5.2 2020: D+0.2 2016: R+1.1 2012: D+5.6 2008: D+8.3
Not yet ingested
- Civics
- —
Market trends
- HPI YoY
- ▲ 1.88%
- Current HPI
- 297.7165
- Rent YoY
- ▲ 2.76%
- Metro
- Tampa-St. Petersburg-Clearwater, FL
- State GDP YoY
- ▲ 3.28%
- F500 in state
- 36
Industry mix (Fortune 500 HQ in FL)
| Industry | F500 HQs | Revenue |
|---|---|---|
| Industrial Technology | 2 | $29B |
|
||
| Insurance | 2 | $17B |
|
||
| Retail | 1 | $60B |
|
||
| Technology Distribution | 1 | $58B |
|
||
| Homebuilding | 1 | $35B |
|
||
| Technology Manufacturing | 1 | $35B |
|
||
Price history
+322.9% since first listed15 events — show timeline
- 2026-05-17 Pending — Stellar MLS as Distributed by MLS Grid
- 2026-01-02 Relisted — Stellar MLS as Distributed by MLS Grid
- 2025-12-31 Listing Removed — Stellar MLS as Distributed by MLS Grid
- 2025-08-30 Relisted — Stellar MLS as Distributed by MLS Grid
- 2025-08-13 Pending — Stellar MLS as Distributed by MLS Grid
- 2025-04-14 Listed $719,000 Stellar MLS as Distributed by MLS Grid
- 2024-10-31 Listing Removed — Stellar MLS as Distributed by MLS Grid
- 2024-07-21 Price Changed $995,000 Stellar MLS as Distributed by MLS Grid
- 2024-03-14 Listed $1,050,000 Stellar MLS as Distributed by MLS Grid
- 2007-06-19 Listed $549,900 Stellar MLS as Distributed by MLS Grid
- 2006-08-16 Listed $599,000 Stellar MLS as Distributed by MLS Grid
- 2006-02-07 Listed $625,000 Stellar MLS as Distributed by MLS Grid
- 2001-06-13 Sold (Public Records) $225,000 Public Records
- 2001-05-24 Sold (Public Records) $130,000 Public Records
- 1994-06-28 Sold (Public Records) $170,000 Public Records
Property tax history
+2.0%/yrLatest (2025): $6,802 · -3.0% YoY. Source: county tax records.
Cash-flow waterfall
monthlySold comps — $/sqft
last 12 mo · ≤1 miLoading sold comps…